


Statistical Relationships between Ionospheric Upflows and Various Parameters during Geomagnetic Storms
-
摘要:
利用FAST卫星1997 - 2006年34个磁暴期149个轨道的观测数据,分析不同相位上行通量数量级,研究不同相位离子上行能通量与地磁活动Sym-H指数和Kp指数,以及注入的Poynting通量之间的关系,构造上行通量经验模型。研究结果表明:磁暴主相期间,上行离子能通量可超过108 eV·cm–2·s–1·sr–1·eV –1量级,初相和恢复相期,上行离子能通量可超过107 eV·cm–2·s–1·sr–1·eV –1量级,主相期能通量均值普遍高于初相和恢复相;磁暴初相期间,上行离子能通量与Sym-H、Kp以及Poynting通量成显著正相关,相关系数分别为0.890、0.664和0.660;磁暴主相期间相关系数分别为0.858、0.823和0.541。以磁暴主相为例,上行离子能通量与Sym-H和Poynting通量的经验公式为
\begin{document}$ {J}_{{i}^{+}}={10}^{5.324 \pm 0.581}\times {\left(\mathrm{S}\mathrm{y}\mathrm{m}{\text{-}}H\right)}^{1.465 \pm 0.340} $\end{document} ,
$ {J}_{{i}^{+}}={10}^{6.469 \pm 0.798}\times {{S}_{\mathrm{d}\mathrm{c}}}^{0.888 \pm 0.703} $ 。初相期间,由于地磁扰动时能量快速注入,电离层离子迅速获能,上行离子能通量与地磁扰动指数呈现较高的相关性,同时主相期上行离子能通量的增幅跨越两个量级;向下的Poynting通量导致的焦耳耗散是离子获能的重要来源之一,因此上行离子能通量与Poynting通量有较强的相关性。恢复相期间地磁活动趋于平静,上行离子能通量低于主相期的能通量。
-
关键词:
- 磁暴期 /
- 离子上行 /
- 地磁活动指数 /
- Poynting通量 /
- 经验方程
Abstract:A collection of data from 149 orbits by the Fast Auroral SnapshoT (FAST) mission during 34 geomagnetic storms from 1997 to 2006 is used to analyze the energy flux of upflowing ions as a function of storm phases, and analyze the relationships between the flux and the parameters, including Sym-H index, Kp index, and the Poynting flux to construct empirical models. Results show that, in the main phase of the storm, the energy flux exceeds 108 eV·cm–2·s–1·sr–1·eV –1, and in the initial and recovery phases, the energy flux can exceed 107 eV·cm–2·s–1·sr–1·eV –1. The averaged energy flux in the main phase is higher than that in the initial and recovery phases. In the initial phase, the flux is significantly positively correlated to Sym-H, Kp and the Poynting flux. The correlation coefficients are 0.890, 0.664 and 0.660, respectively. In the main phase, the correlation coefficients are 0.858, 0.823 and 0.541, respectively. Empirical formulas for the energy flux as functions of the Sym-H and the Poynting flux are constructed. In the main phase,
\begin{document}$ {J}_{{i}^{+}}={10}^{5.324 \pm 0.581}\times {\mathrm{S}\mathrm{y}\mathrm{m}{\text{-}}H}^{1.465 \pm 0.340} $\end{document} ,
$ {J}_{{i}^{+}}={10}^{6.469 \pm 0.798}\times $ $ {{S}_{\mathrm{d}\mathrm{c}}}^{0.888 \pm 0.703} $ . In the initial phase, due to the rapid injection of the energy during geomagnetic disturbance and the rapid energy acquisition of ionospheric ions, the ion energy flux is highly correlated with the geomagnetic disturbance indices. Meanwhile, the energy flux increases by two orders of magnitude in the main phase. The Joule dissipation caused by the downward Poynting flux is one of the important sources of ion energy acquisition, and a strong correlation is observed.
-
Key words:
- Geomagnetic storms /
- Upflow ions /
- Geomagnetic activity indices /
- Poynting flux /
- Empirical formulas
-
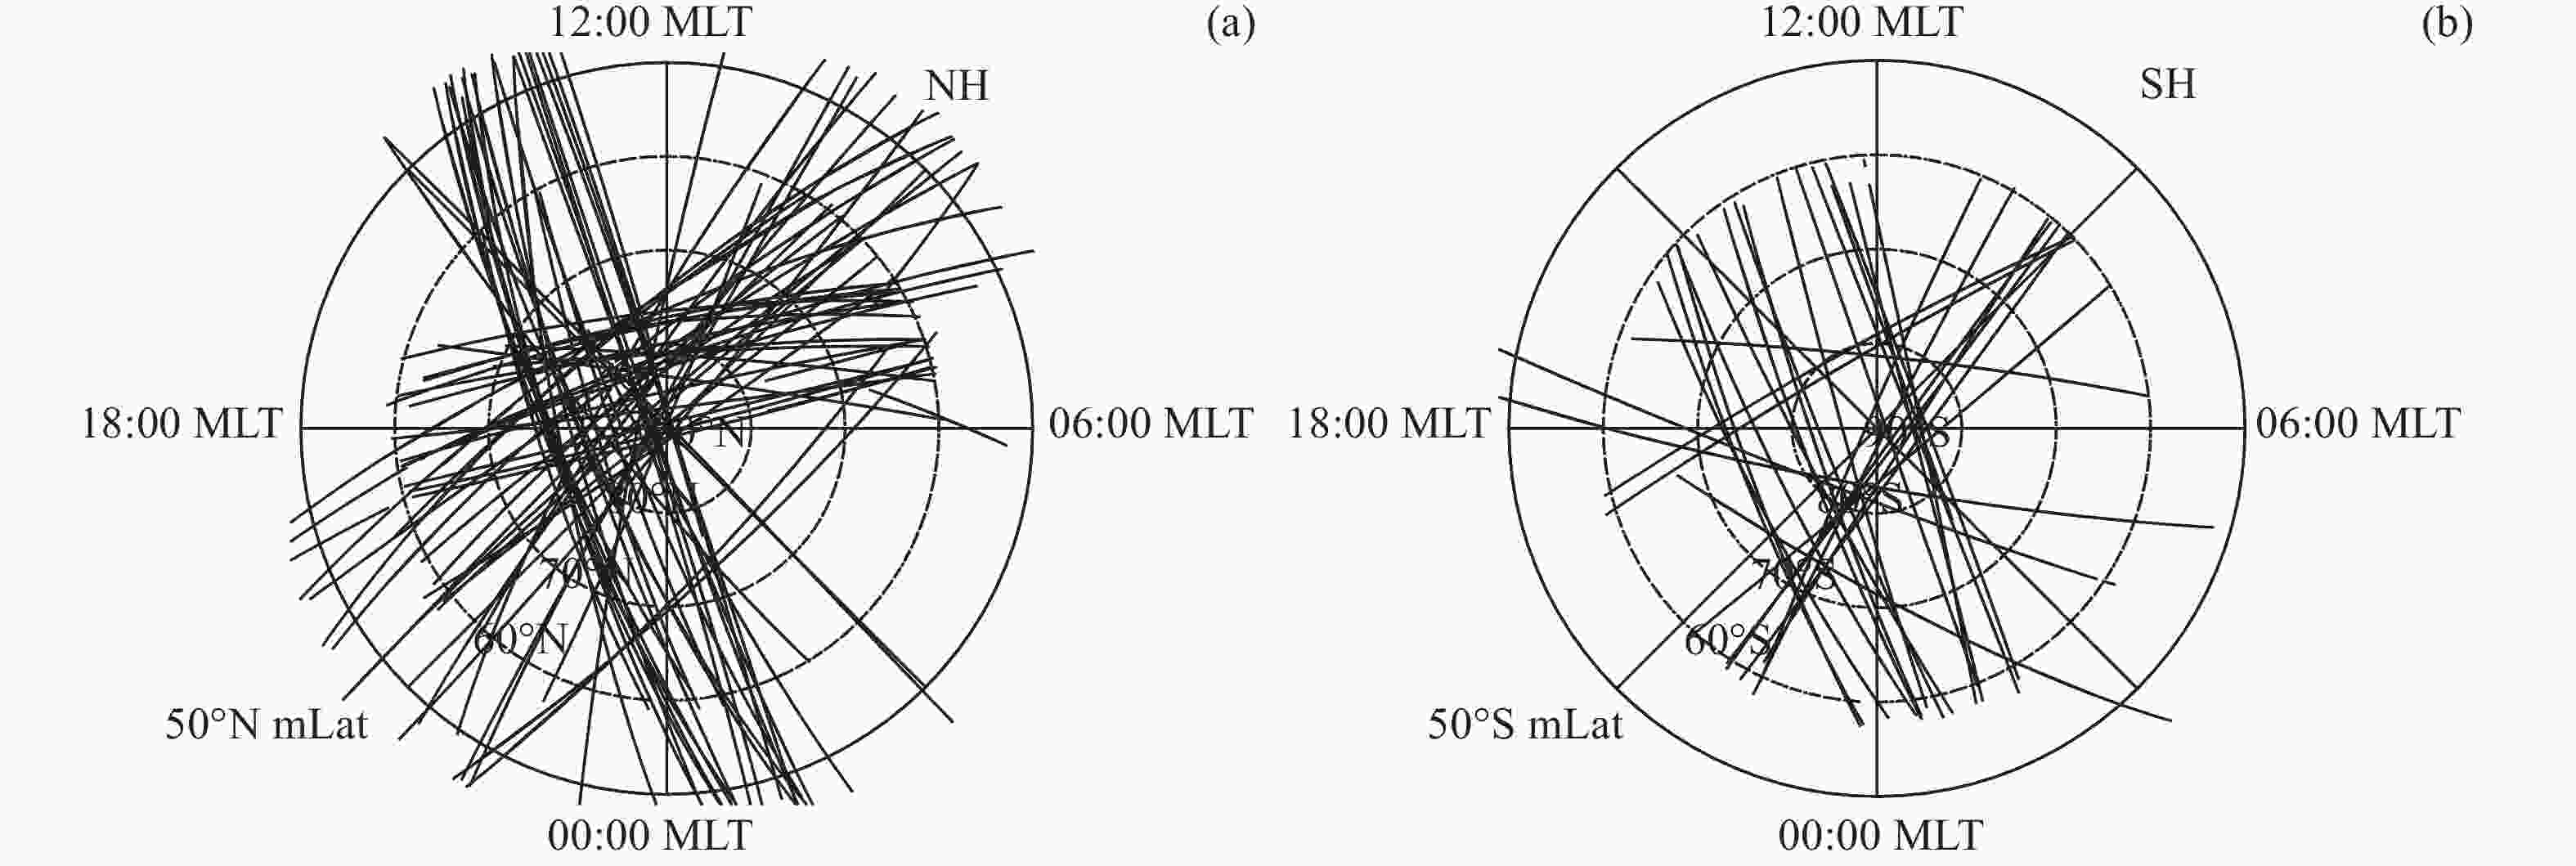
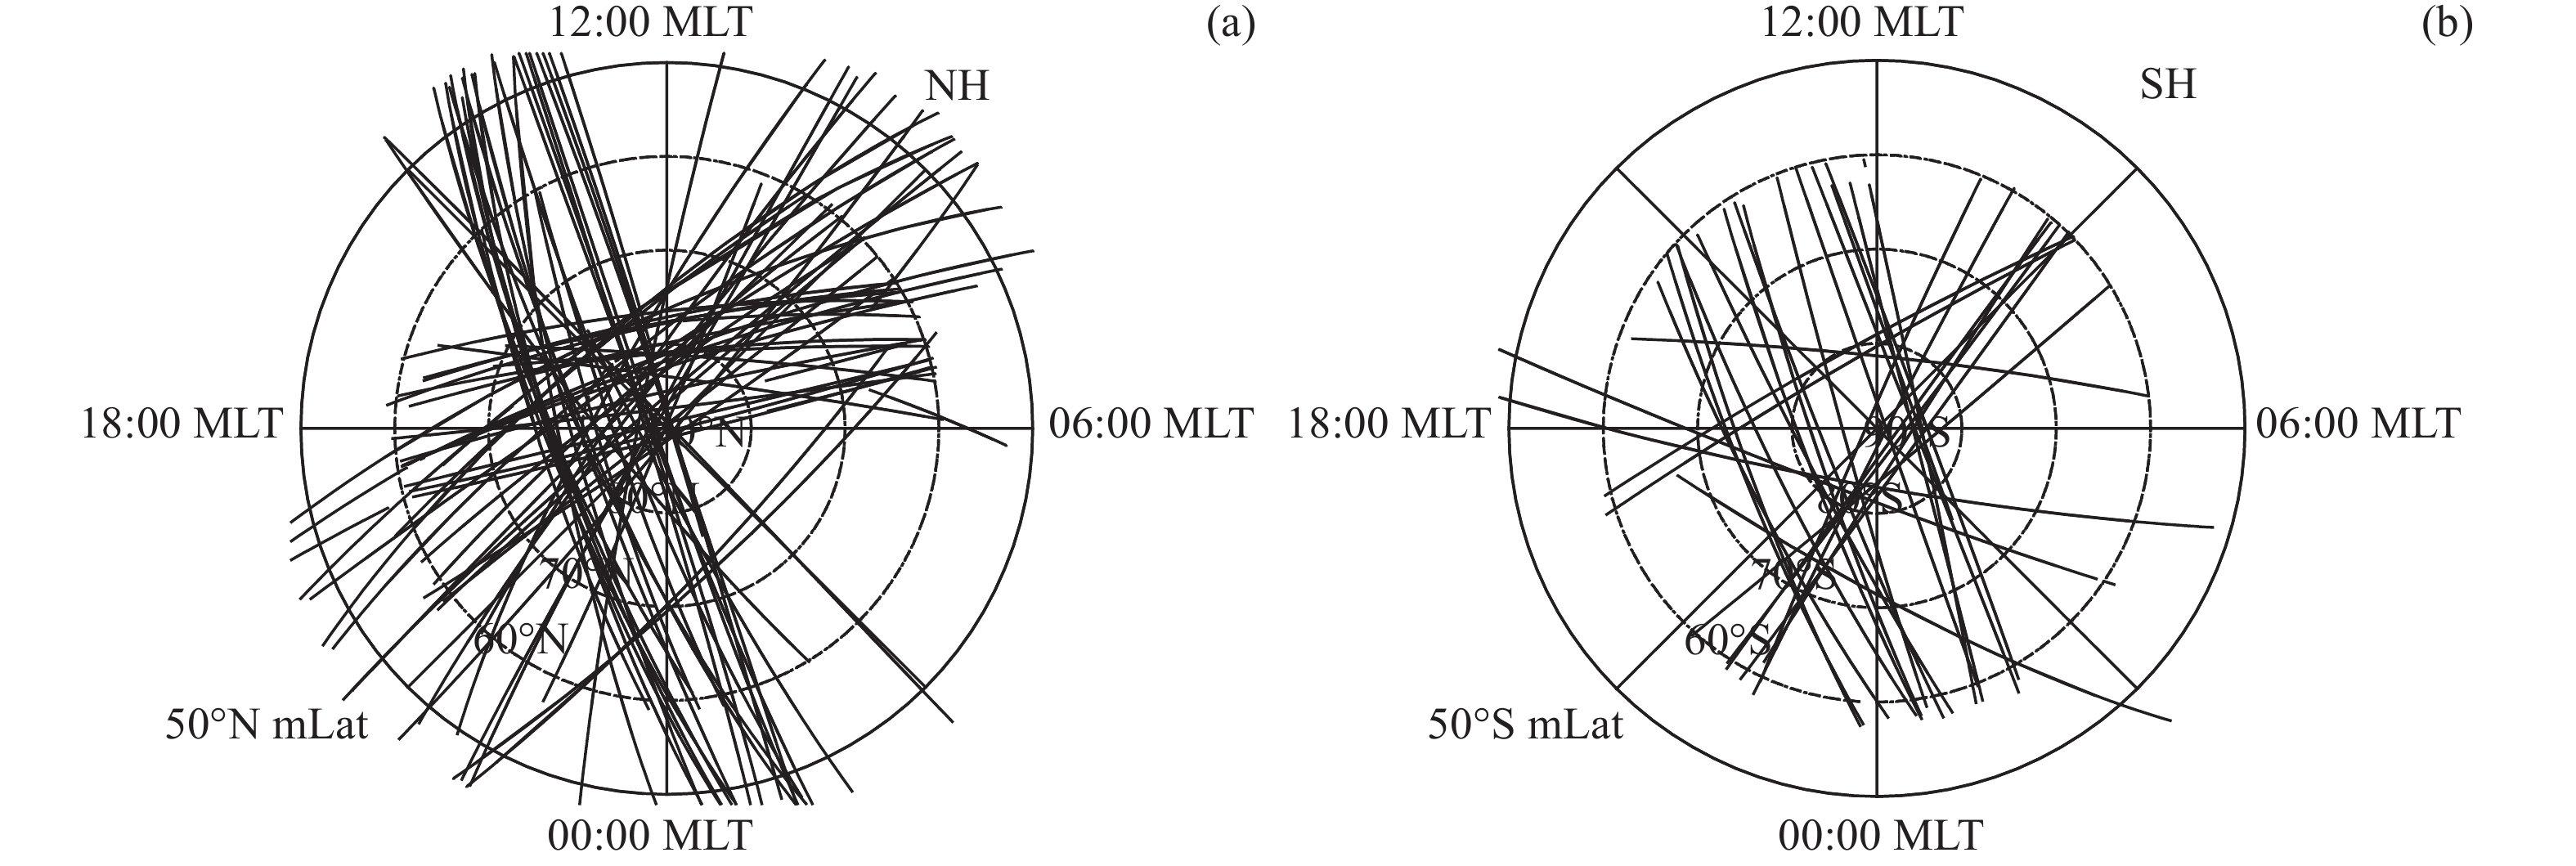
图 1 事件的空间分布。(a)北半球(NH)观测数据分布,(b)南半球(SH)观测数据分布
Figure 1. Spatial distribution of selected events. (a) and (b) are observations in the Northern Hemisphere (NH) and the Southern Hemisphere (SH), respectively
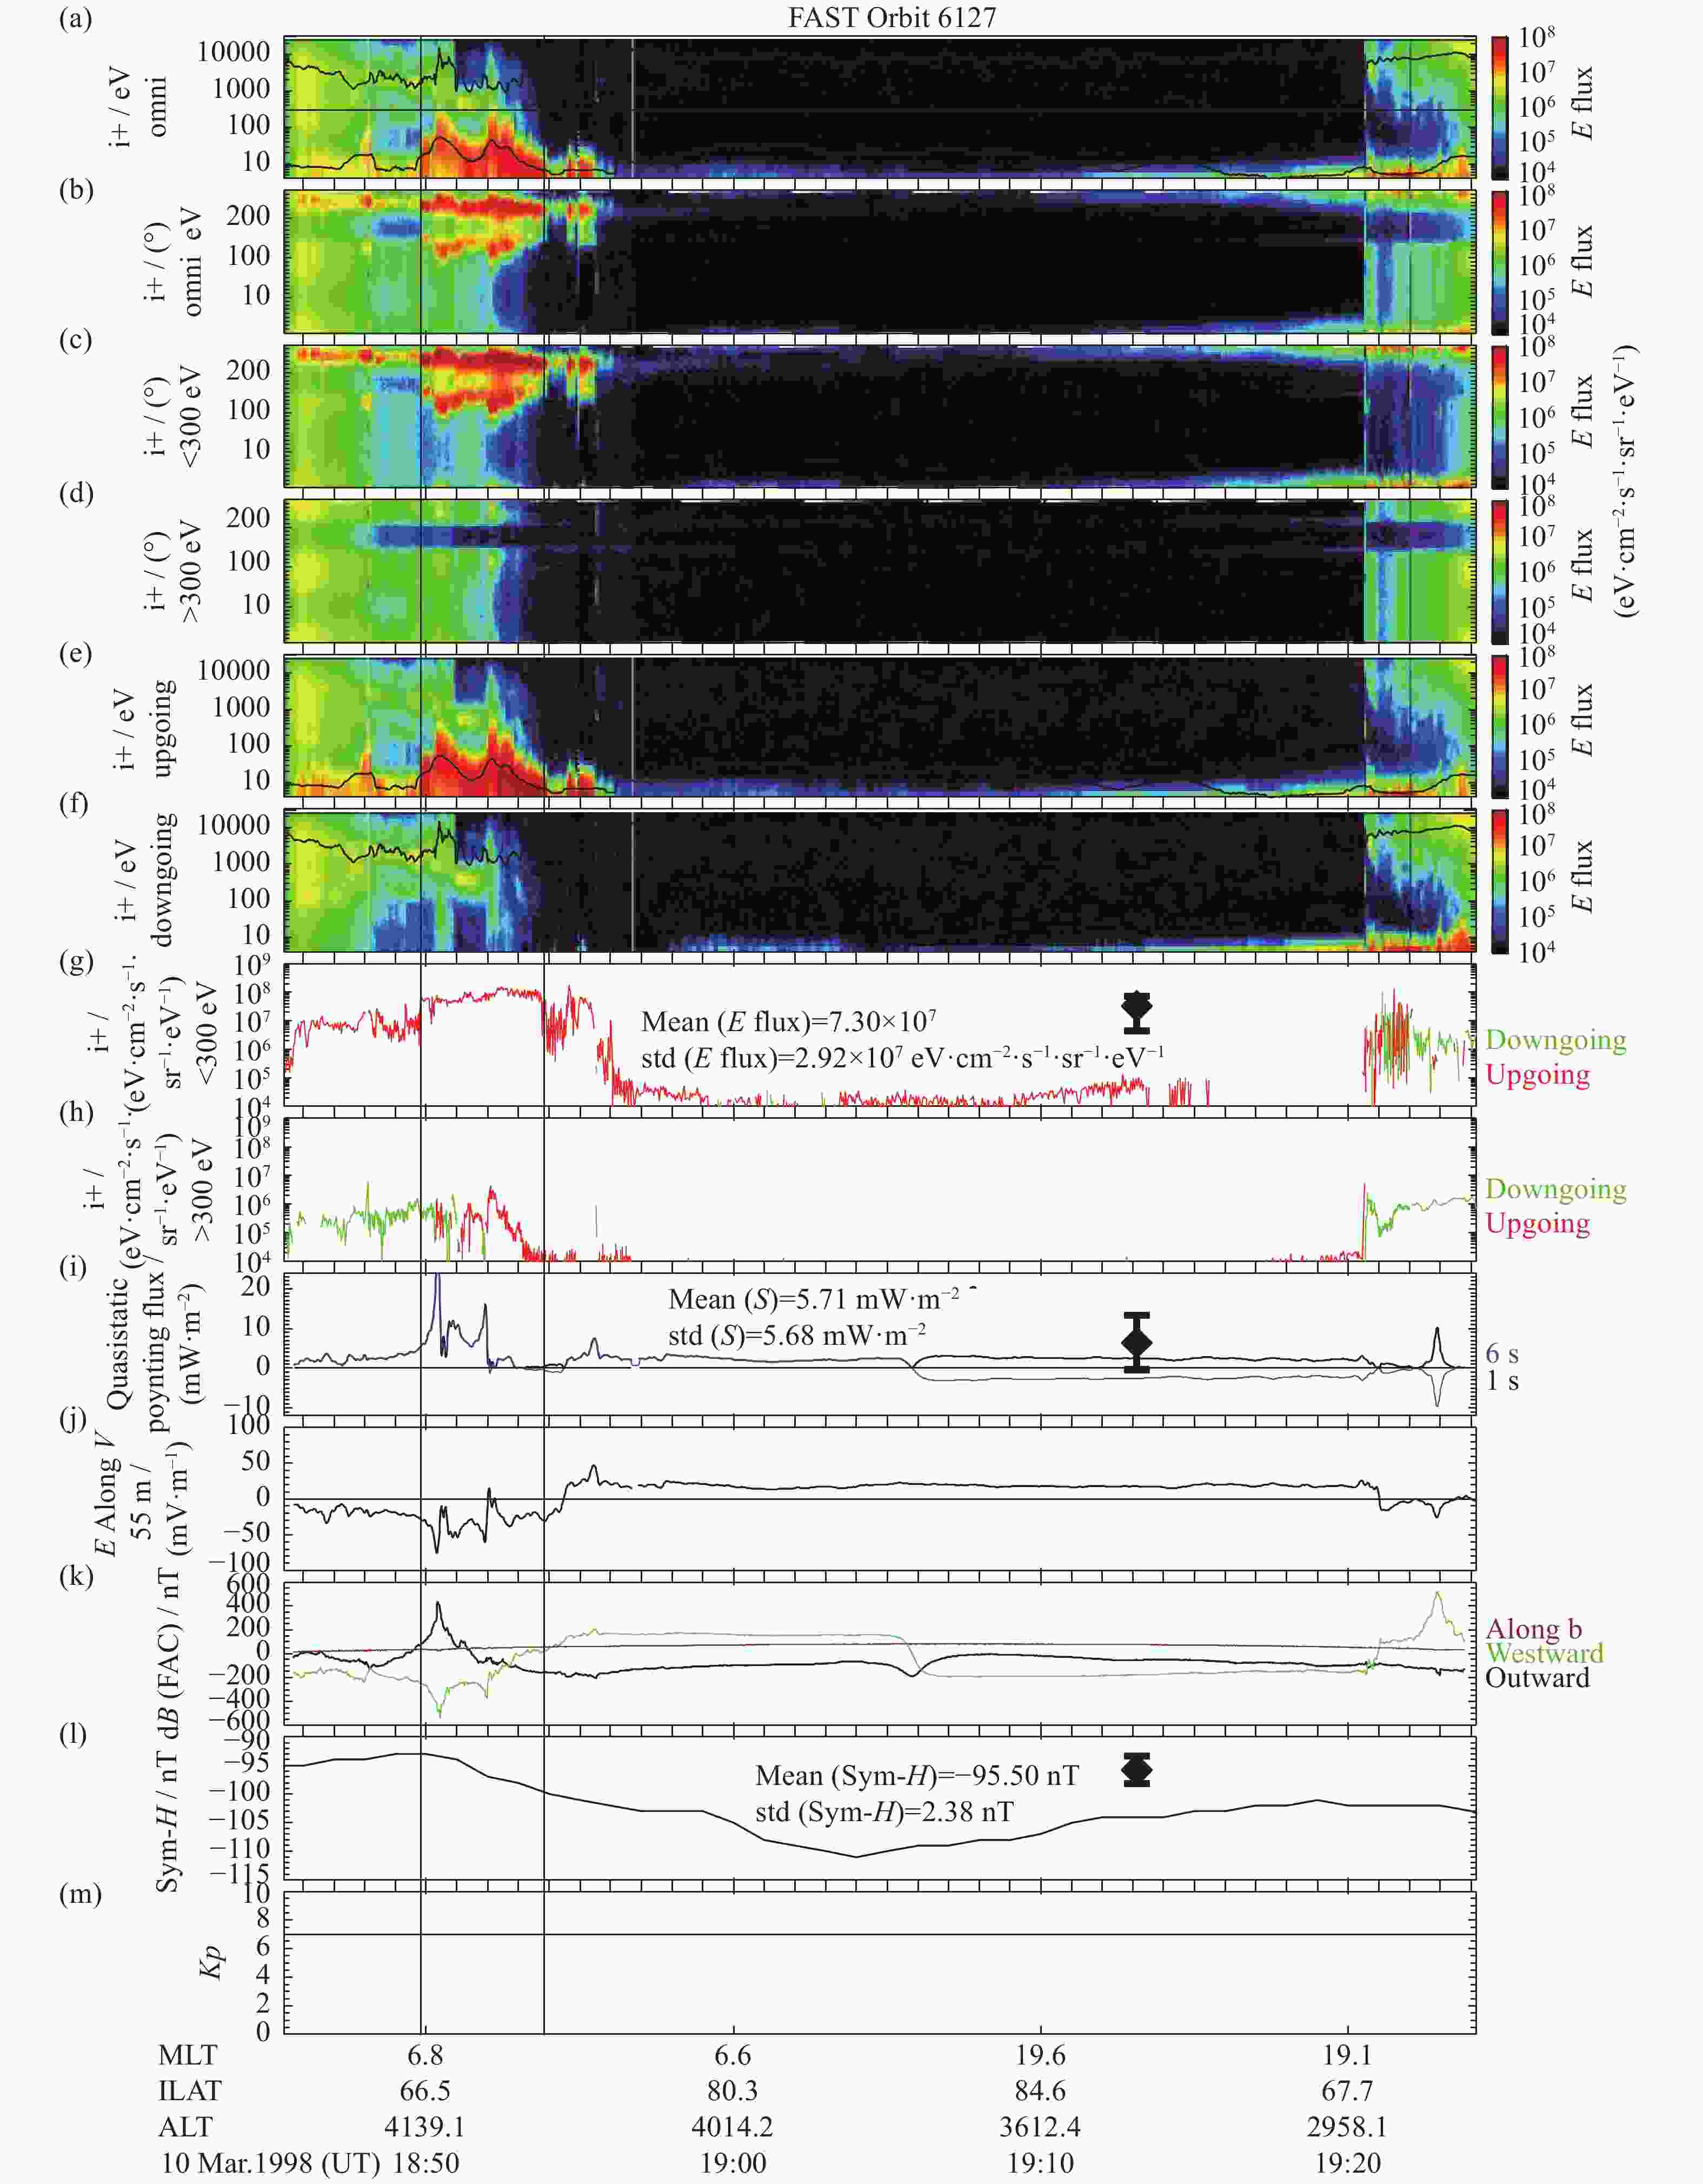
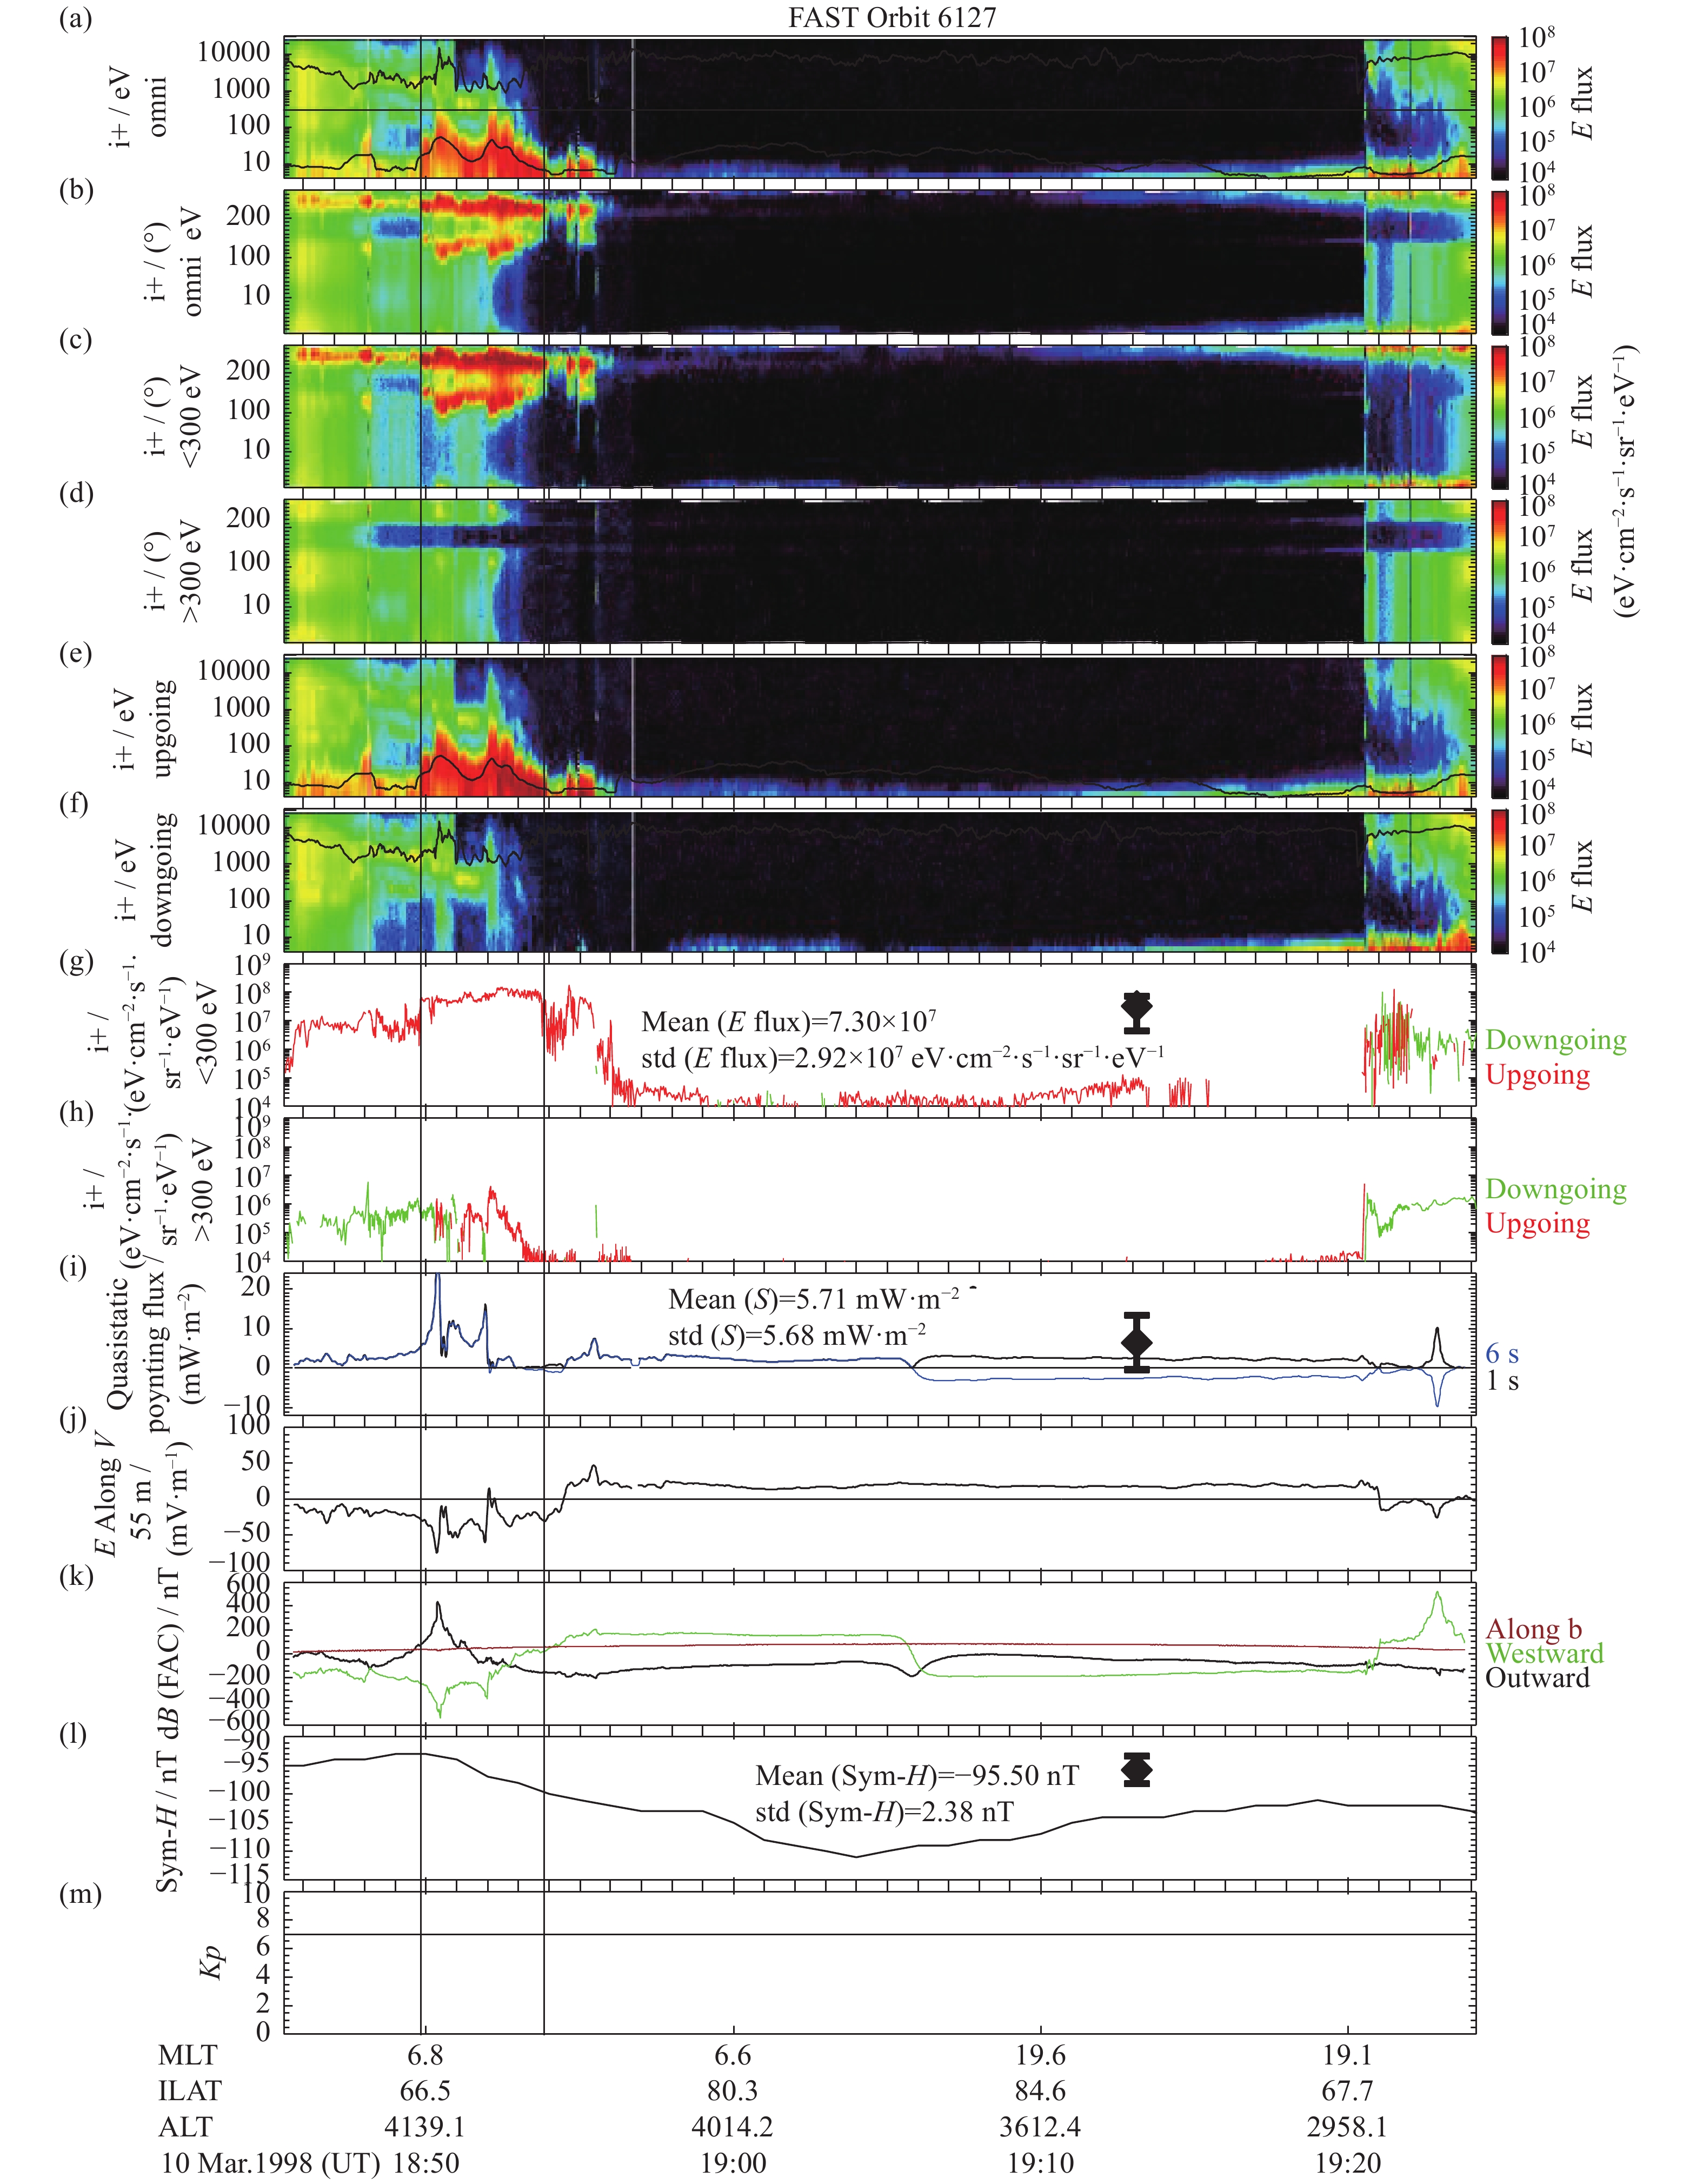
图 2 1998年3月10日磁暴(Kp=7)主相期间FAST卫星观测到的离子上行事件
Figure 2. Upflow event observed by FAST spacecraft on the main phase of the geomagnetic storm on 10 March 1998, when the Kp index is 7
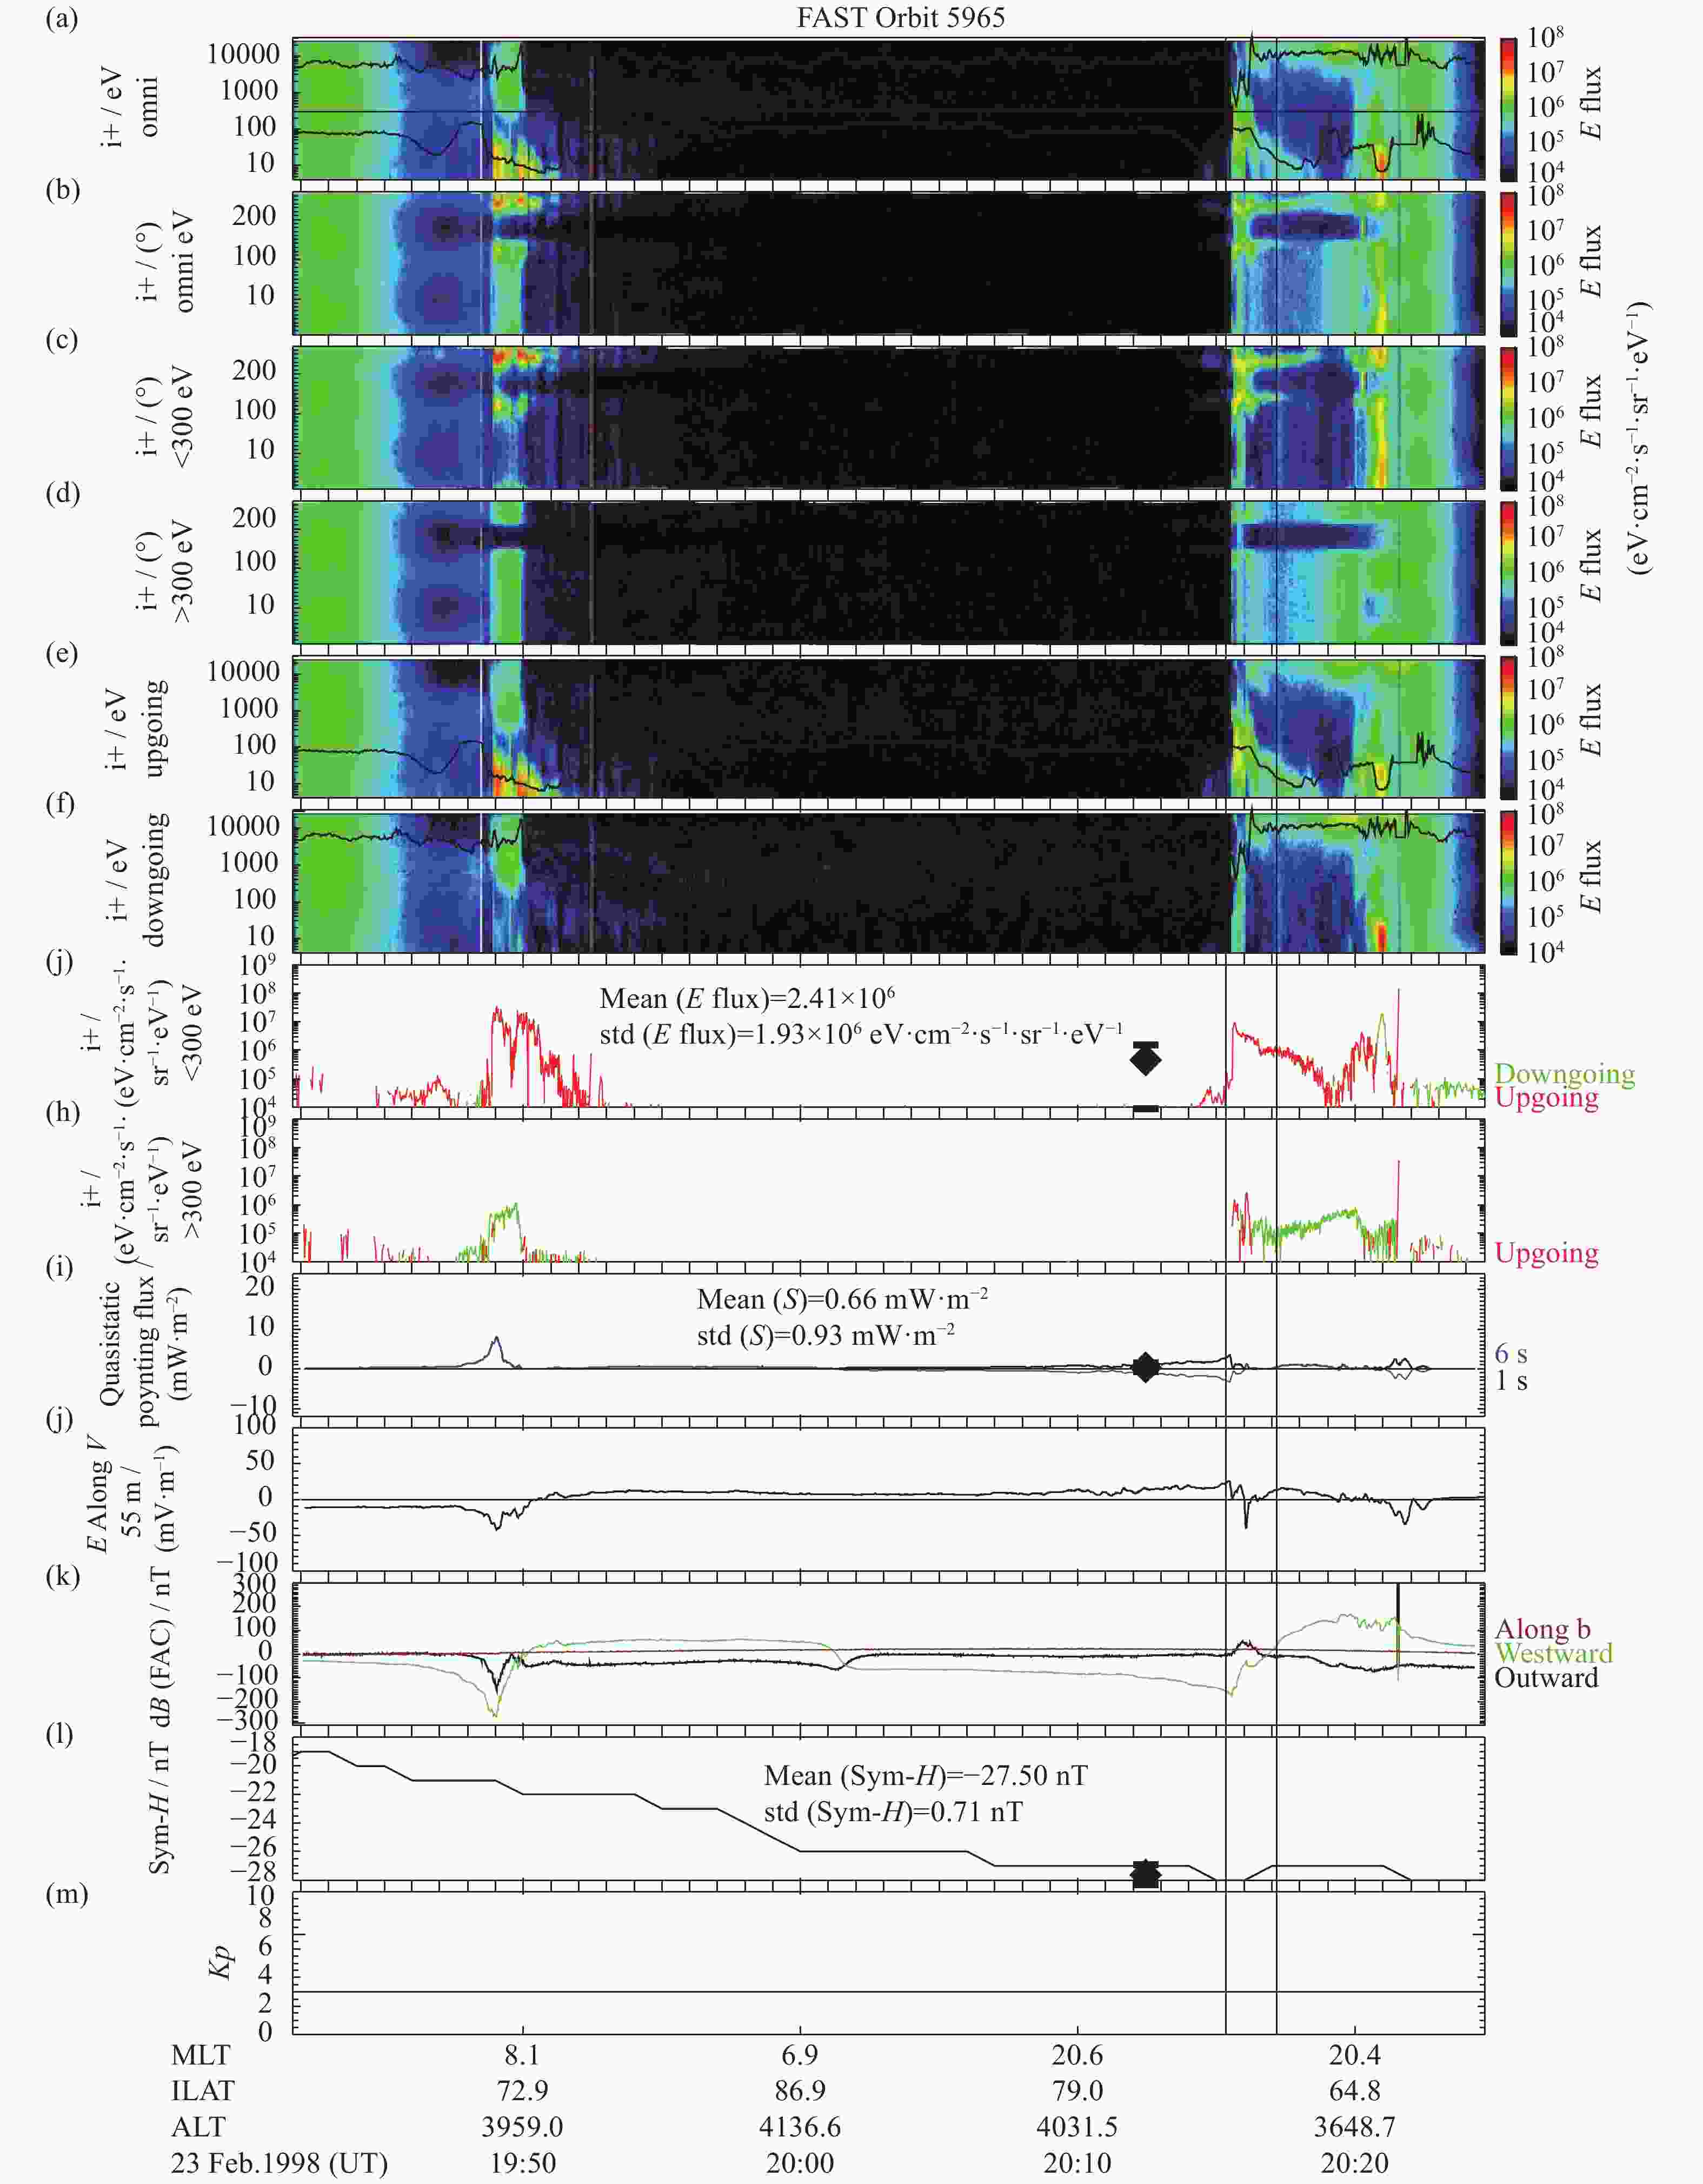
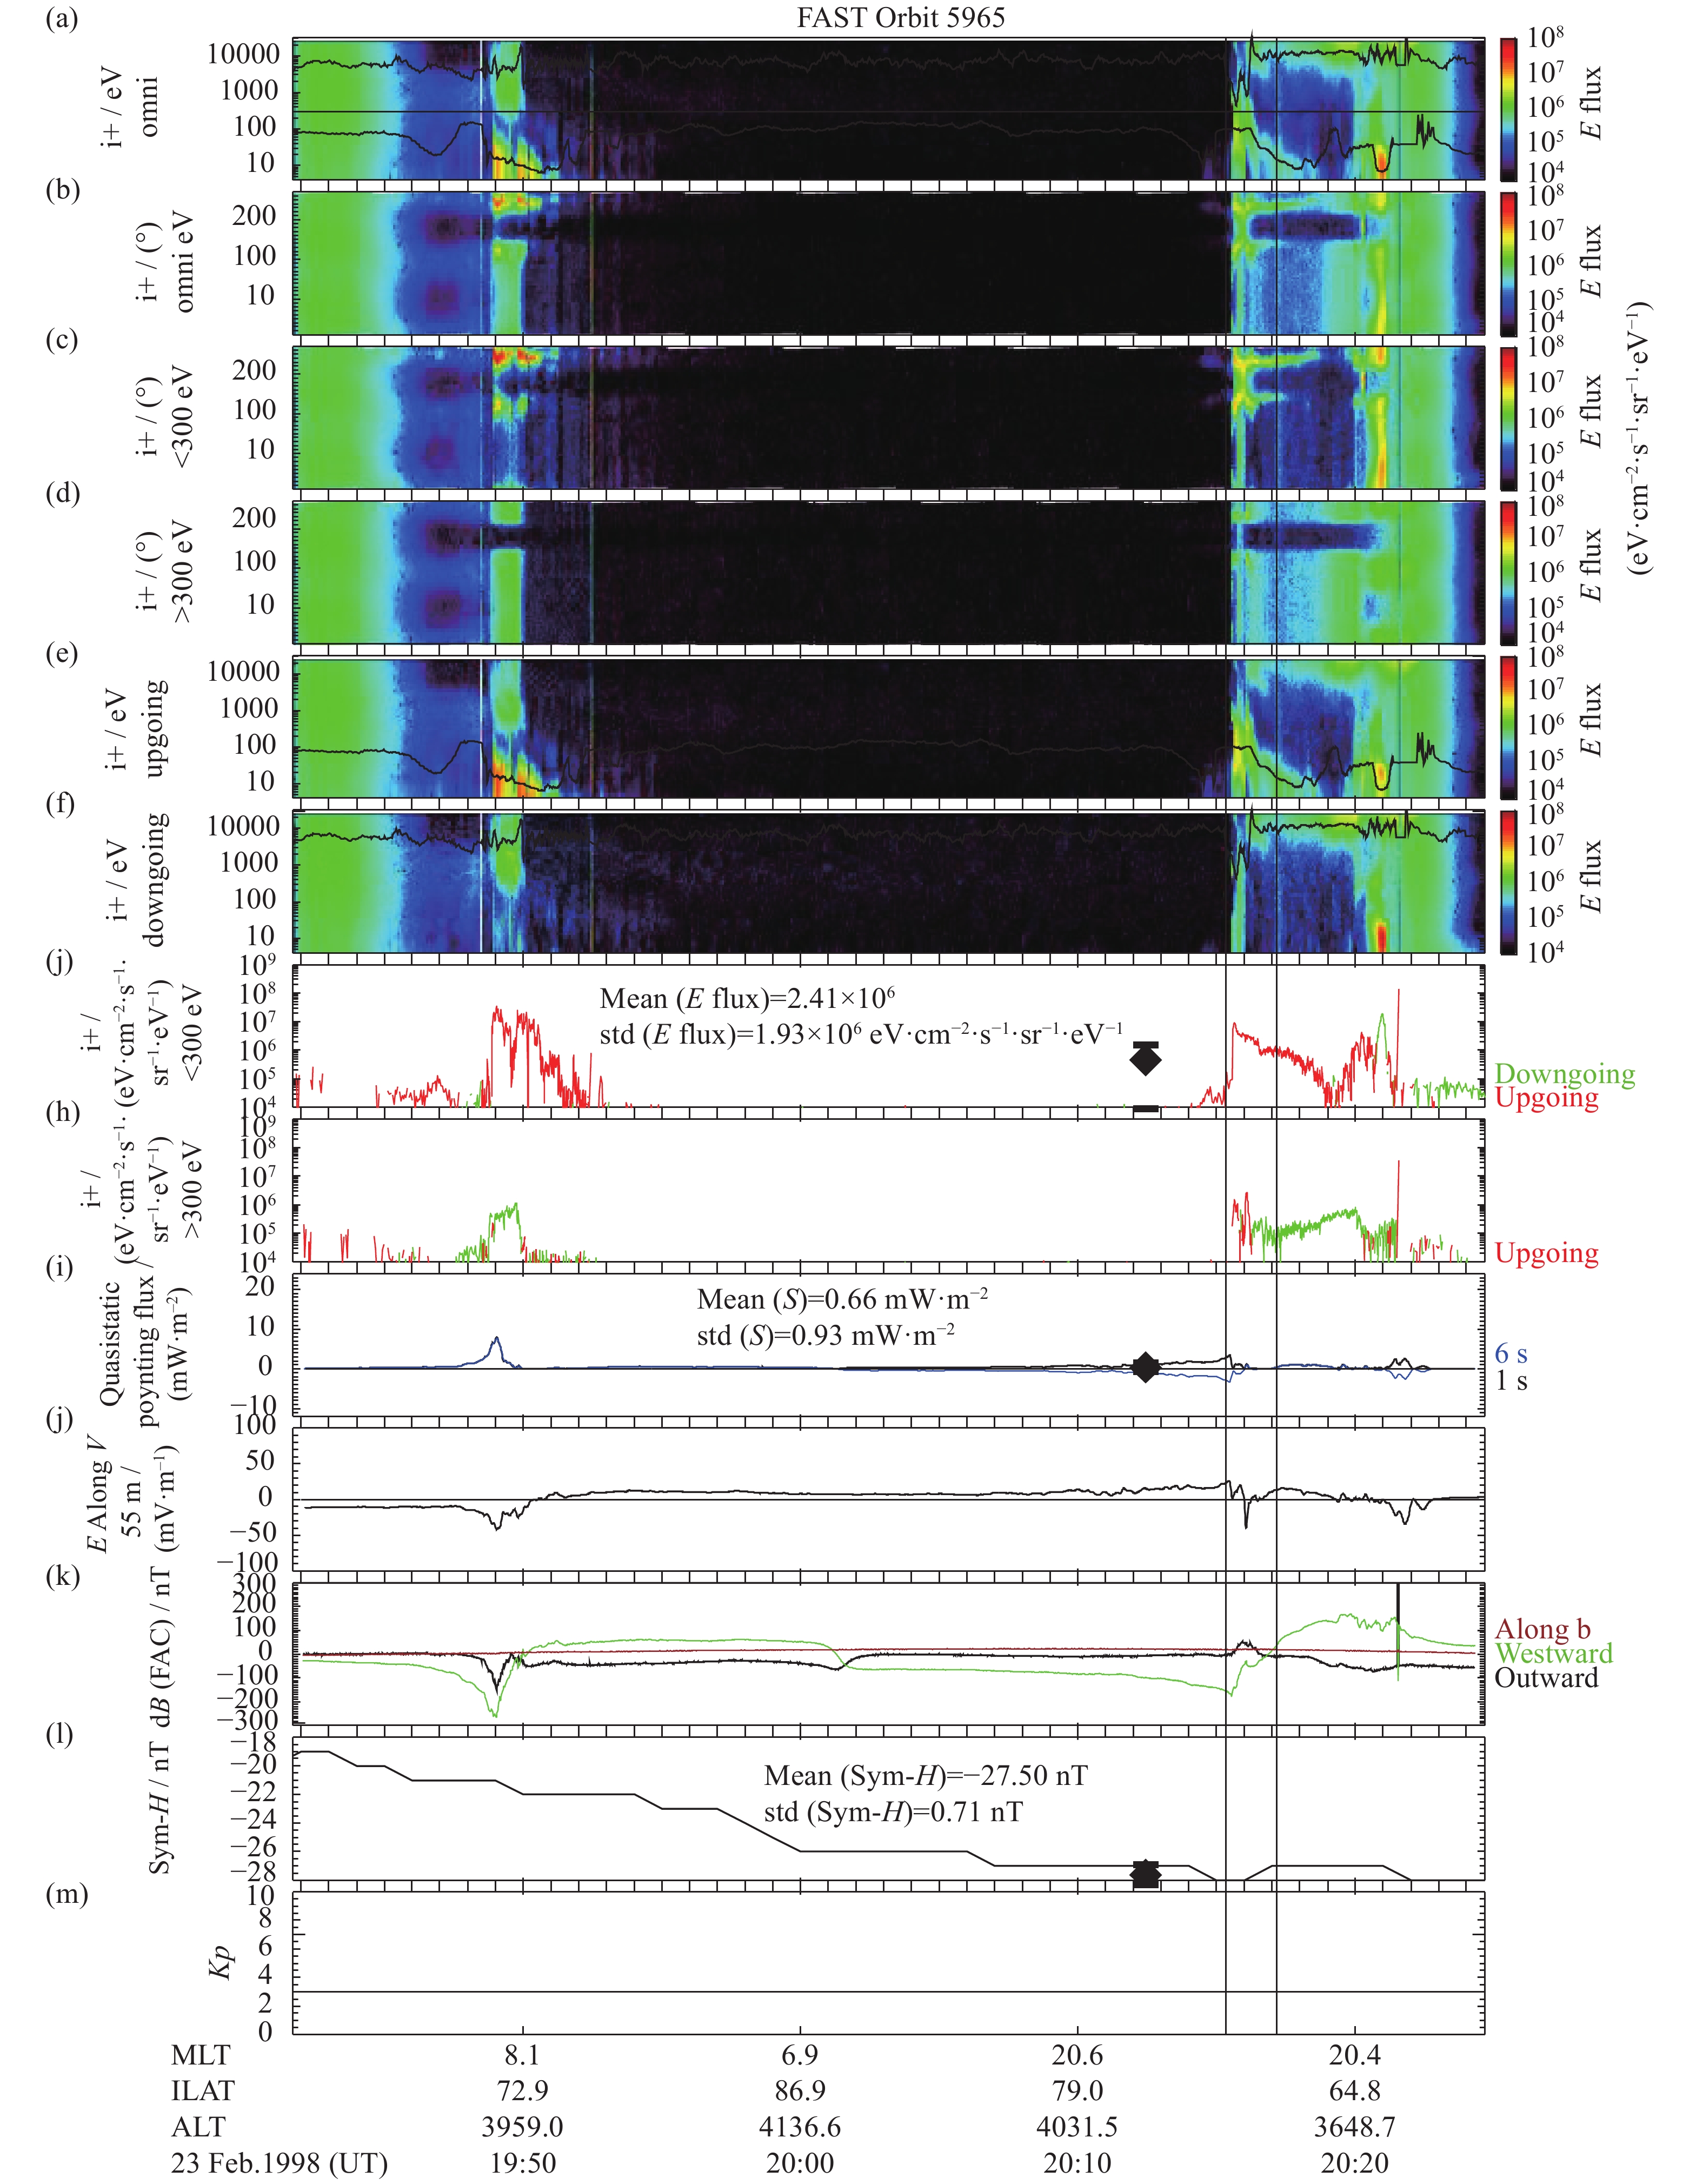
图 3 1998年2月23日磁暴(Kp=3)恢复相期间FAST卫星观测到的离子上行事件
Figure 3. The upflow event in the recovery phase of the storm on February 23, 1998
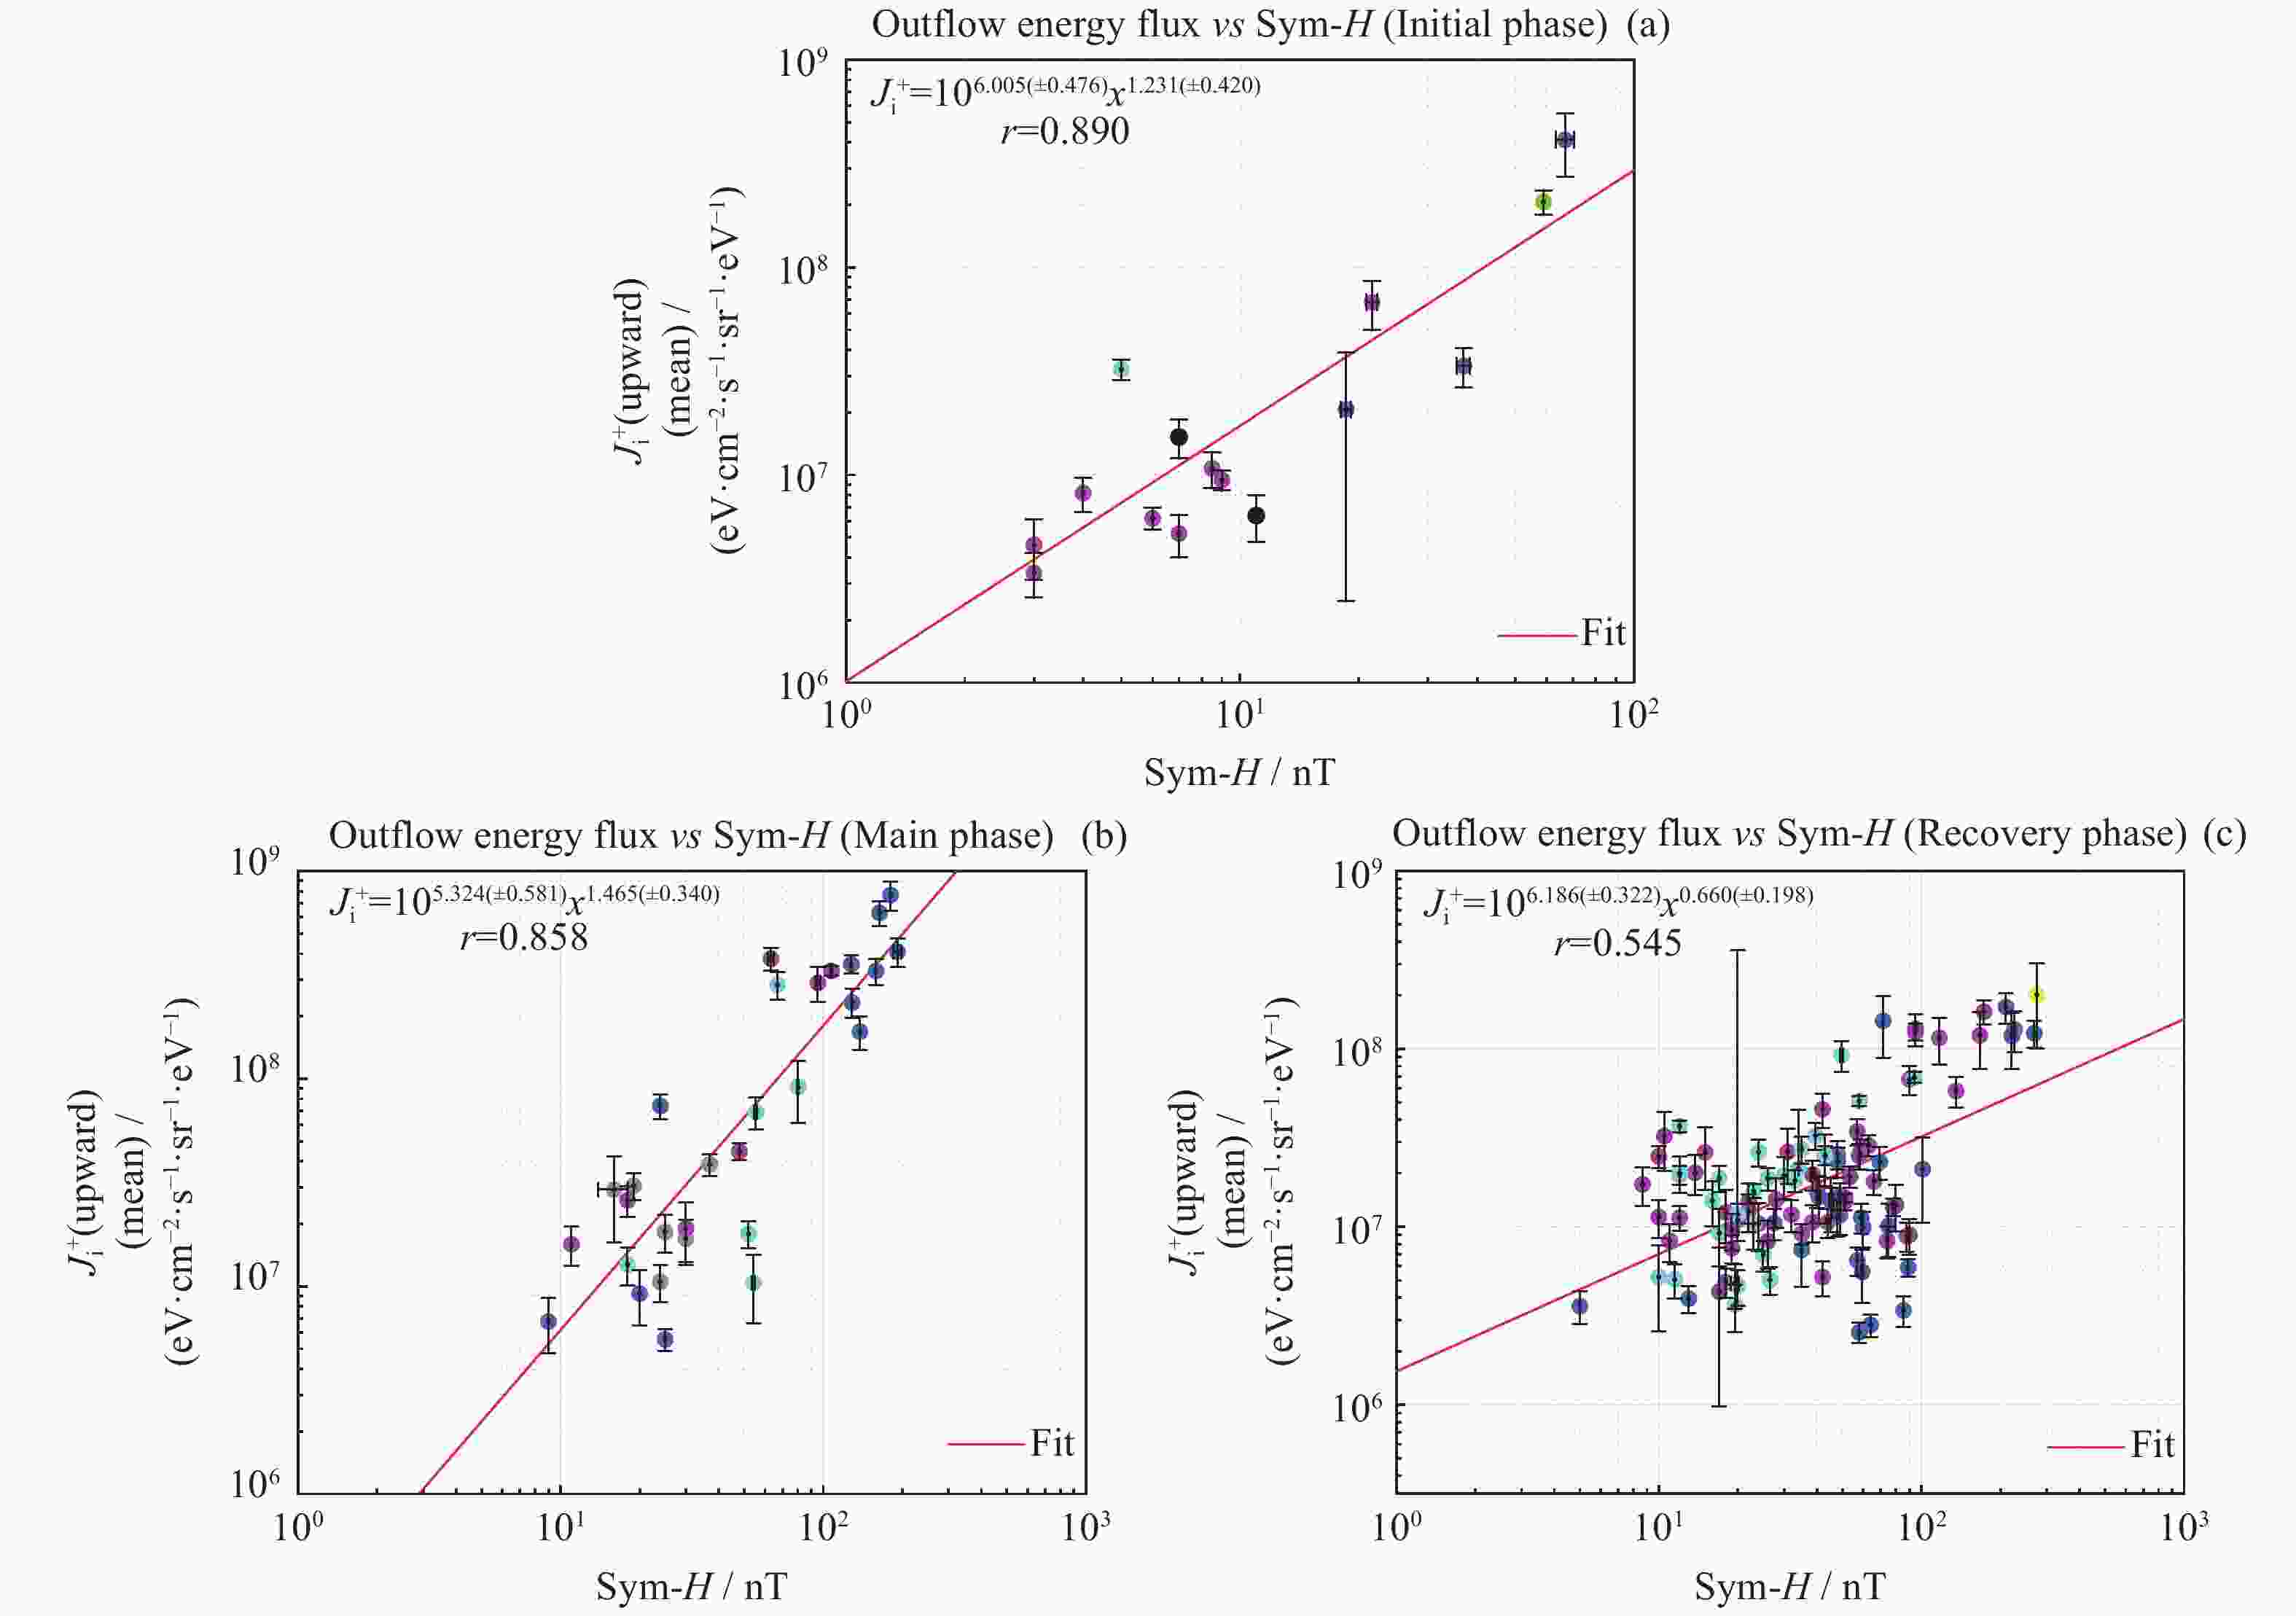
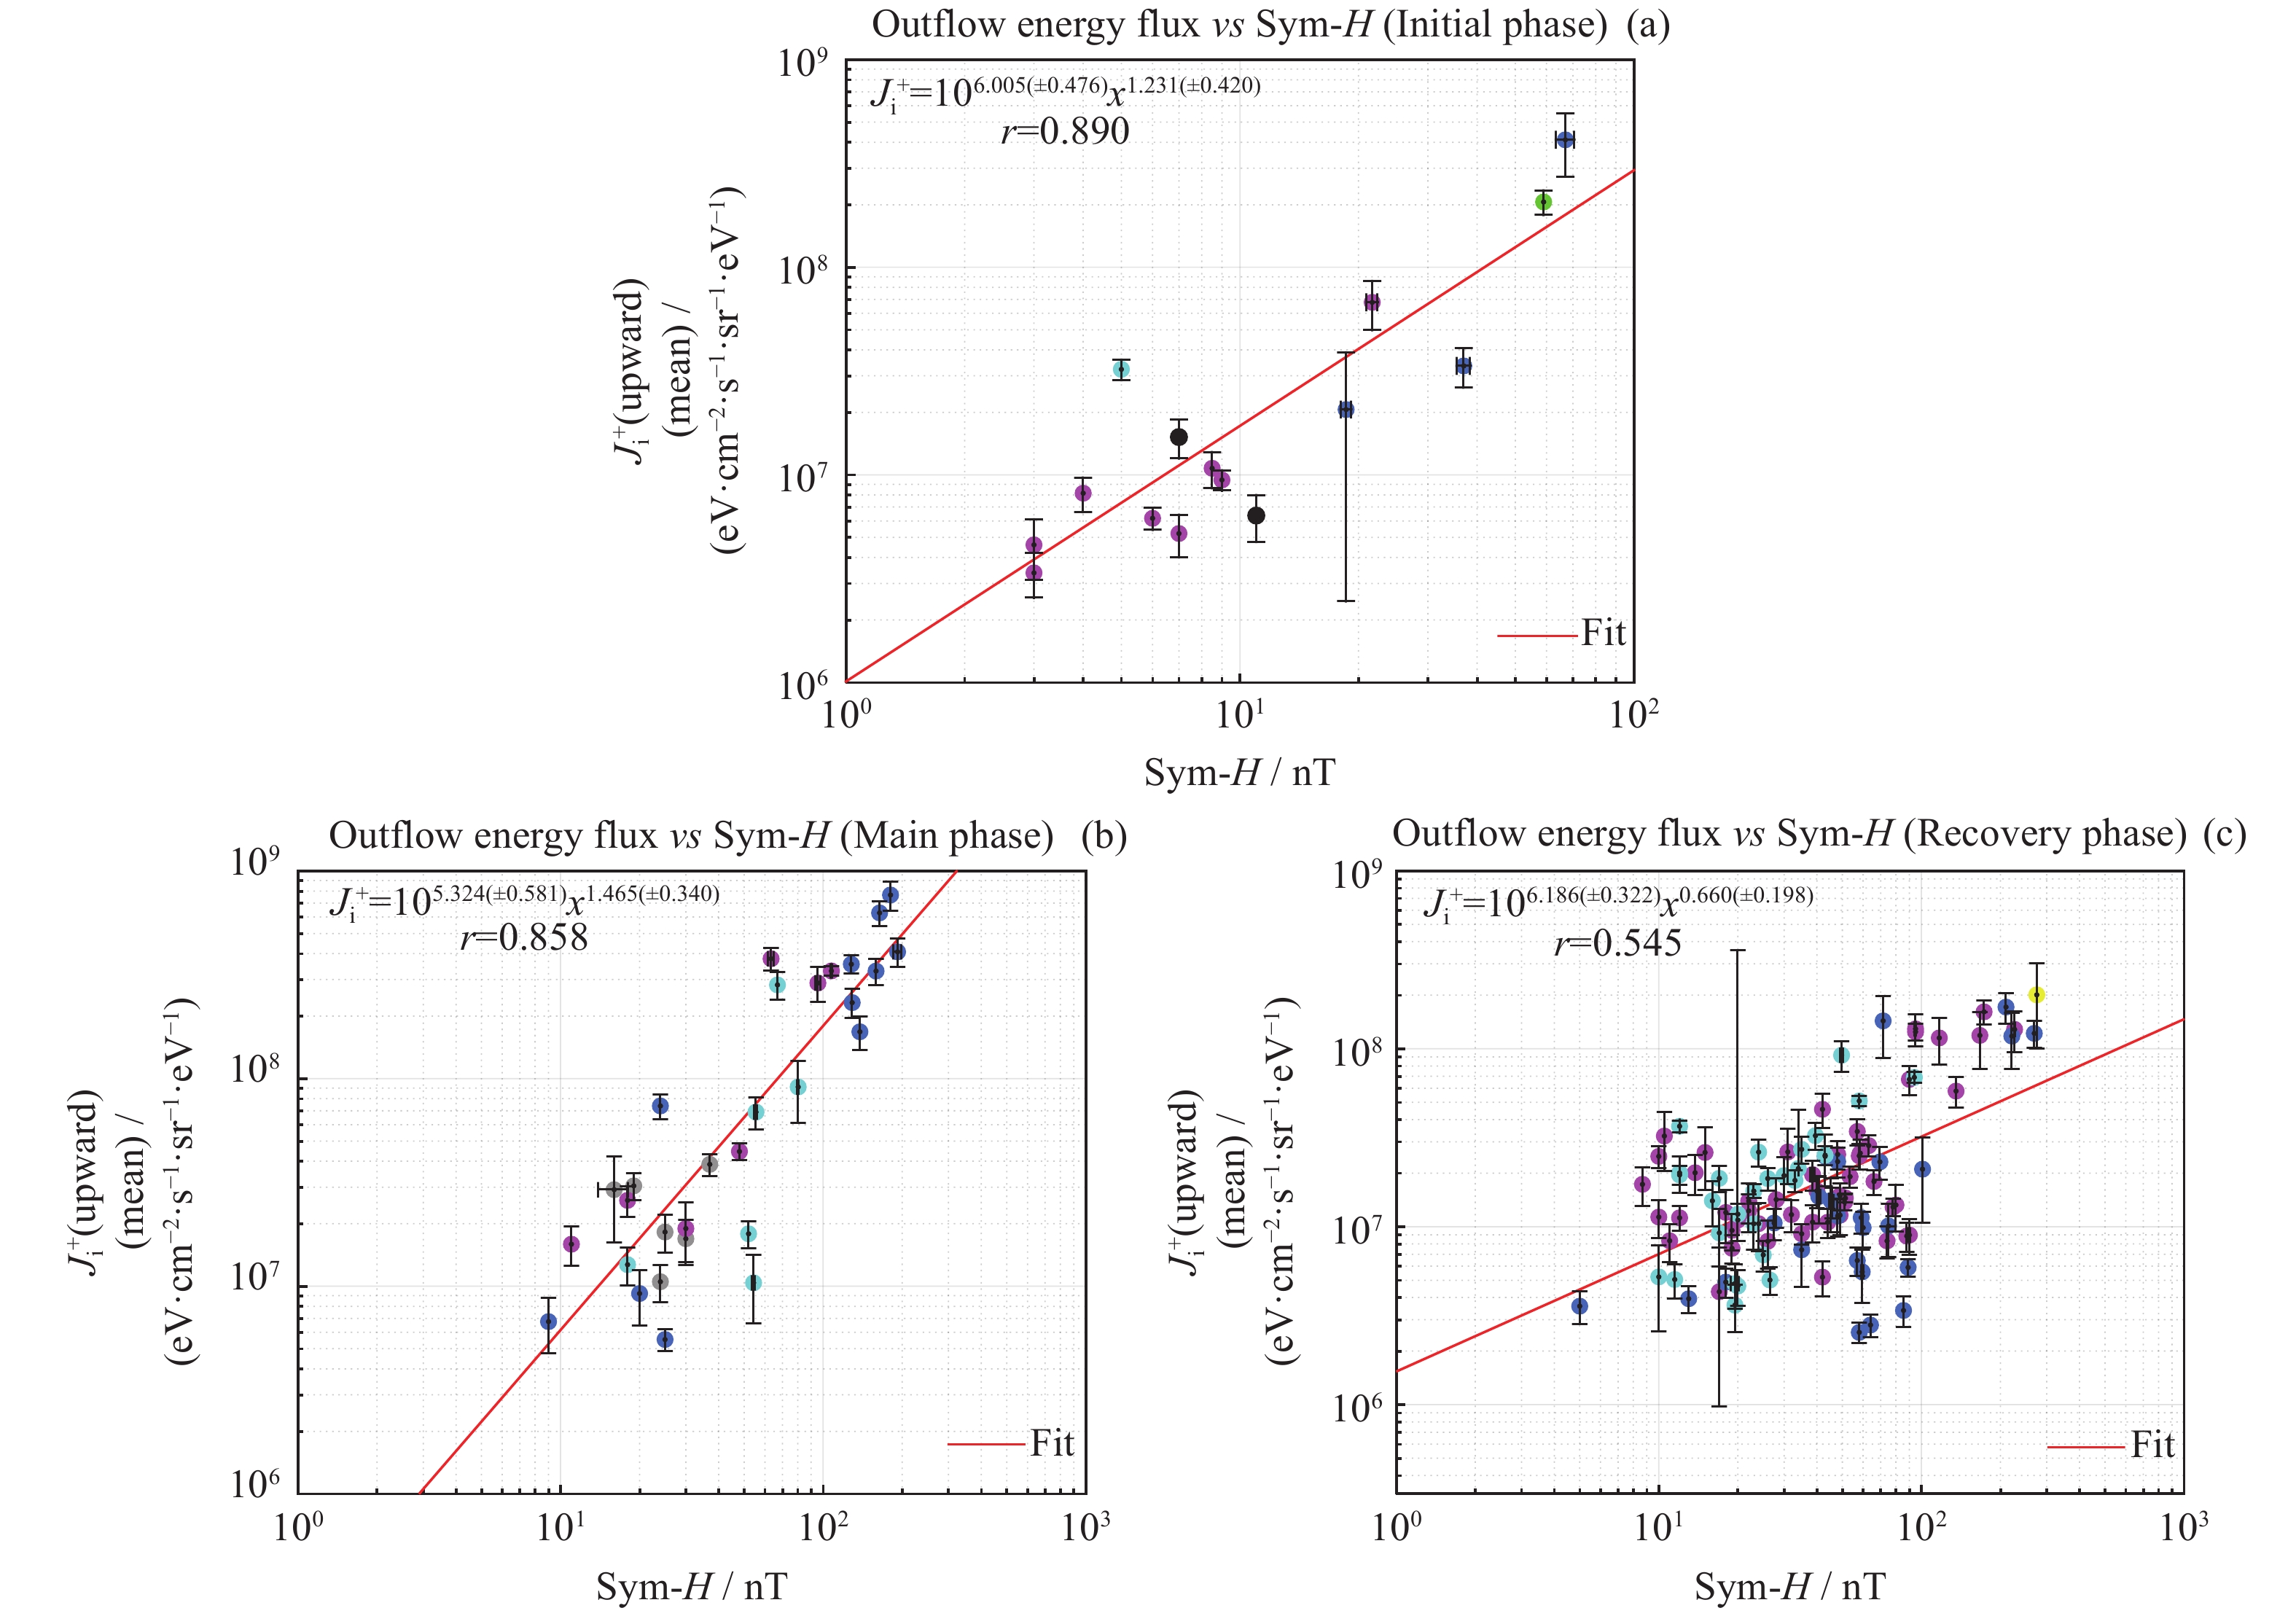
图 4 磁暴上行离子能通量均值与地磁活动指数Sym-H的散点图及拟合曲线。图中点表示每次事件的离子上行能通量和Sym-H指数在上行期间的均值,其标准差使用误差棒表示。灰色点表示1997年事件,粉色点表示1998年事件,黄色点表示2001年事件,蓝色点表示2004年事件,绿色点表示2005年事件,青色点表示2006年事件
Figure 4. Scatter plots and fitting curves of the mean of upflow ions energy flux and geomagnetic activity index Sym-H. Each scatter represents the mean values of the upflow energy flux and the Sym-H index, while the error bar means the one sigma variation of the two quantities. The gray scatters represent the events of 1997, the pink scatters indicate the events of 1998, the yellow scatters indicate the events of 2001, the blue scatters indicate the events of 2004, the green scatters indicate the events of 2005, and the cyan scatters mean the events of 2006
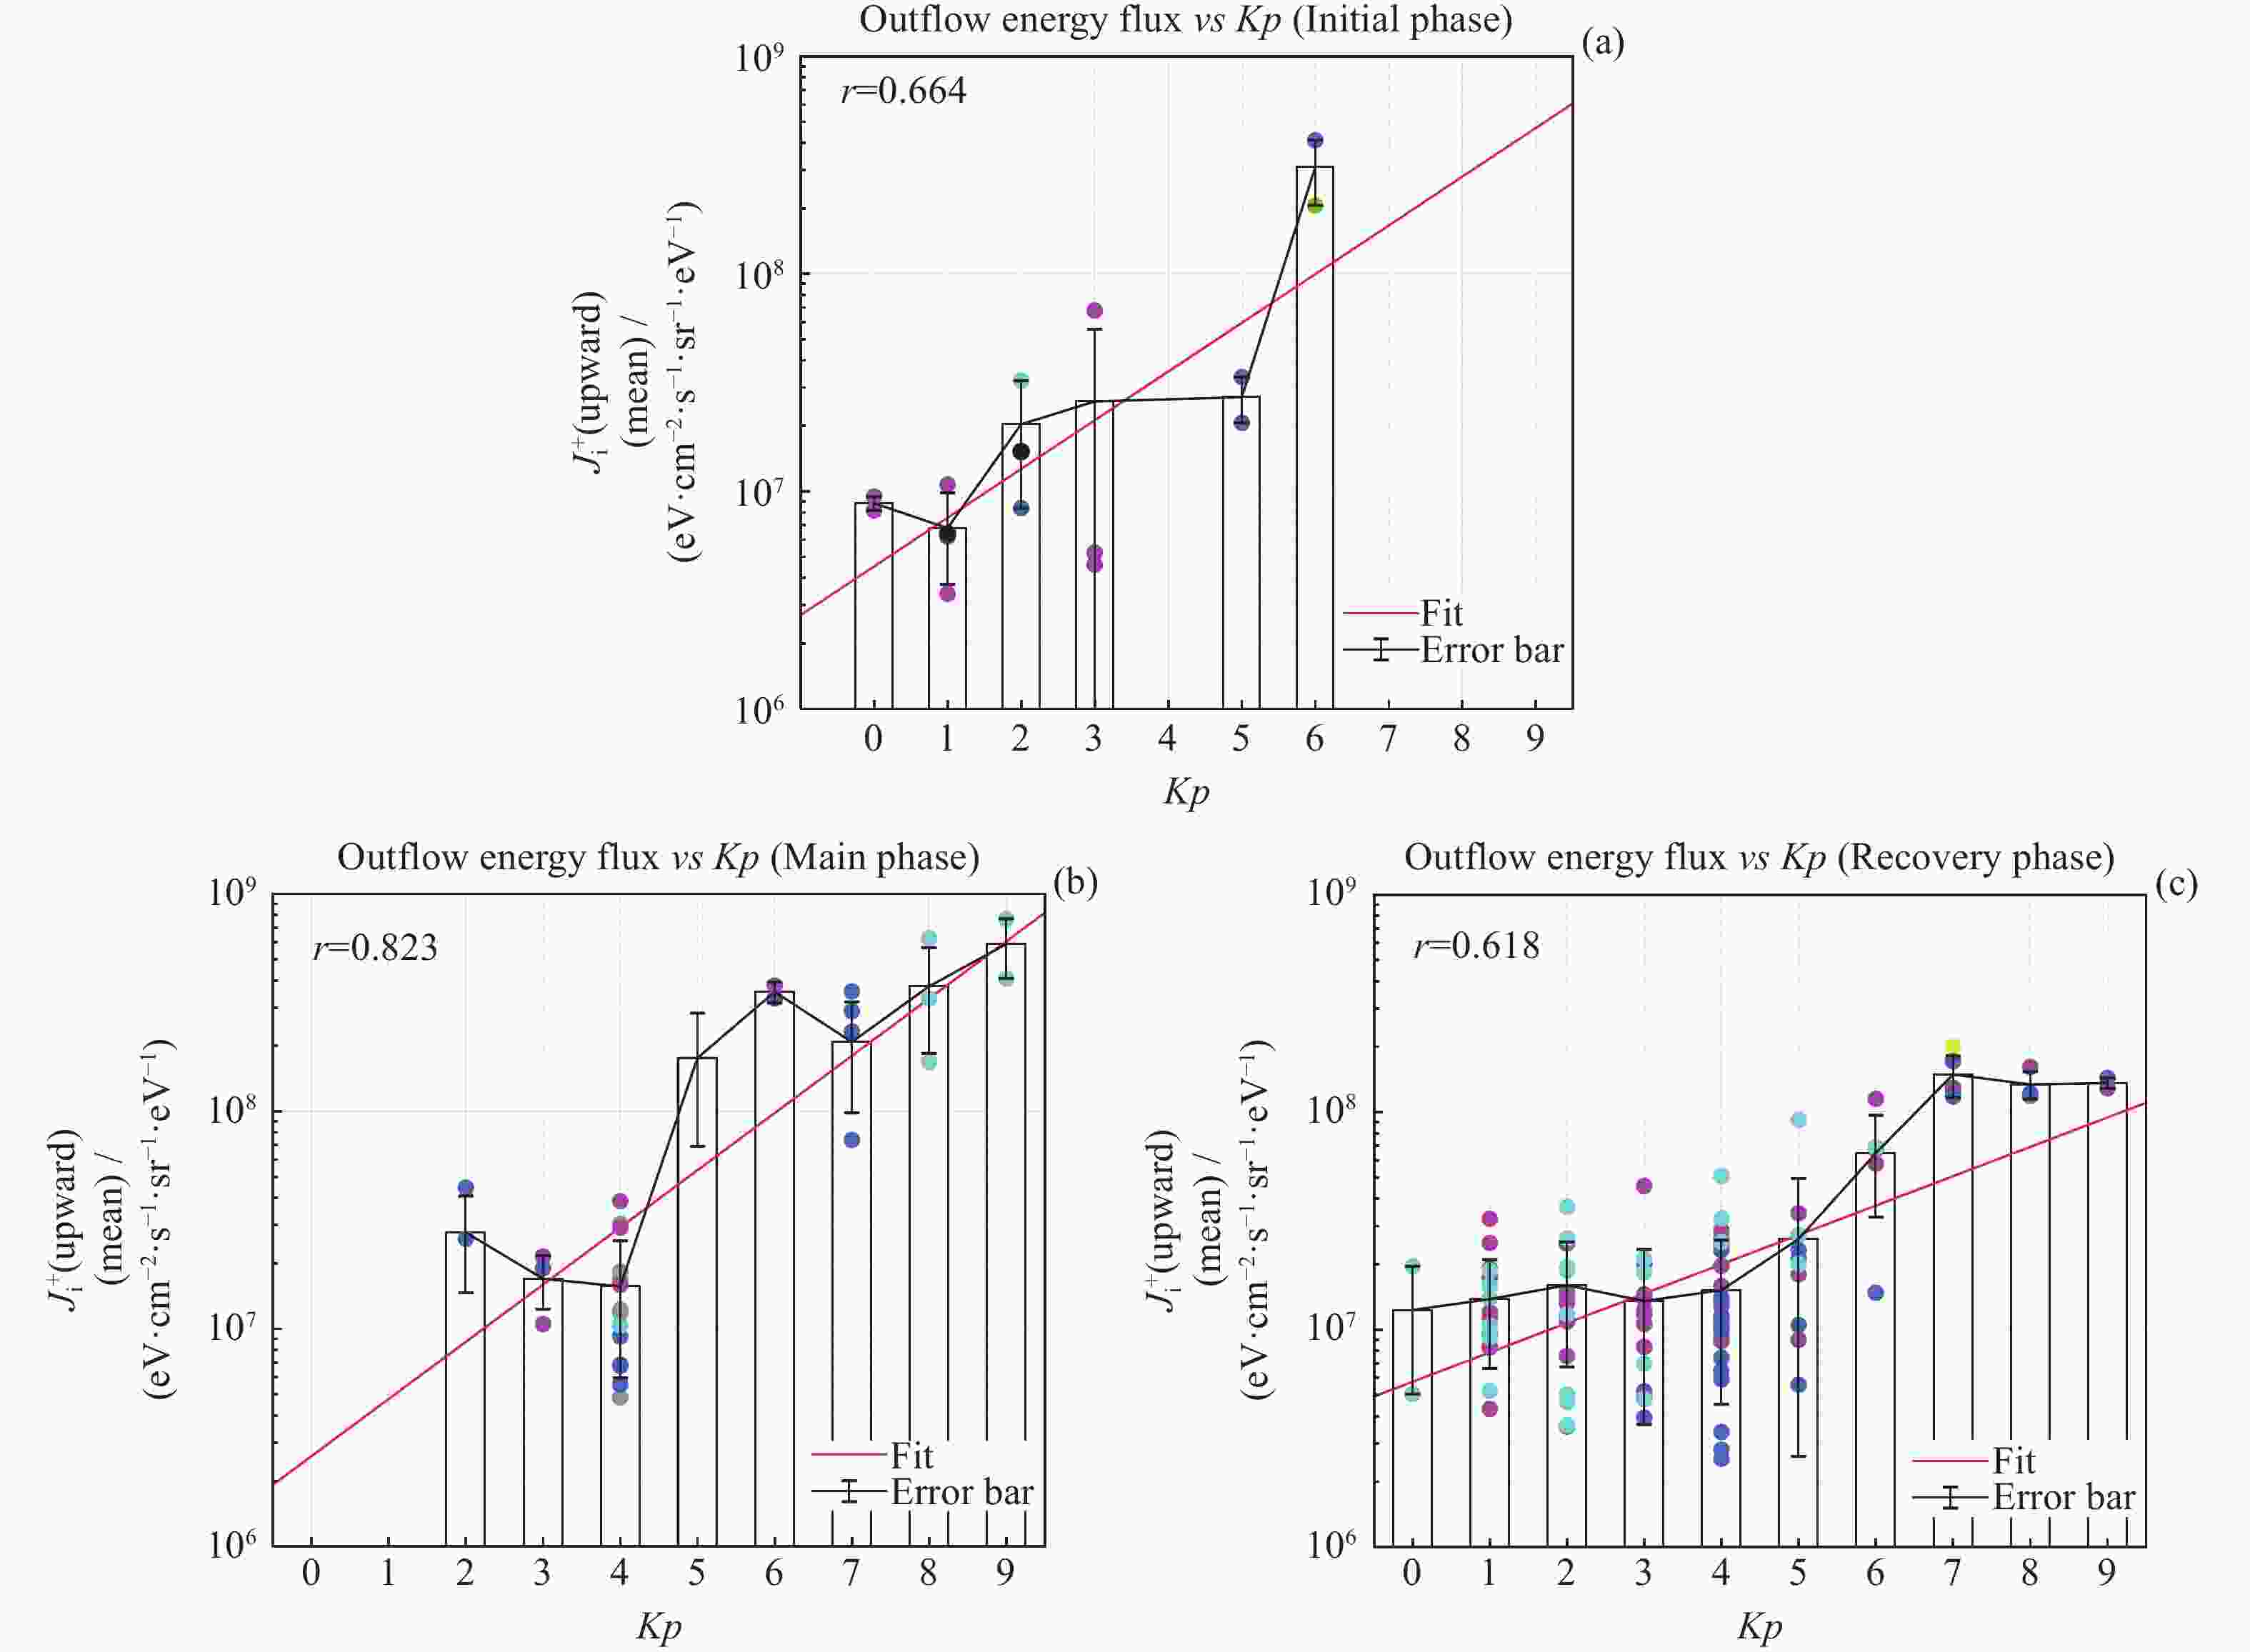
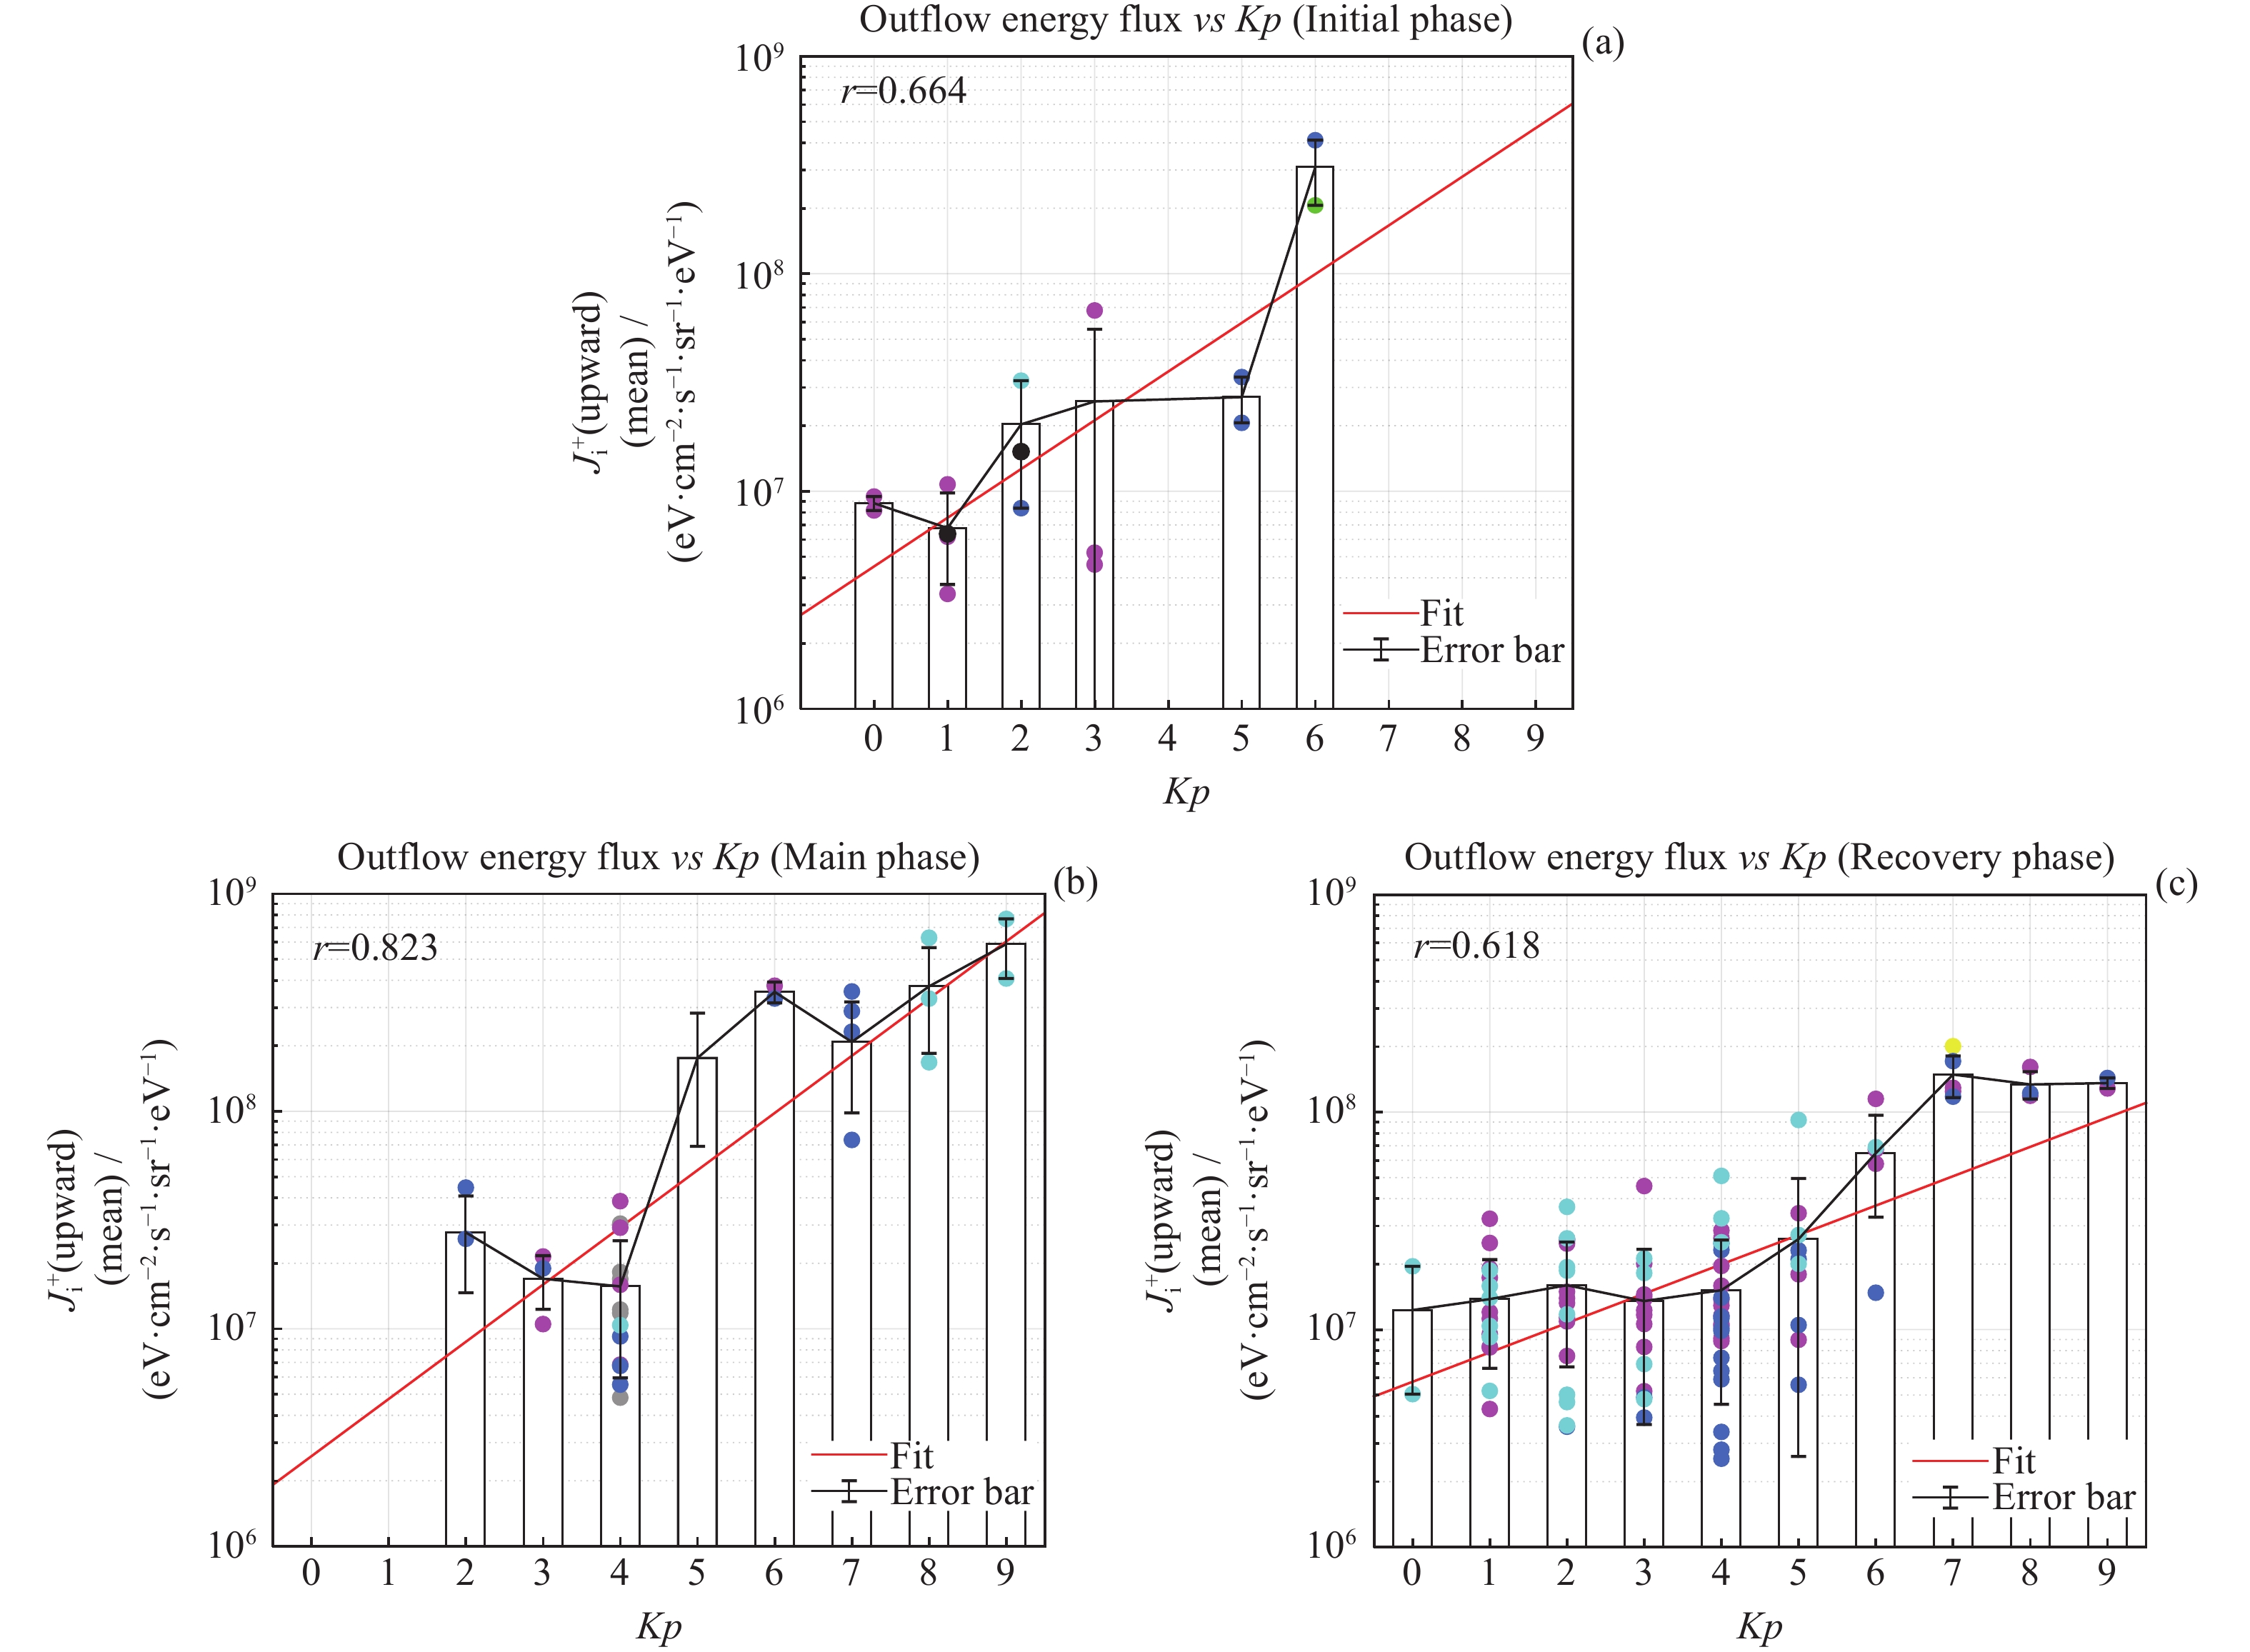
图 5 磁暴上行离子能通量均值与地磁活动指数Kp的关系。灰色点表示1997年事件,粉色点表示1998年事件,黄色点表示2001年事件,蓝色点表示2004年事件,绿色点表示2005年事件,青色点表示2006年事件
Figure 5. Relationship diagram between the mean value of upflow ions energy flux and geomagnetic activity index Kp. The gray scatters represent the events of 1997, the pink scatters indicate the events of 1998, the yellow scatters indicate the events of 2001, the blue scatters indicate the events of 2004, the green scatters indicate the events of 2005, and the cyan scatters mean the events of 2006
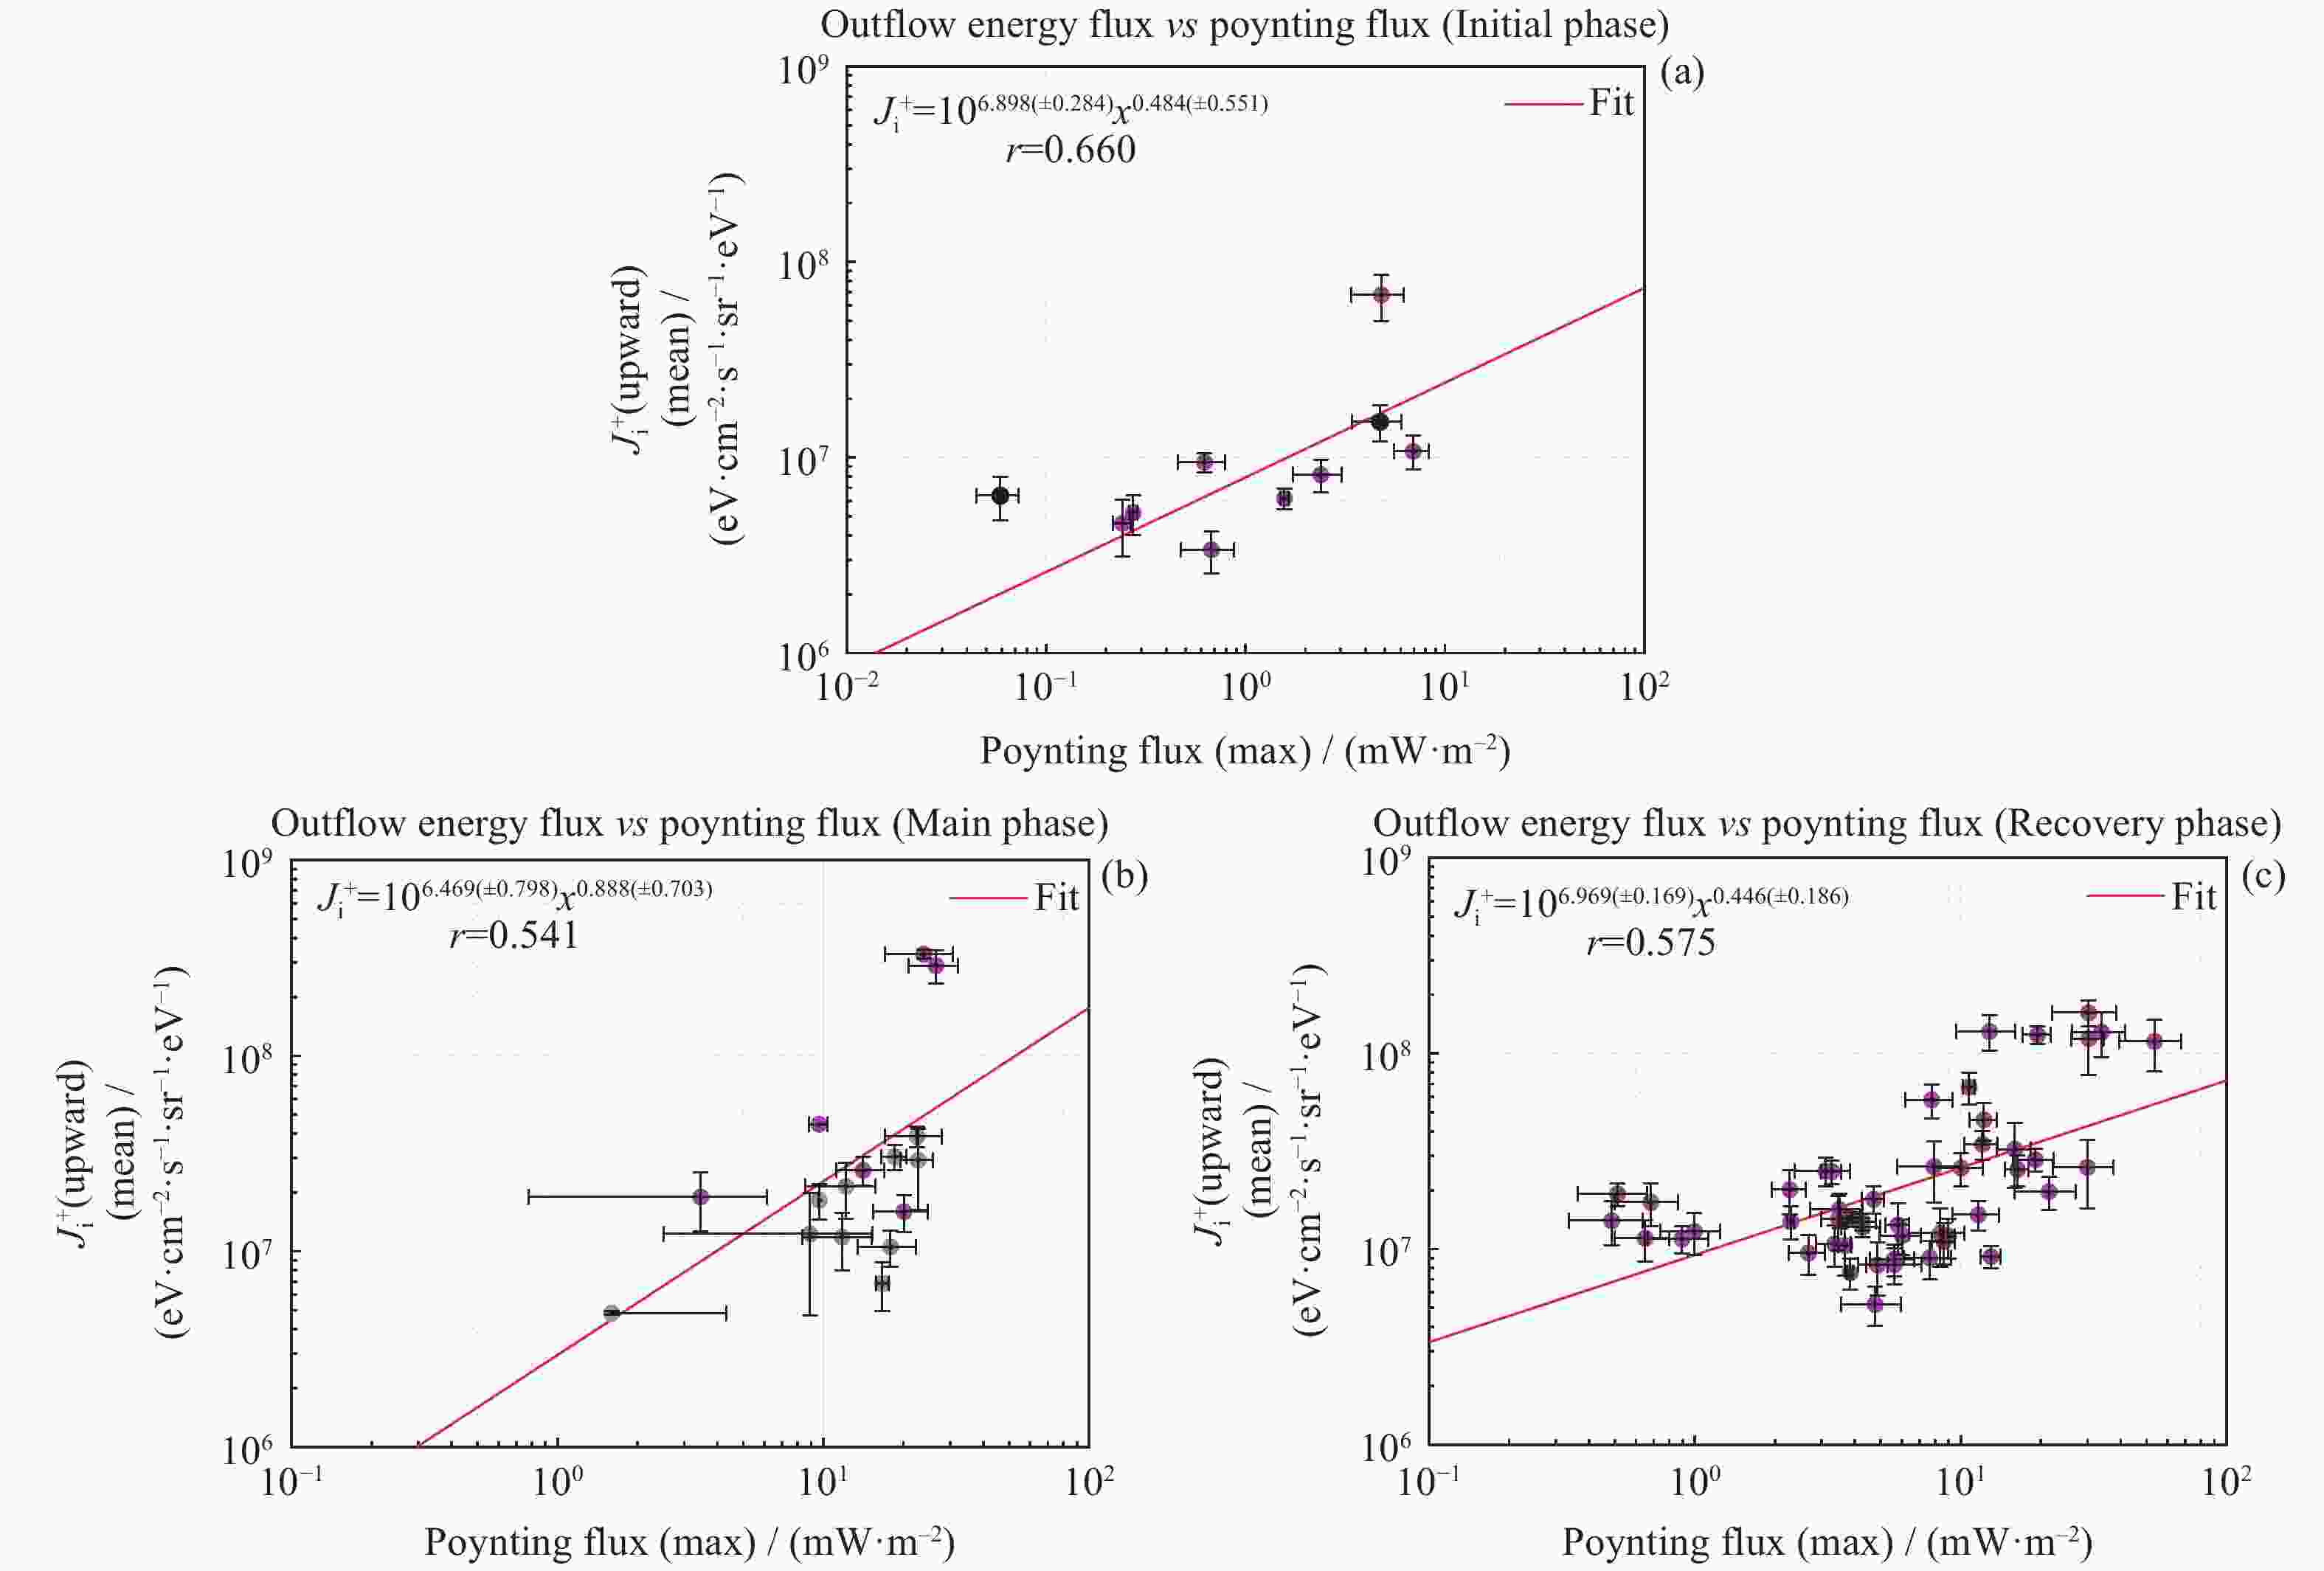
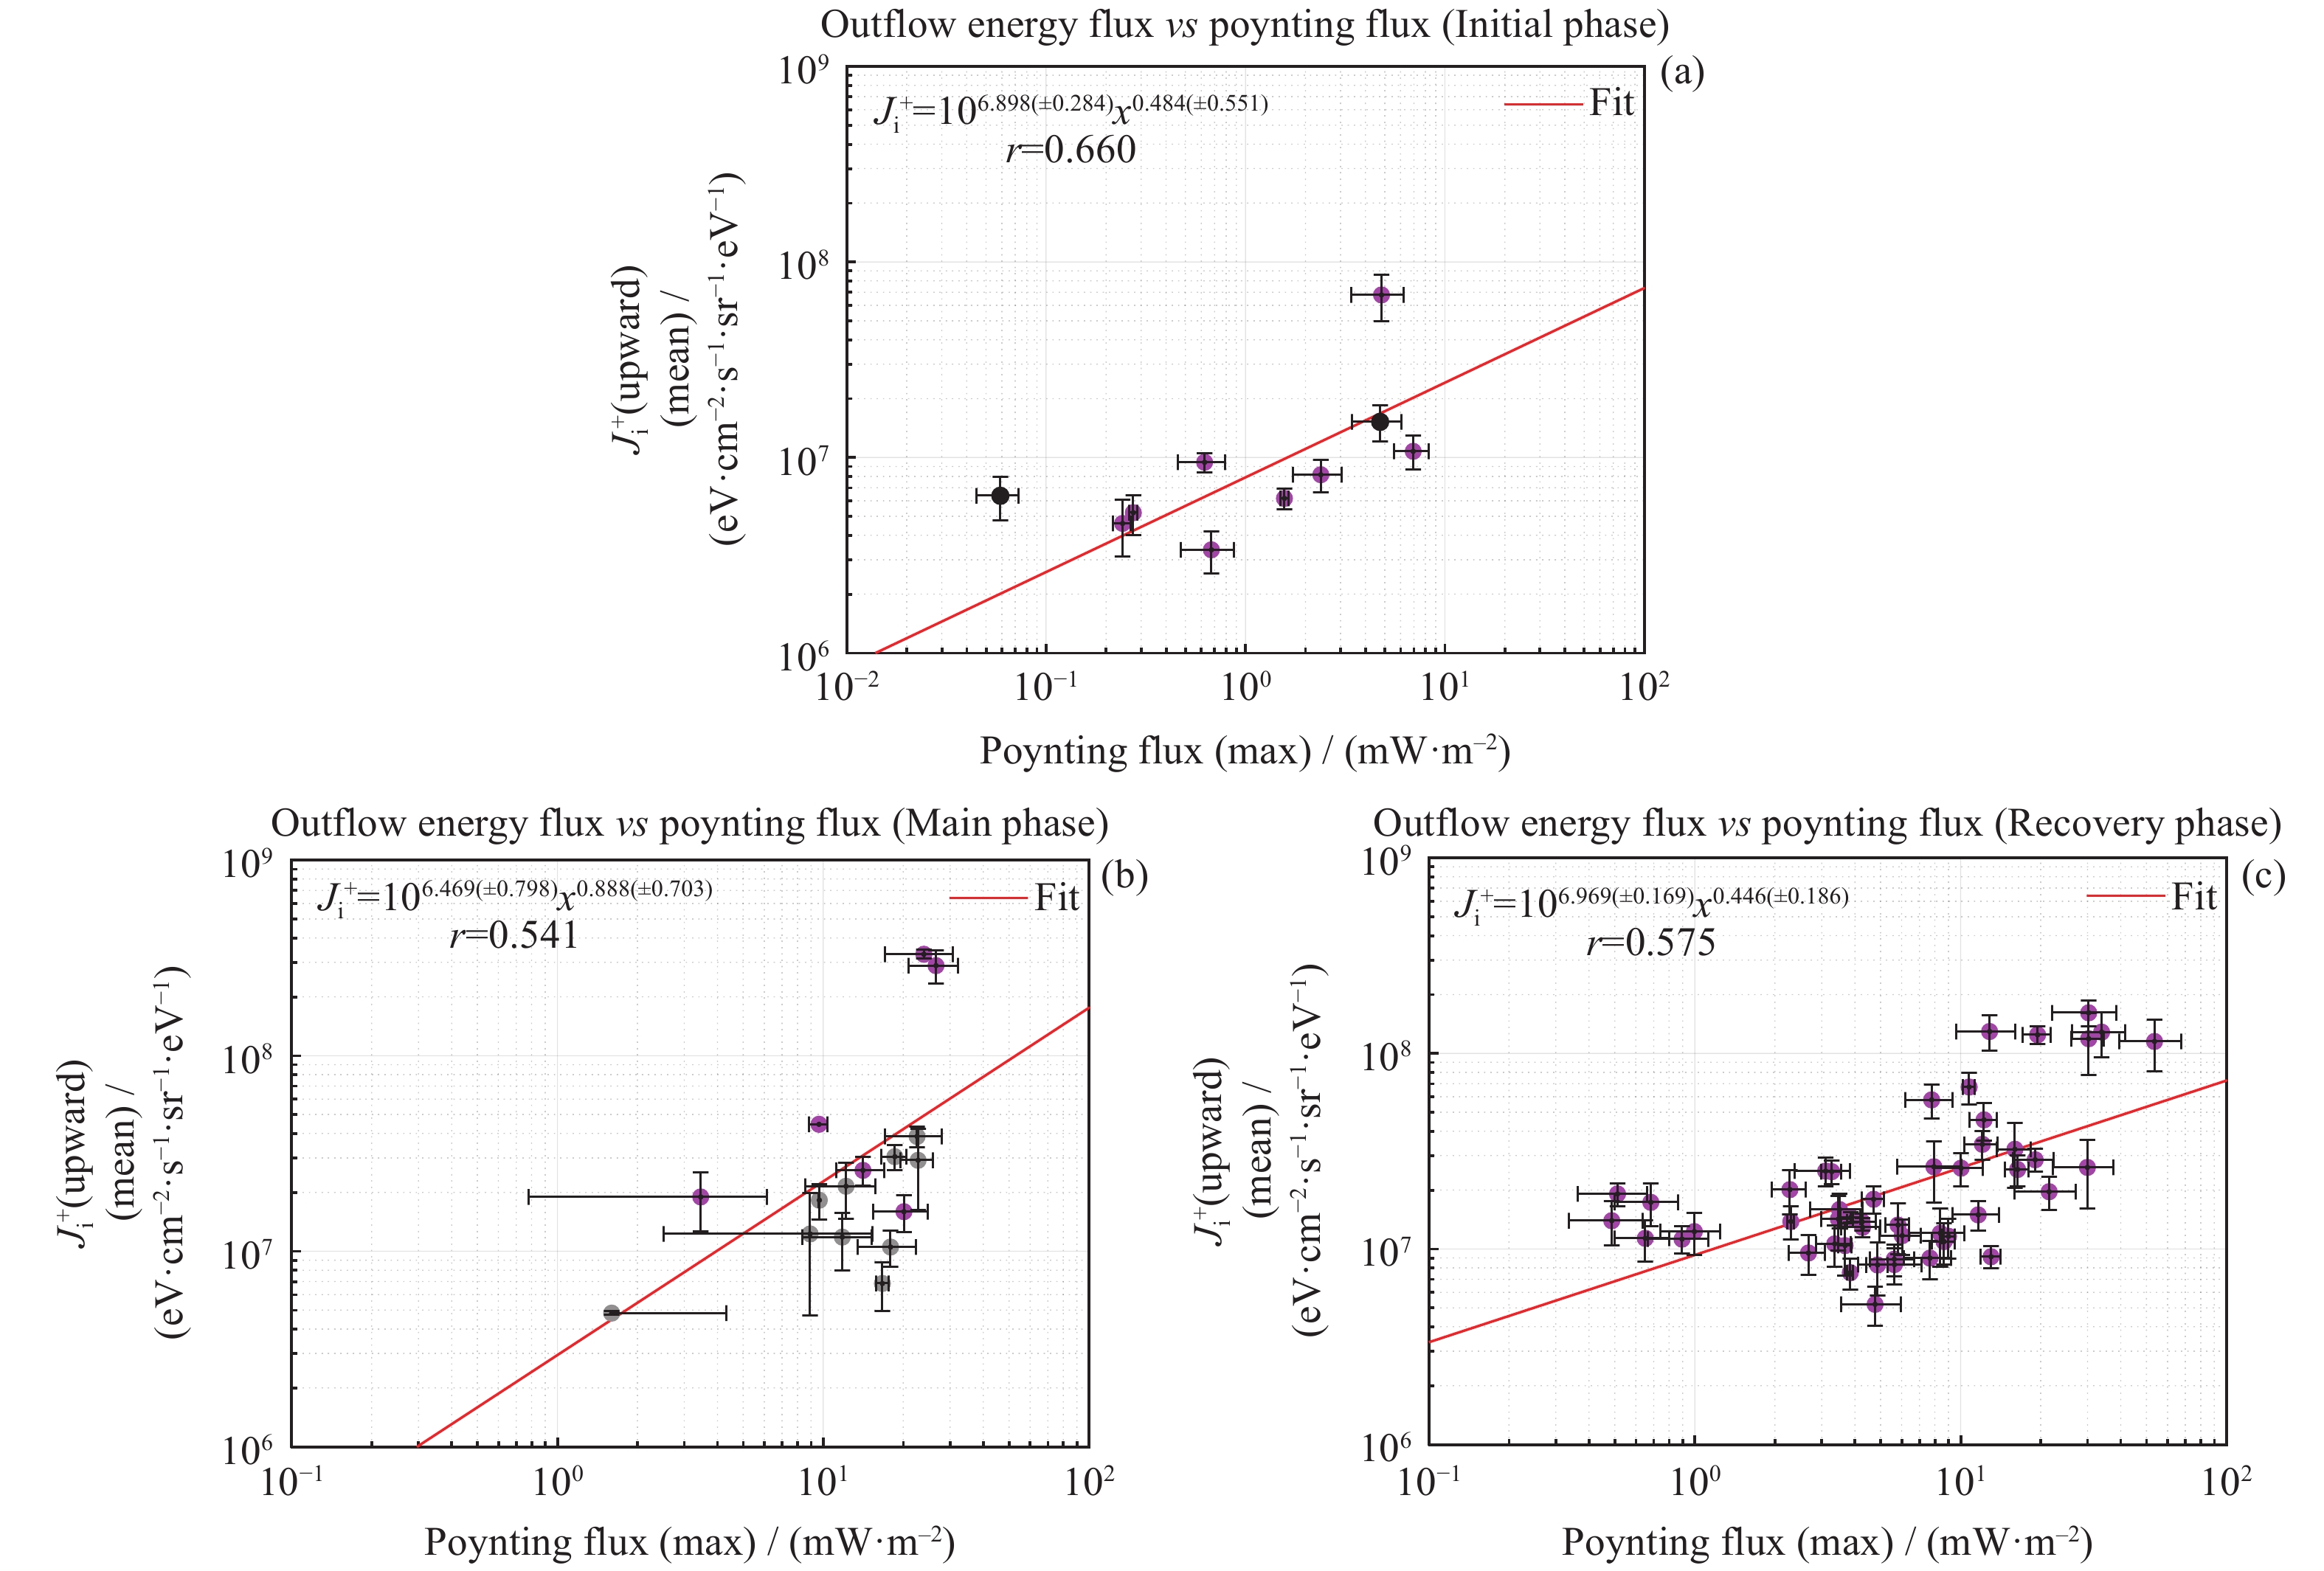
图 6 磁暴上行离子能通量均值与Poynting通量的散点。图中点表示每次事件的离子上行能通量和Poynting通量在上行期间的均值,其标准差使用误差棒表示。灰色点表示1997年事件,粉色点表示1998年事件
Figure 6. Scatter plot of the mean of upflow energy flux and Poynting flux. Scatters mean the averaged values of the upflow energy flux and the Poynting flux during the upflowing time intervals, while error bars represent the one sigma variation of the two quantities. The gray scatters represent the events of 1997, and the pink scatters indicate the events of 1998
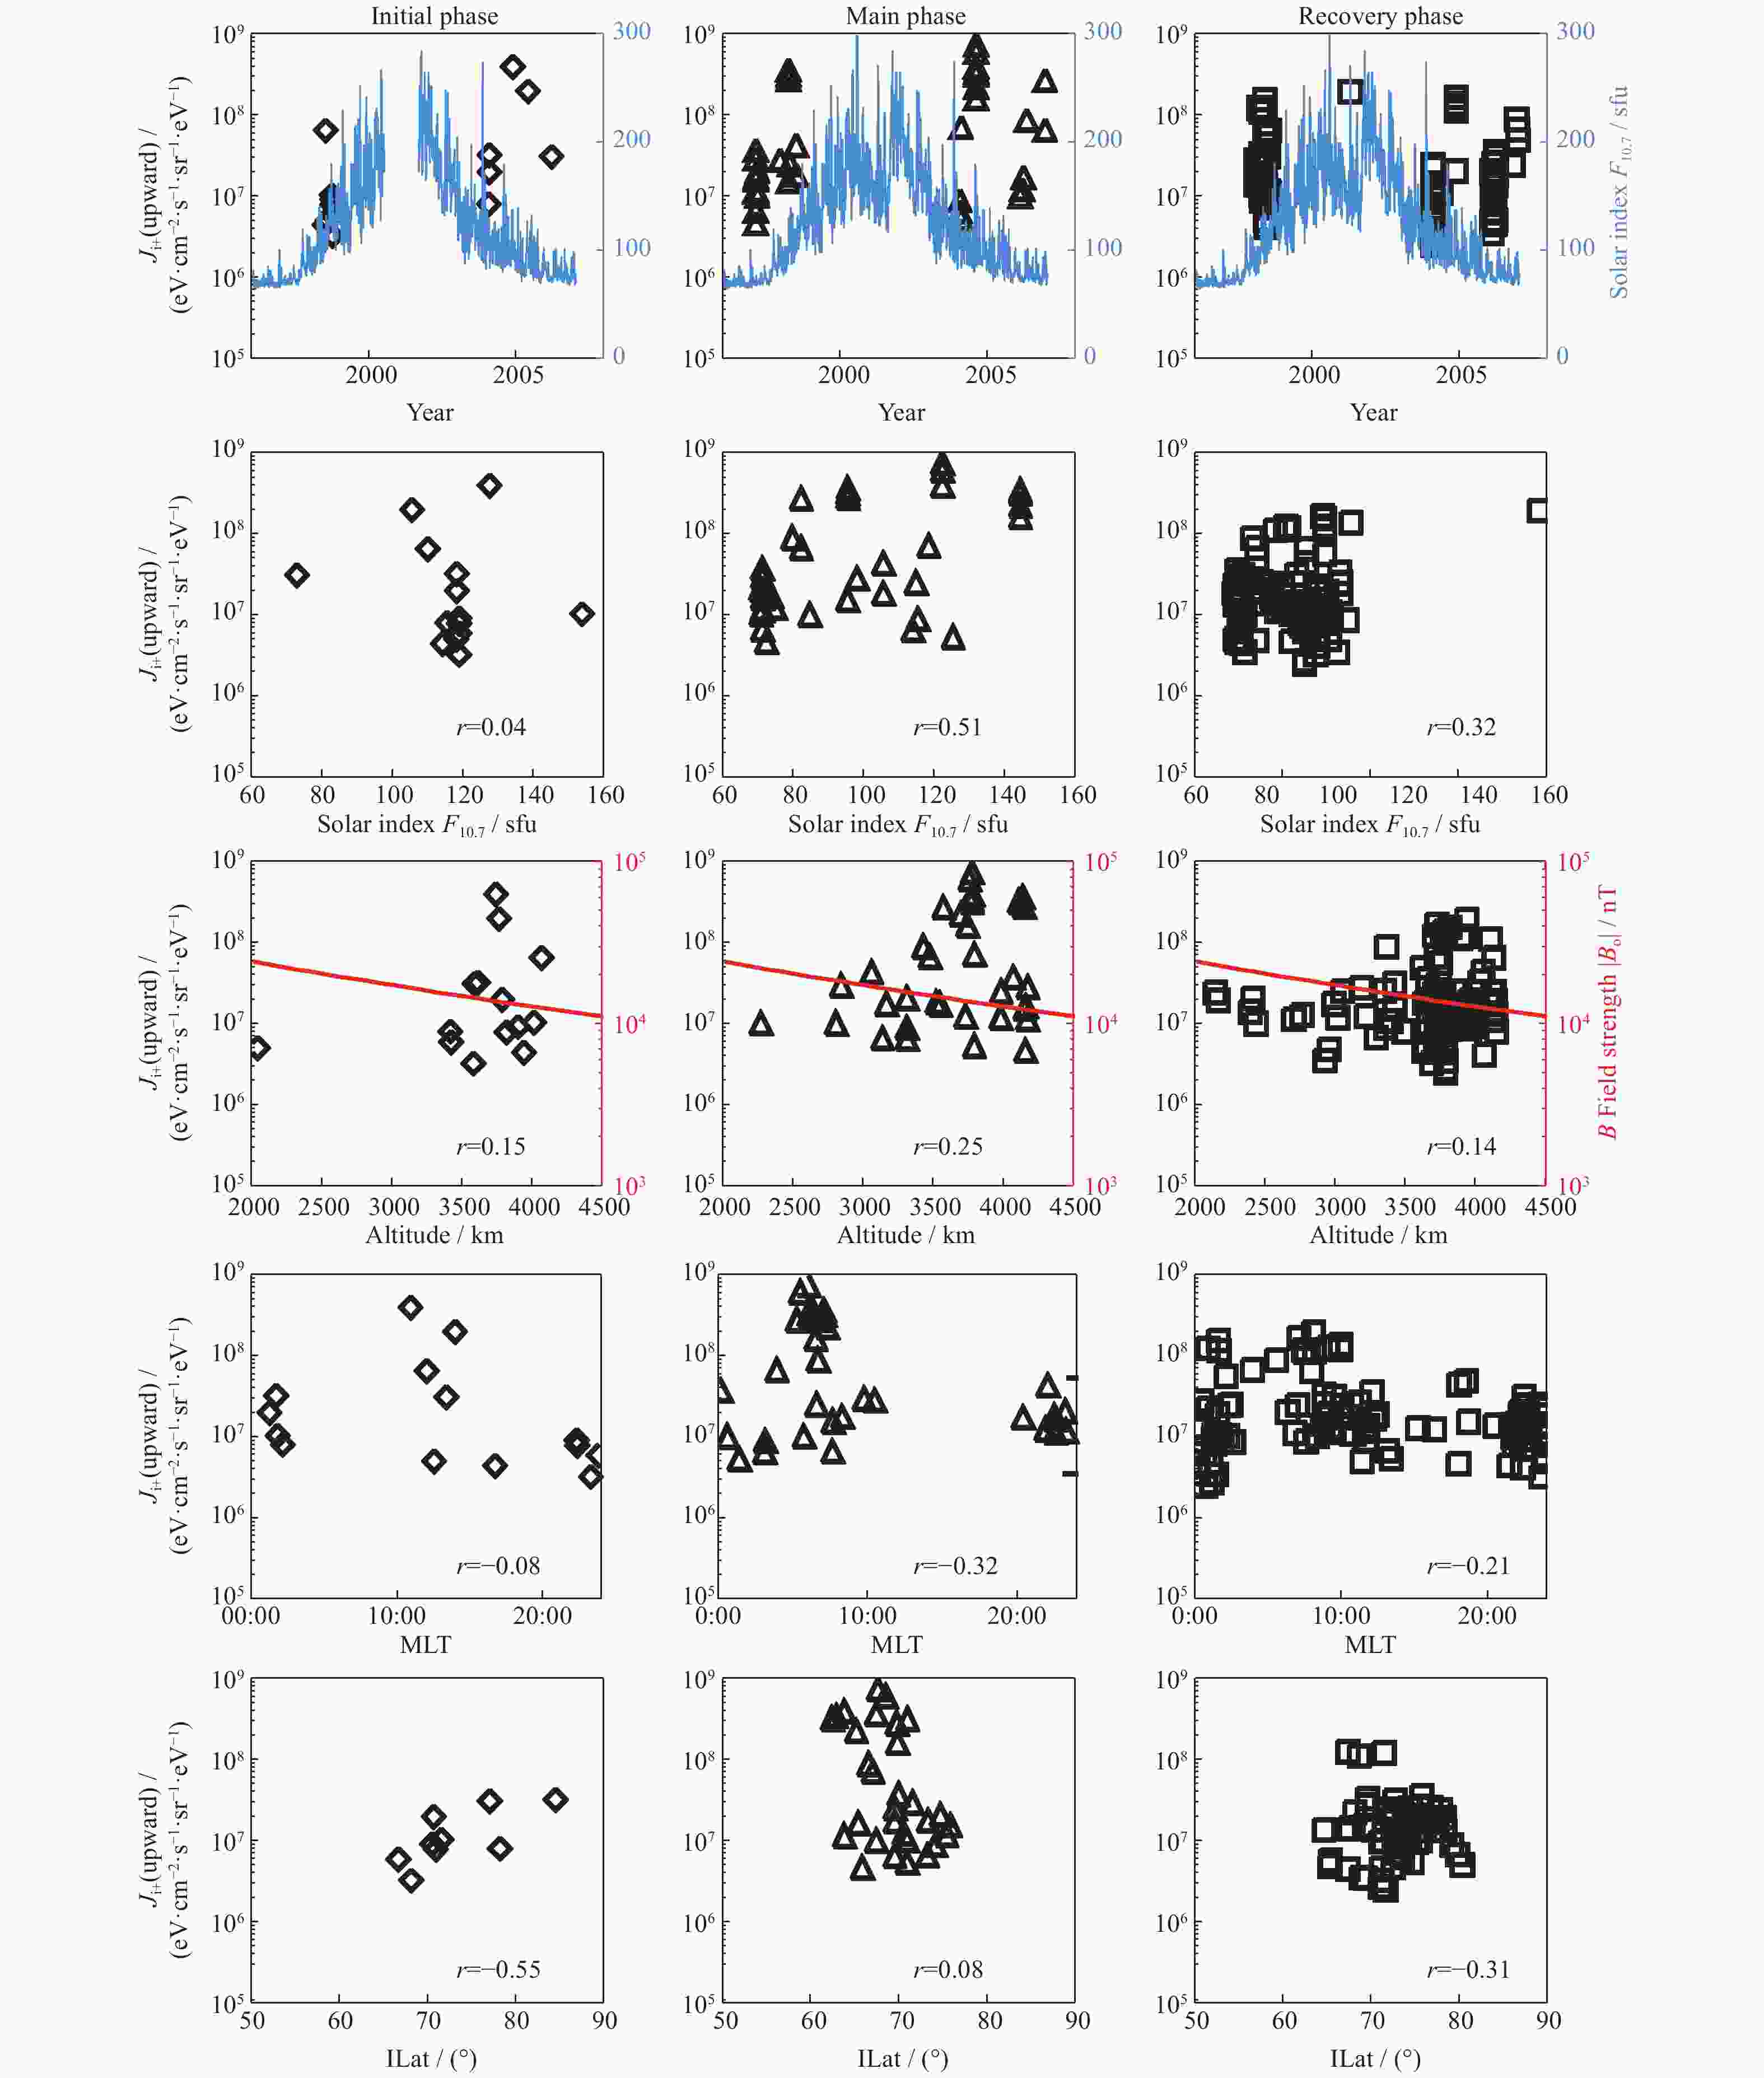
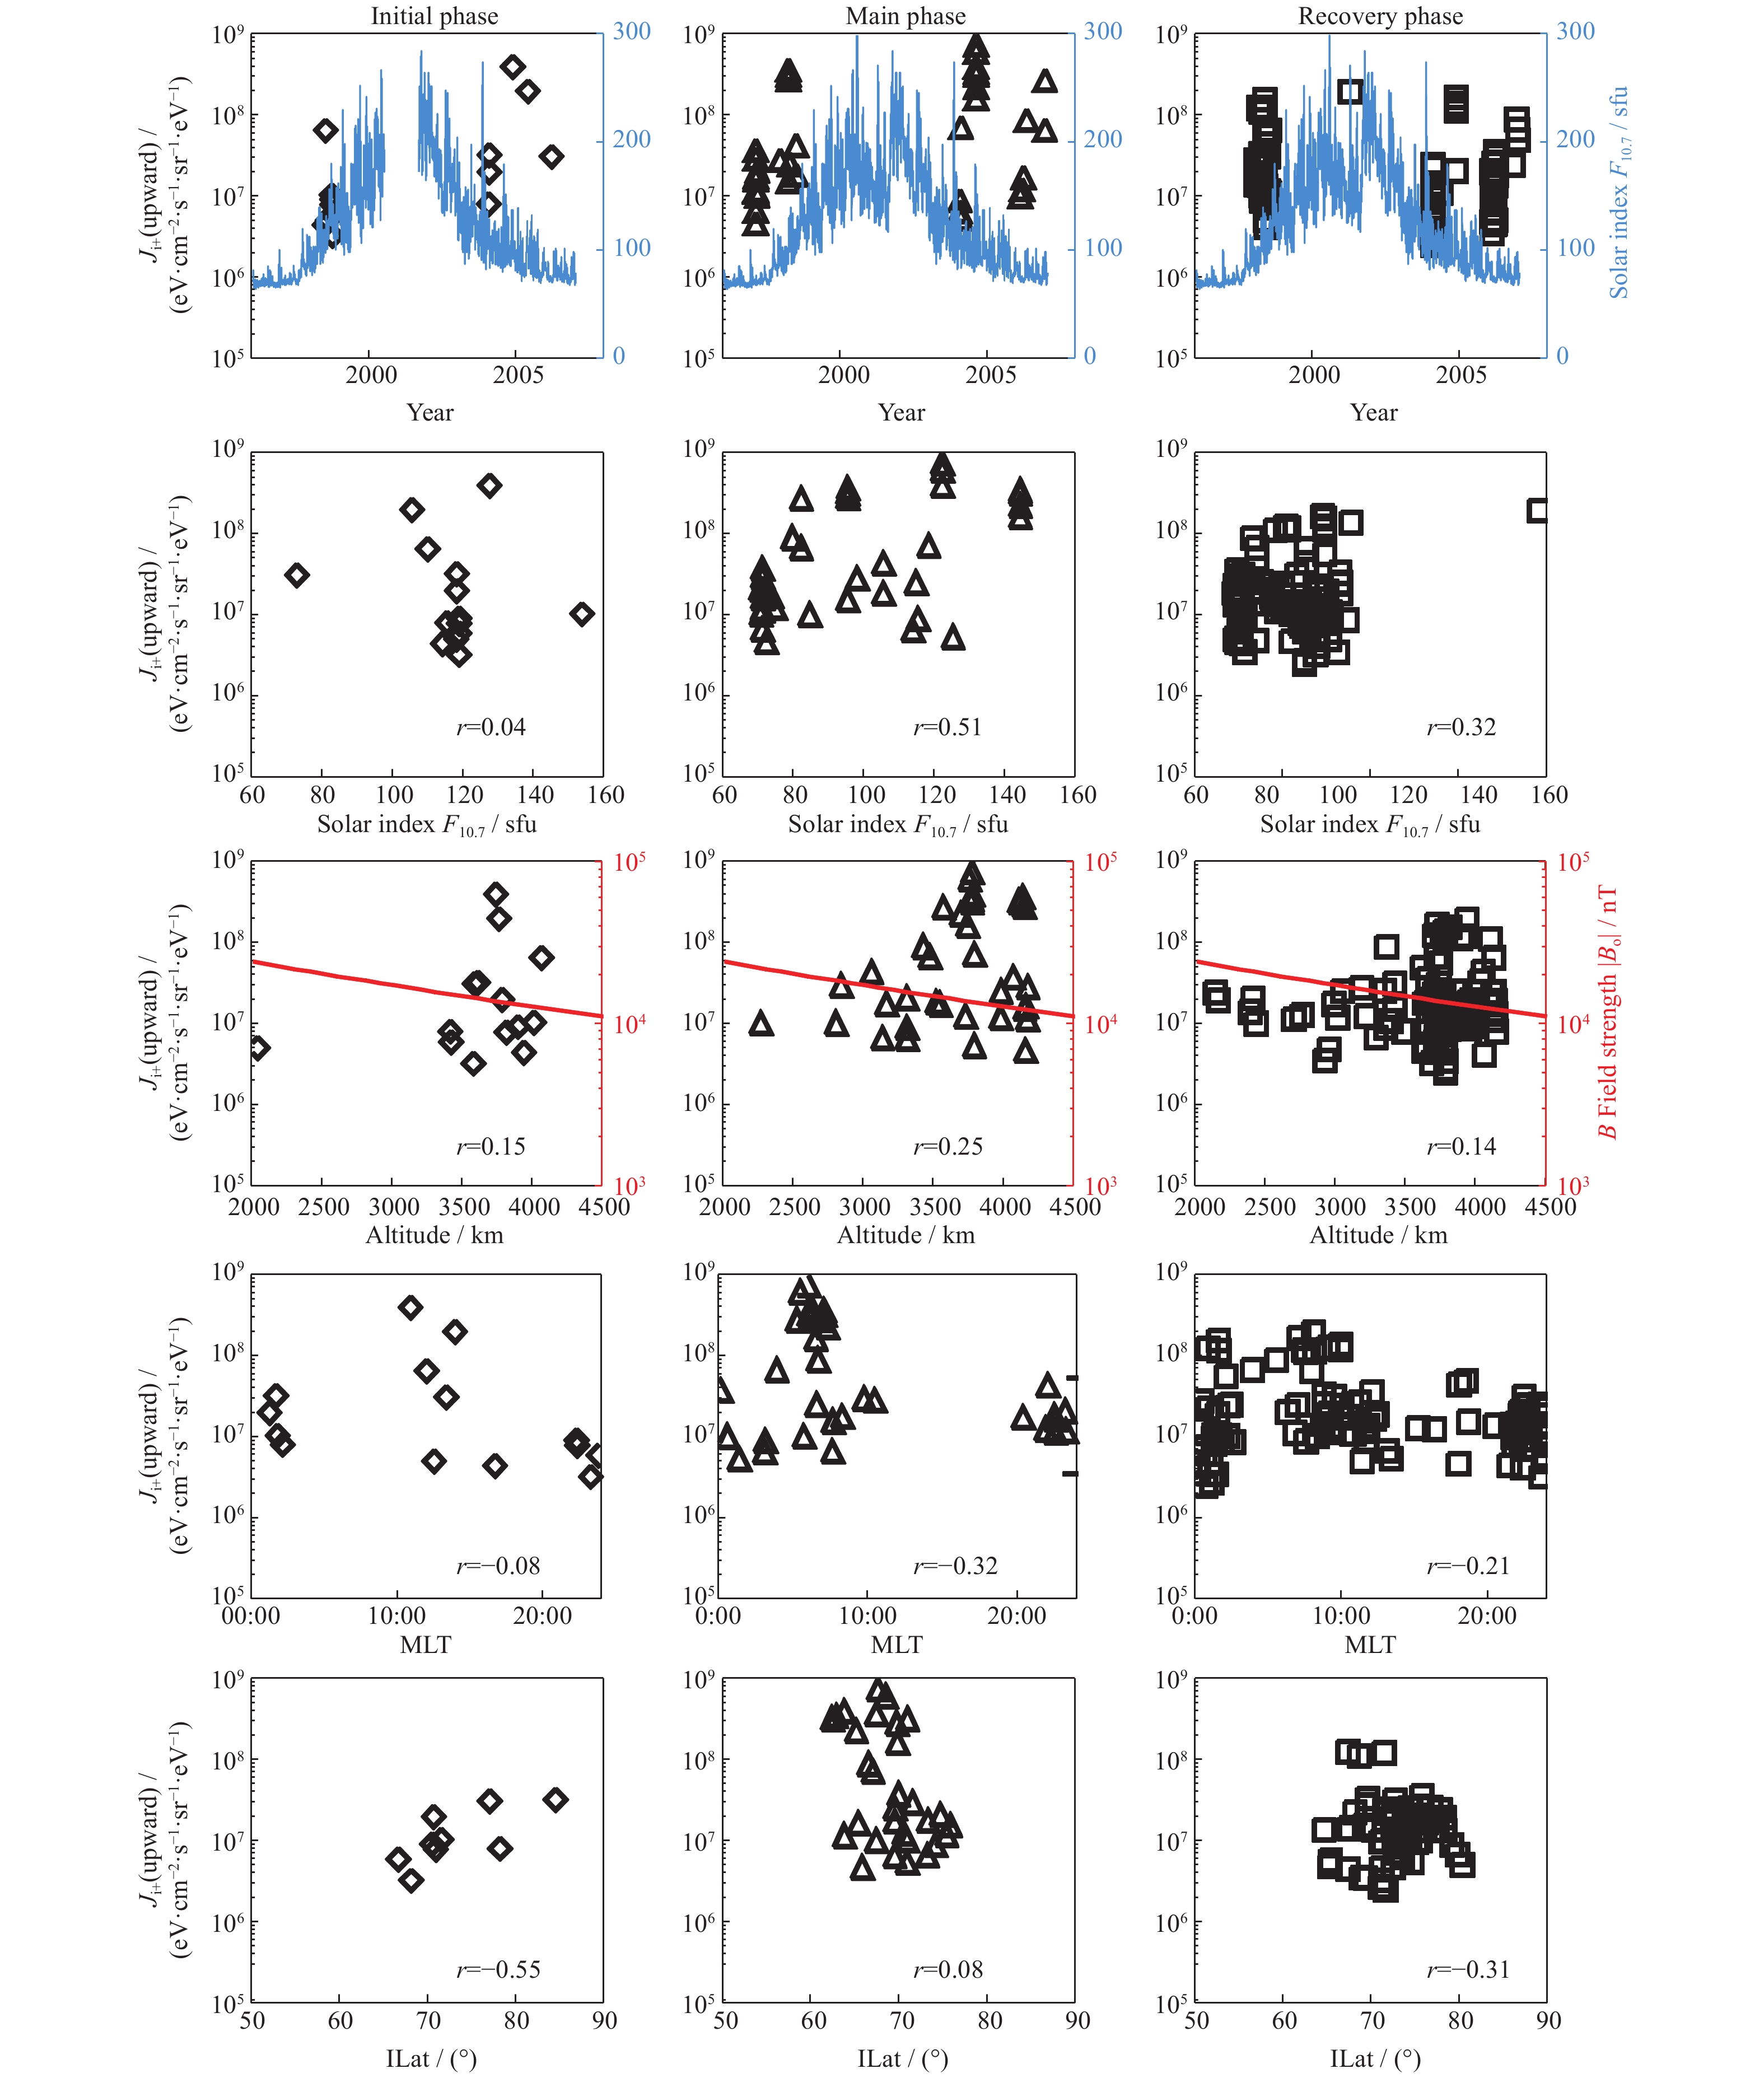
图 7 离子上行能通量在磁暴初相、主相和恢复相与其他参数的散点结果。r表示离子上行能通量与各参数的相关系数
Figure 7. Scatter plots of the averaged upflow energy flux versus the parameters on initial phases, main phases, and recovery phases. In each plot, r represents the correlation coefficient between the upflow energy flux and the parameters
表 1 按磁暴相位分相后的离子上行事件数
Table 1. Number of upflow events as functions of storm phases
Initial phase Main phase Recovery phase Year Number
of events0 6 0 1997 8 7 52 1998 0 0 1 2001 4 11 25 2004 1 0 0 2005 1 6 27 2006 Total 14 30 105 149  下载: 导出CSV
表 2 经验公式参数估计值及相关系数
Table 2. Empirical formula parameter estimates and correlation coefficients
Magnetic storm phase a b r Initial Phases 1.231(±0.420) 6.005(±0.476) 0.890 Main Phase 1.465(±0.340) 5.324(±0.581) 0.858 Recovery Phase 0.660(±0.199) 6.186(±0.322) 0.545 注 括号内为95%置信区间。
下载: 导出CSV
表 3 各相位Sym-H和上行能通量均值(
$ {\boldsymbol{\alpha}} {\bf{= 0.05}} $ )Table 3. Mean value of Sym-H and upflow ions energy flux of each phase (
$ {\boldsymbol{\alpha}} {\bf{=0.05}} $ )Mean absolute value
of Sym-H / nTMean of energy flux /
(eV·cm–2·s–1·sr–1·eV–1)Initial Phases 17.769(±10.872) 5.909×10⁷(±5.773×10⁷) Main Phase 67.333(±18.325) 1.363×10⁸(±6.279×10⁷) Recovery Phase 54.340(±10.067) 3.026×10⁷(±7.801×10⁶)
下载: 导出CSV
表 4 各相位Kp和上行能通量均值(
$ {\boldsymbol{\alpha}} {\bf{=0.05}} $ )Table 4. Mean value of Kp and upflow ions energy flux of each phase (
$ {\boldsymbol{\alpha}} {\bf{=0.05}} $ )Mean of Kp index Mean of energy flux /
(eV·cm–2·s–1·sr–1·eV –1)Initial Phases 2.7(±1.1) 5.909×10⁷(±5.773×10⁷) Main Phase 5.0(±1.0) 1.363×10⁸(±6.279×10⁷) Recovery Phase 3.5(±0.4) 3.026×10⁷(±7.801×10⁶)
下载: 导出CSV
表 5 各相位Poynting通量和上行能通量均值(
$ {\boldsymbol{\alpha}} {\bf{=0.05}} $ )Table 5. Mean value of Poynting flux and upflow energy flux of each phase (
$ {\boldsymbol{\alpha}} {\bf{=0.05}} $ )Magnetic storm
phaseMean of Poynting
flux/(mW·m–2)Mean of energy flux /
(eV·cm–2·s–1·sr–1·eV–1 )Initial Phase 2.192(±1.202) 5.909×10⁷(±5.773×10⁷) Main Phase 15.029(±6.710) 1.363×10⁸(±6.279×10⁷) Recovery Phase 9.961(±2.933) 3.026×10⁷(±7.801×10⁶)
下载: 导出CSV
表 6 经验公式参数估计值及相关系数
Table 6. Empirical formula parameter estimates and correlation coefficients
Magnetic storm phase a b r Initial Phase 0.484(±0.551) 6.898(±0.284) 0.660 Main Phase 0.888(±0.703) 6.469(±0.798) 0.541 Recovery Phase 0.446(±0.186) 6.969(±0.169) 0.575 注 括号内为95%置信区间。
下载: 导出CSV
-
[1] SHELLEY E G, JOHNSON R G, SHARP R D. Satellite observations of energetic heavy ions during a geomagnetic storm[J]. Journal of Geophysical Research, 1972, 77(31): 6104-6110 doi: 10.1029/JA077i031p06104 [2] YAU A W, SHELLEY E G, PETERSON W K, et al. Energetic auroral and polar ion outflow at DE 1 altitudes: Magnitude, composition, magnetic activity dependence, and long-term variations[J]. Journal of Geophysical Research, 1985, 90(A9): 8417-8432 doi: 10.1029/JA090iA09p08417 [3] BURCHILL J K, KNUDSEN D J, CLEMMONS J H, et al. Thermal ion upflow in the cusp ionosphere and its dependence on soft electron energy flux[J]. Journal of Geophysical Research: Space Physics, 2010, 115(A5): A05206 [4] MOORE T E, KHAZANOV G V. Mechanisms of ionospheric mass escape[J]. Journal of Geophysical Research: Space Physics, 2010, 115(A12): A00J13 [5] ZHAO K, CHEN K W, JIANG Y, et al. Latitude dependence of low-altitude O+ ion upflow: Statistical results from FAST observations[J]. Journal of Geophysical Research: Space Physics, 2017, 122(9): 9705-9722 doi: 10.1002/2017JA024075 [6] ZHAO K, KISTLER L M, LUND E J, et al. Factors controlling O+ and H+ outflow in the cusp during a geomagnetic storm: FAST/TEAMS observations[J]. Geophysical Research Letters, 2020, 47(11): e2020GL086975 [7] 傅帅, 蒋勇, 赵凯, 等. 极区顶部电离层离子上行的太阳活动依赖性研究[J]. 空间科学学报, 2017, 37(1): 28-38 doi: 10.11728/cjss2017.01.028FU Shuai, JIANG Yong, ZHAO Kai, et al. Solar activity dependence of ionosphere ion upflow in the polar topside[J]. Chinese Journal of Space Science, 2017, 37(1): 28-38 doi: 10.11728/cjss2017.01.028 [8] CULLY C M, DONOVAN E F, YAU A W, et al. Akebono/suprathermal mass spectrometer observations of low-energy ion outflow: Dependence on magnetic activity and solar wind conditions[J]. Journal of Geophysical Research: Space Physics, 2003, 108(A2): 1093 [9] 赵凯, 蒋勇, 门可佩, 等. 不同地磁活动水平下电离层H+上行的半球对比研究[J]. 地球物理学报, 2014, 57(11): 3715-3728 doi: 10.6038/cjg20141126ZHAO Kai, JIANG Yong, MEN Kepei, et al. Interhemispheric comparisons of ionospheric upflow H+ at various geomagnetic activity levels using FAST observations[J]. Chinese Journal of Geophysics, 2014, 57(11): 3715-3728 doi: 10.6038/cjg20141126 [10] 周康俊, 蔡红涛, 李影, 等. 高纬日侧电离层离子上行的地磁活动依赖性研究[J]. 地球物理学报, 2018, 61(2): 423-436 doi: 10.6038/cjg2018L0597ZHOU Kangjun, CAI Hongtao, LI Ying, et al. Geomagnetic activity dependences of high-latitude dayside ionospheric ion upflows[J]. Chinese Journal of Geophysics, 2018, 61(2): 423-436 doi: 10.6038/cjg2018L0597 [11] ZHAO K, JIANG Y, CHEN K W, et al. Geomagnetic and solar activity dependence of ionospheric upflowing O+: FAST observations[J]. Astrophysics and Space Science, 2016, 361(9): 295 doi: 10.1007/s10509-016-2872-3 [12] WILSON G R, OBER D M, GERMANY G A, et al. Nightside auroral zone and polar cap ion outflow as a function of substorm size and phase[J]. Journal of Geophysical Research: Space Physics, 2004, 109(A2): A02206 [13] OGAWA Y, SAWATSUBASHI M, BUCHERT S C, et al. Relationship between auroral substorm and ion upflow in the nightside polar ionosphere[J]. Journal of Geophysical Research: Space Physics, 2013, 118(11): 7426-7437 doi: 10.1002/2013JA018965 [14] DENG Y, SHENG C, SU Y J, et al. Correlation between Poynting flux and soft electron precipitation in the dayside polar cap boundary regions[J]. Journal of Geophysical Research: Space Physics, 2015, 120(10): 9102-9109 doi: 10.1002/2015JA021075 [15] YORDANOVA E, SUNDKVIST D, BUCHERT S C, et al. Energy input from the exterior cusp into the ionosphere: Correlated ground-based and satellite observations[J]. Geophysical Research Letters, 2007, 34(4): L04102 [16] HUANG C Y, HUANG Y S, SU Y J, et al. DMSP observations of high latitude Poynting flux during magnetic storms[J]. Journal of Atmospheric and Solar-Terrestrial Physics, 2017, 164: 294-307 doi: 10.1016/j.jastp.2017.09.005 [17] STRANGEWAY R J, ERGUN R E, SU Y J, et al. Factors controlling ionospheric outflows as observed at intermediate altitudes[J]. Journal of Geophysical Research: Space Physics, 2005, 110(A3): A03221 [18] CARLSON C W, PFAFF R F, WATZIN J G, et al. The fast auroral SnapshoT (FAST) mission[J]. Geophysical Research Letters, 1998, 25(12): 2013-2016 doi: 10.1029/98GL01592 [19] YANG Shaofeng. Low latitude pulsations during SC storm[J]. Chinese Journal of Geophysics, 1992, 35(2): 133-141 doi: 10.3321/j.issn:0001-5733.1992.02.001 [20] FU Suiyan, PU Zuyin, ZONG Qiugang, et al. Ion composition variations in the ring current during intense magnetic storms and their relationship with evolution of storms[J]. Chinese Journal of Geophysics, 2001, 44(1): 1-11 doi: 10.3321/j.issn:0001-5733.2001.01.001 [21] ZHENG Y H, MOORE T E, MOZER F S, et al. Polar study of ionospheric ion outflow versus energy input[J]. Journal of Geophysical Research: Space Physics, 2005, 110(A7): A07210 [22] LENNARTSSON O W, COLLIN H L, PETERSON W K. Solar wind control of Earth’s H+ and O+ outflow rates in the 15-eV to 33-keV energy range[J]. Journal of Geophysical Research: Space Physics, 2004, 109(A12): A12212 doi: 10.1029/2004JA010690 [23] BOUHRAM M, DUBOULOZ N, MALINGRE M, et al. Ion outflow and associated perpendicular heating in the cusp observed by Interball Auroral Probe and FAST Auroral Snapshot[J]. Journal of Geophysical Research: Space Physics, 2002, 107(A2): 1023 [24] CUI Y B, FU S Y, ZONG Q G, et al. Altitude of the upper boundary of AAR based on observations of ion beams in inverted-V structures: a case study[J]. Science China Earth Sciences, 2016, 59(7): 1489-1497 doi: 10.1007/s11430-016-0019-3 [25] LUND E J, MÖBIUS E, CARLSON C W, et al. Transverse ion acceleration mechanisms in the aurora at solar minimum: occurrence distributions[J]. Journal of Atmospheric and Solar-Terrestrial Physics, 2000, 62(6): 467-475 doi: 10.1016/S1364-6826(00)00013-4 -


 下载:
下载:


 点击查看大图
计量
- 文章访问数: 420
- HTML全文浏览量: 109
- PDF下载量: 21
- 被引次数: 0

