


Impact of Coriolis Force in the Falling-sphere Detection of Near-Space Atmospheric Environment
-
摘要:
气象火箭落球探测技术是临近空间大气环境探测的重要方法。在落球探测数据处理过程中,通常忽略科氏力项的影响。本文利用经验预报模式构建落球探测正演仿真模型,并根据落球探测原理建立参数反演模型,在此基础上仿真模拟了落球探测数据处理过程中忽略科氏力项对大气参数反演精度的影响。在95~100 km高度范围内,忽略科氏力项将引起温度、密度、纬向风和经向风等大气参数较大反演误差,其误差特性随探测点纬度、各方向初始速度等呈现不同的变化规律,之后反演误差将随高度下降而逐渐下降。当高度下降至约70 km时科氏力项带来的影响基本可以忽略不计。研究结果表明在临近空间大气环境落球探测数据处理过程中不能忽略科氏力项的影响。本文结果对提高落球探测大气参数反演精度具有重要的参考价值。
Abstract:Meteorological rocket falling-sphere detection technology is an important method for detecting atmospheric environment in near space. The influence of Coriolis force was usually ignored in the data processing of falling-sphere detection. The empirical forecasting models were used to build a forward simulation model for falling-sphere detection, and a parameter inversion model was established according to the principle of falling-sphere detection. The forward model and inversion model were combined to simulate the inversion error of retrieved parameters when ignoring the Coriolis force term. In the height range of 95 ~ 100 km, the inversion errors of atmospheric parameters such as temperature, density, zonal wind and meridional wind are relatively large, and the error characteristics vary with the latitude of the detection point and the initial velocity in each direction. After that, the inversion error gradually decreases as the height decreases. When it drops to about 70km, the influence caused by the Coriolis force term is gradually negligible. The research results show that the influence of the Coriolis force term can’t be ignored during the data processing of falling-sphere detection. The results of this paper have an important reference value for improving the accuracy of atmospheric parameter inversion for falling-sphere detection.
-
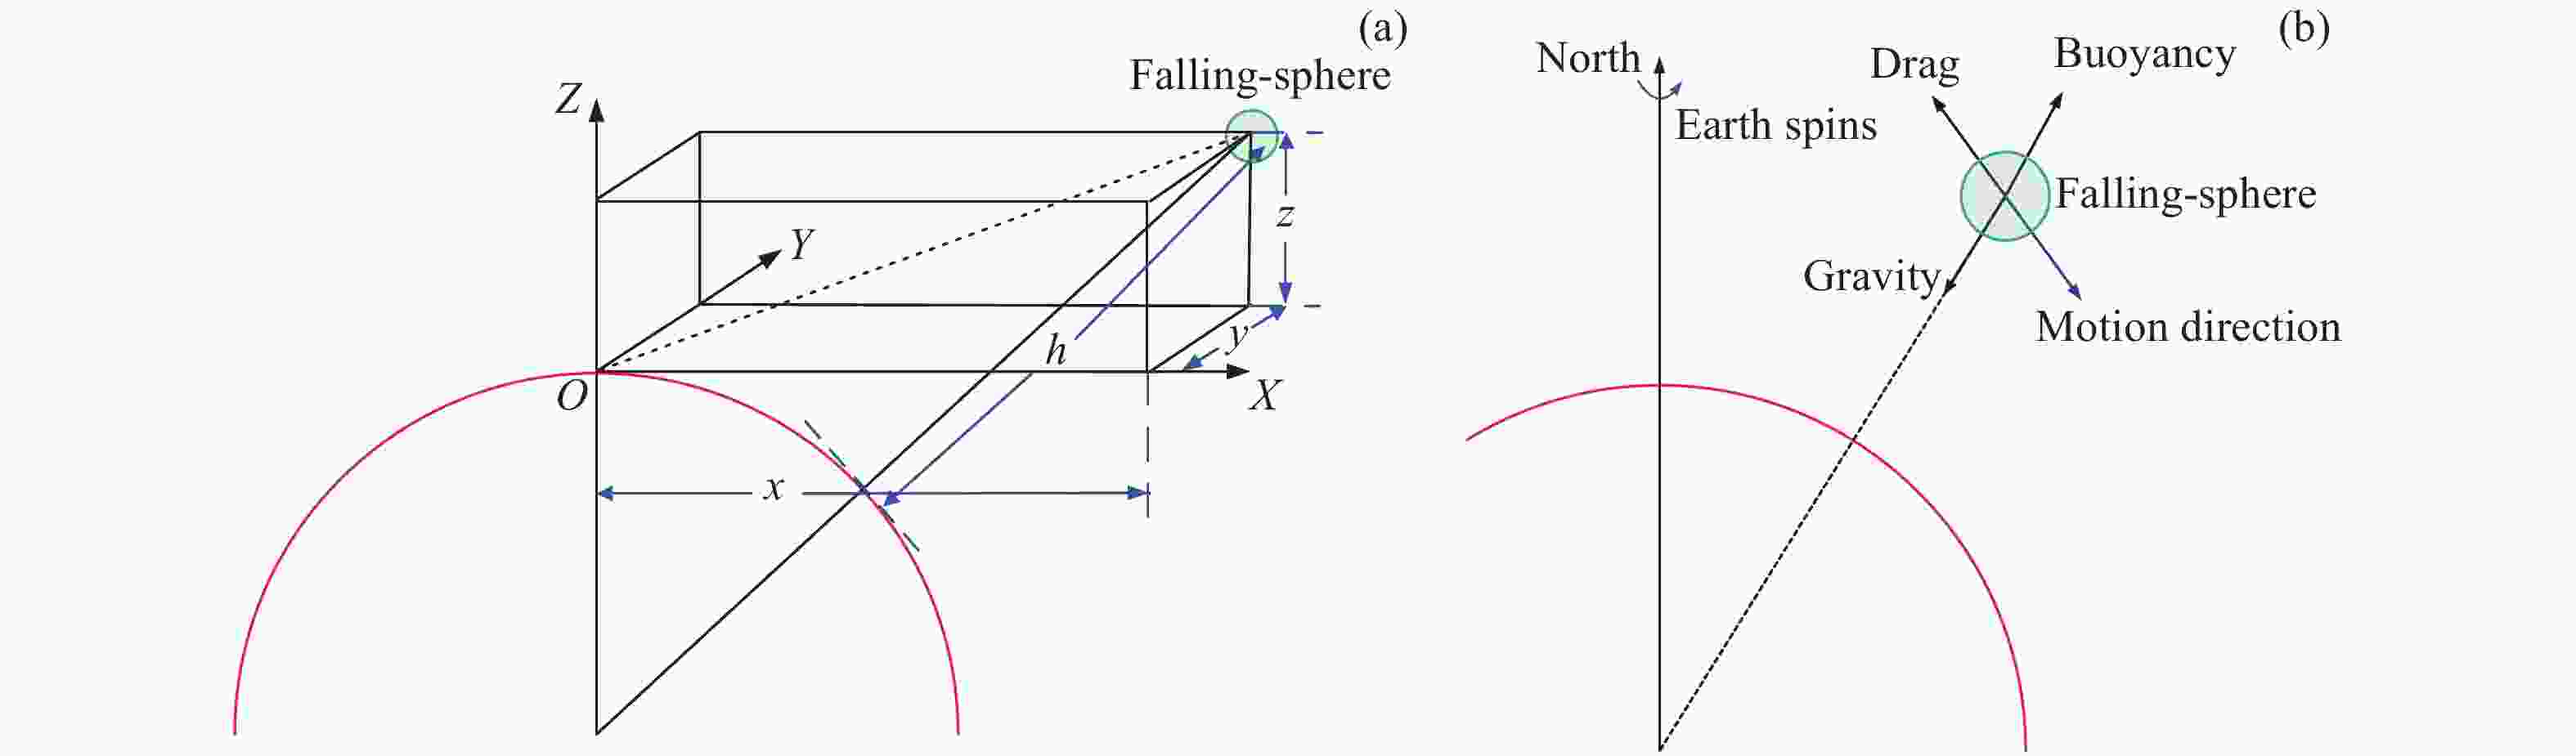
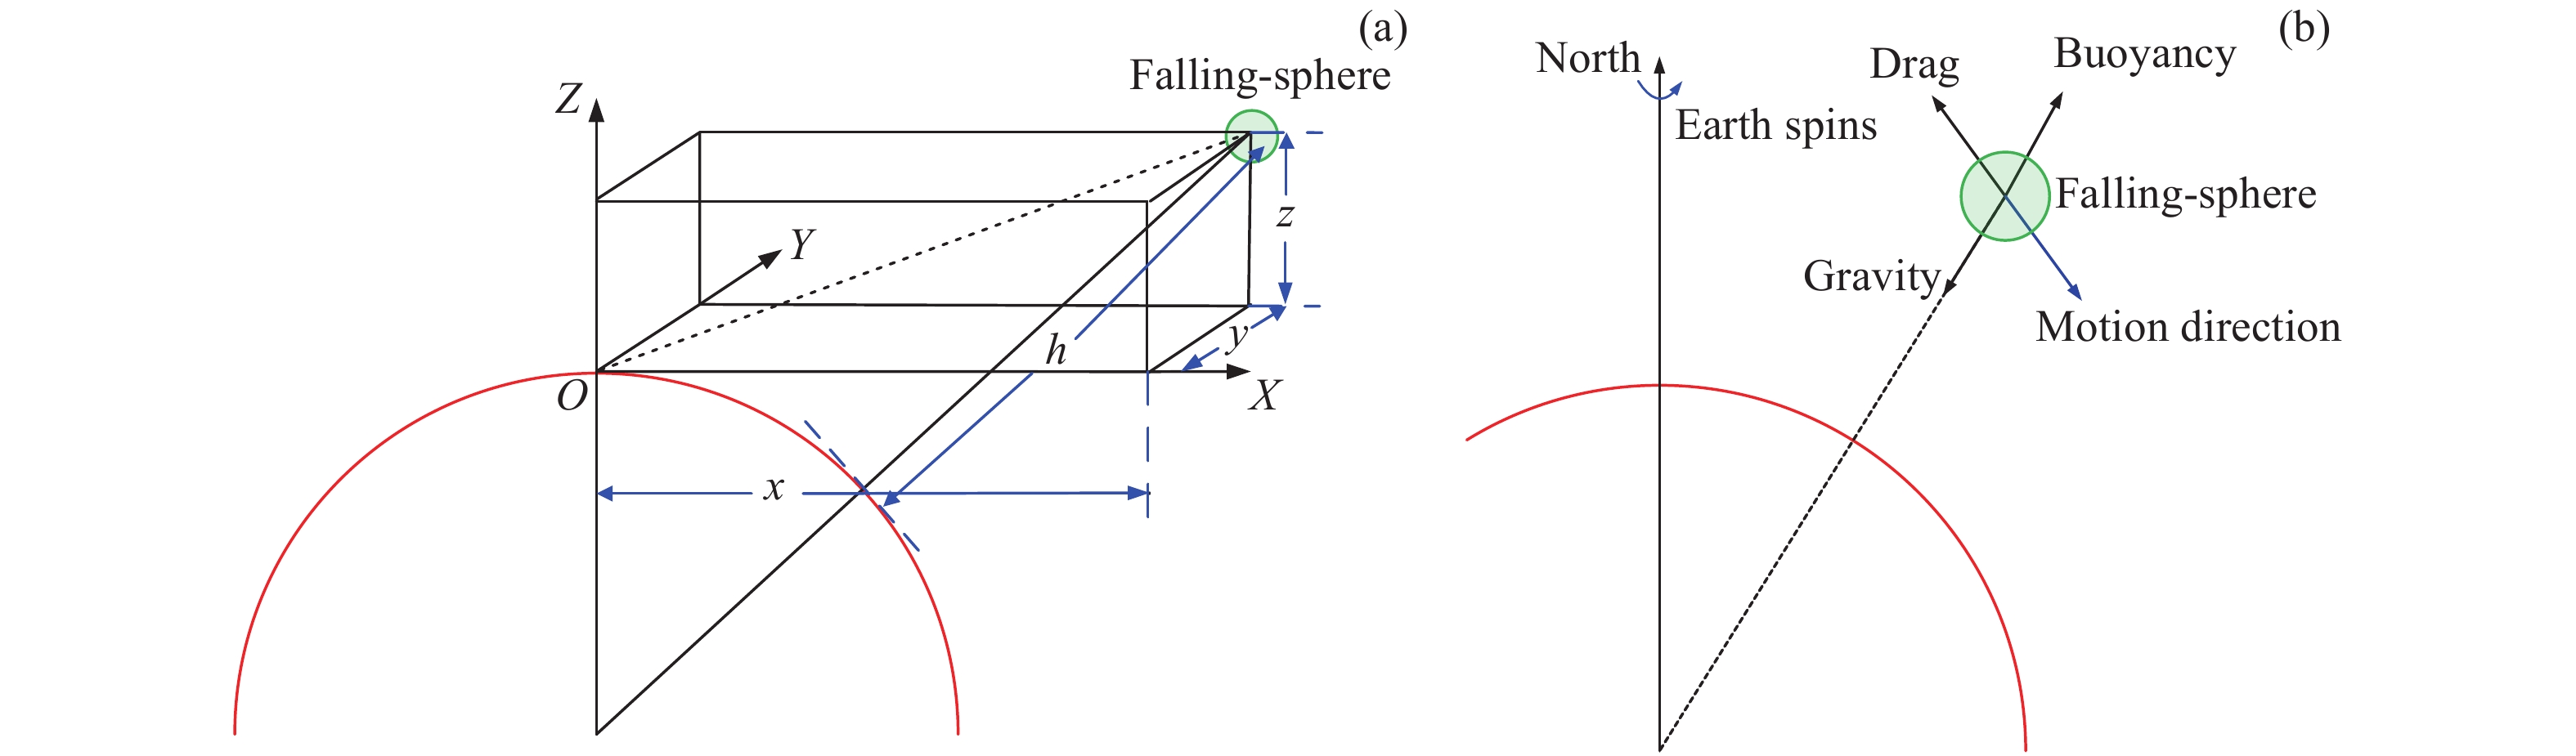
图 1 落球的空间三维坐标系(a)与受力分析(b)
Figure 1. Three-dimensional coordinate system (a) and force analysis (b) of falling-sphere
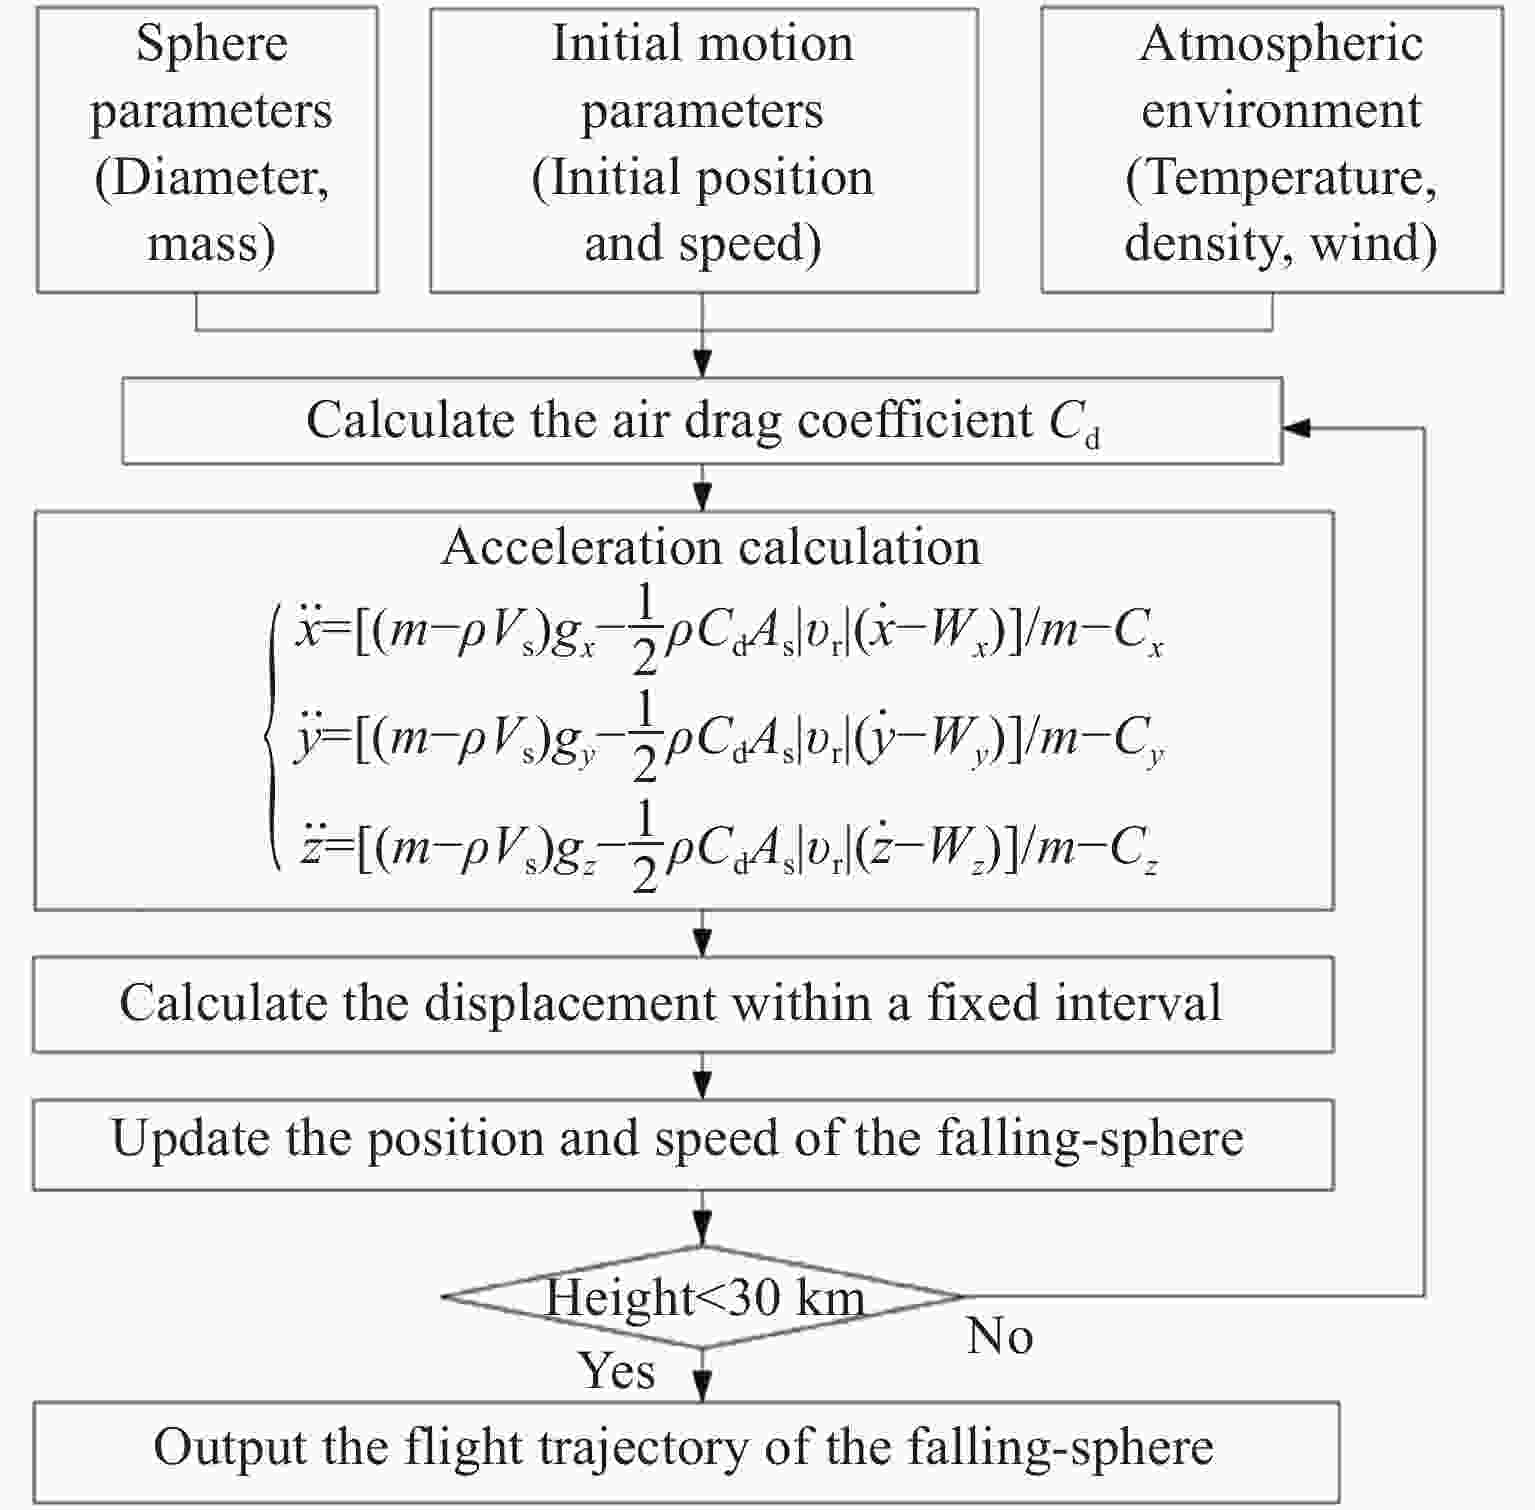
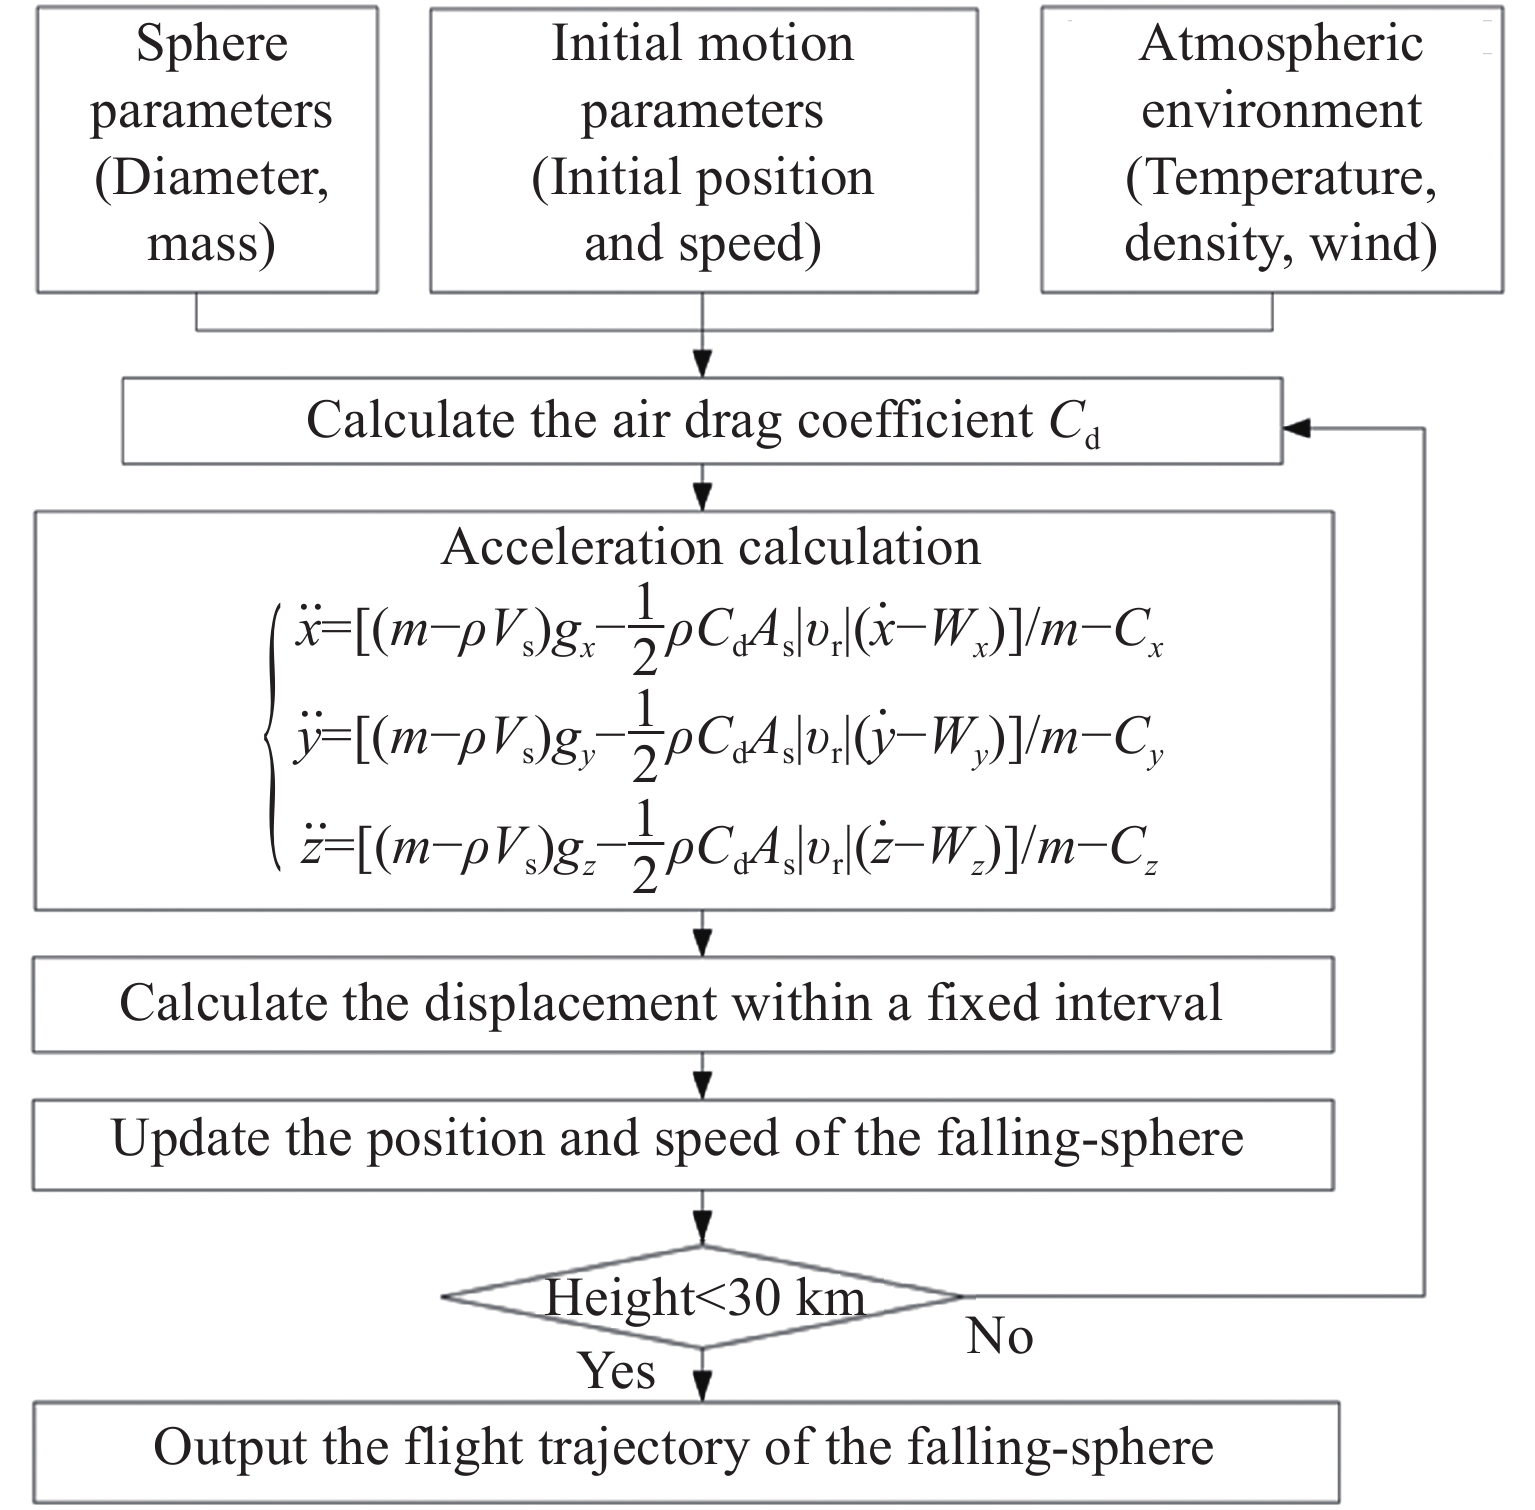
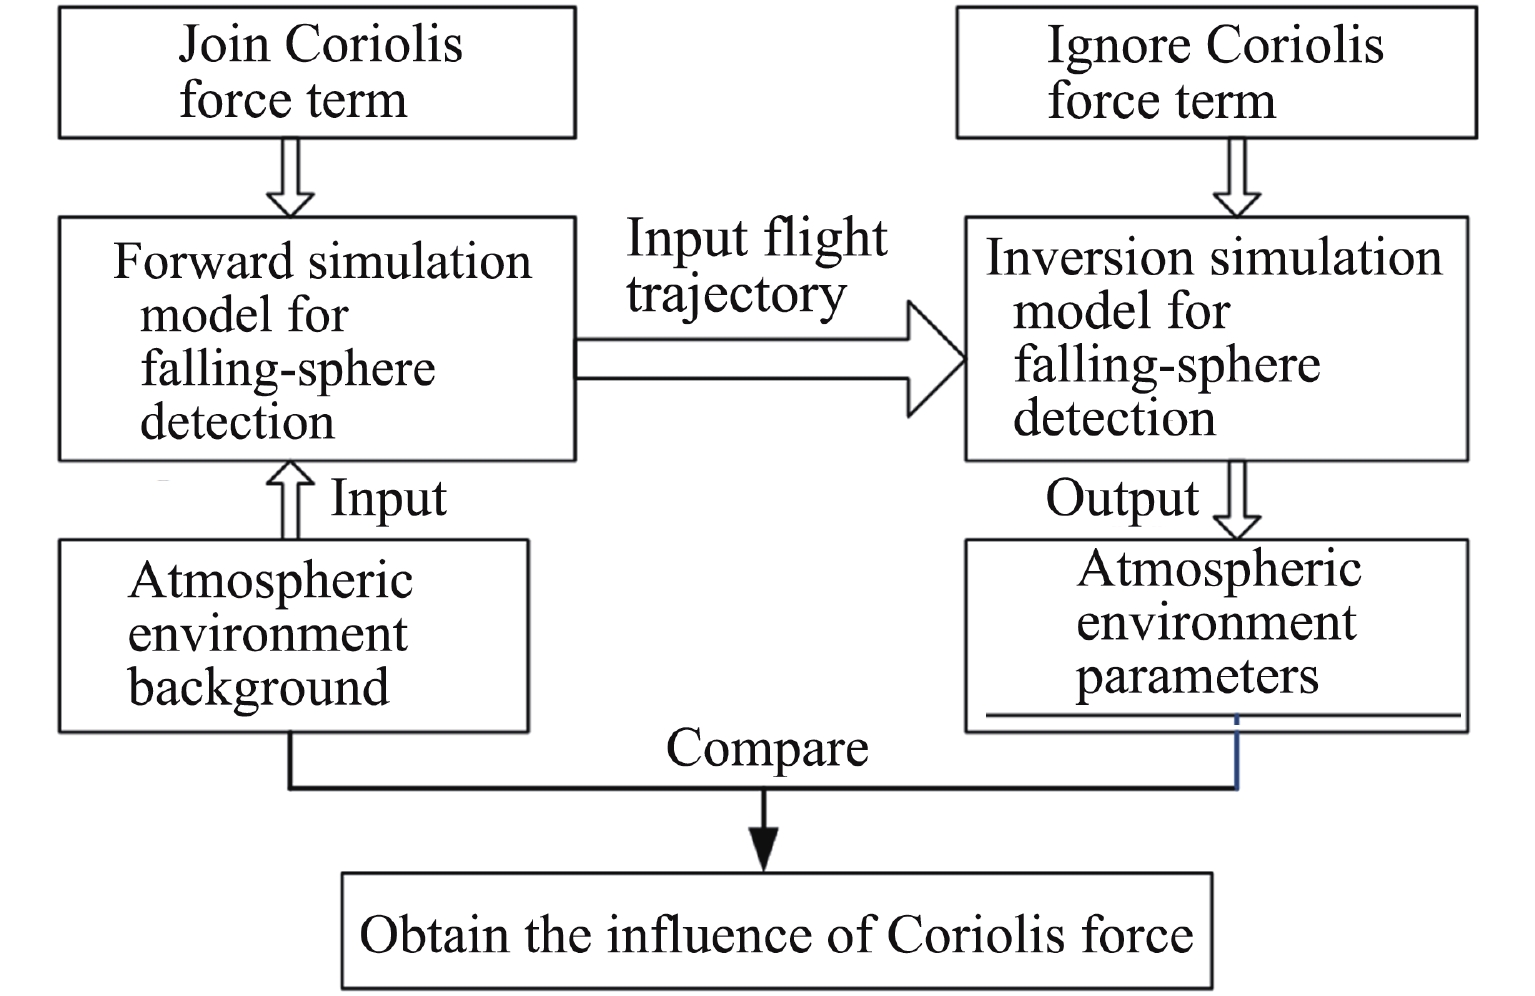
图 2 落球探测正演仿真模型流程
Figure 2. Flow chart of forward simulation model for falling-sphere detection

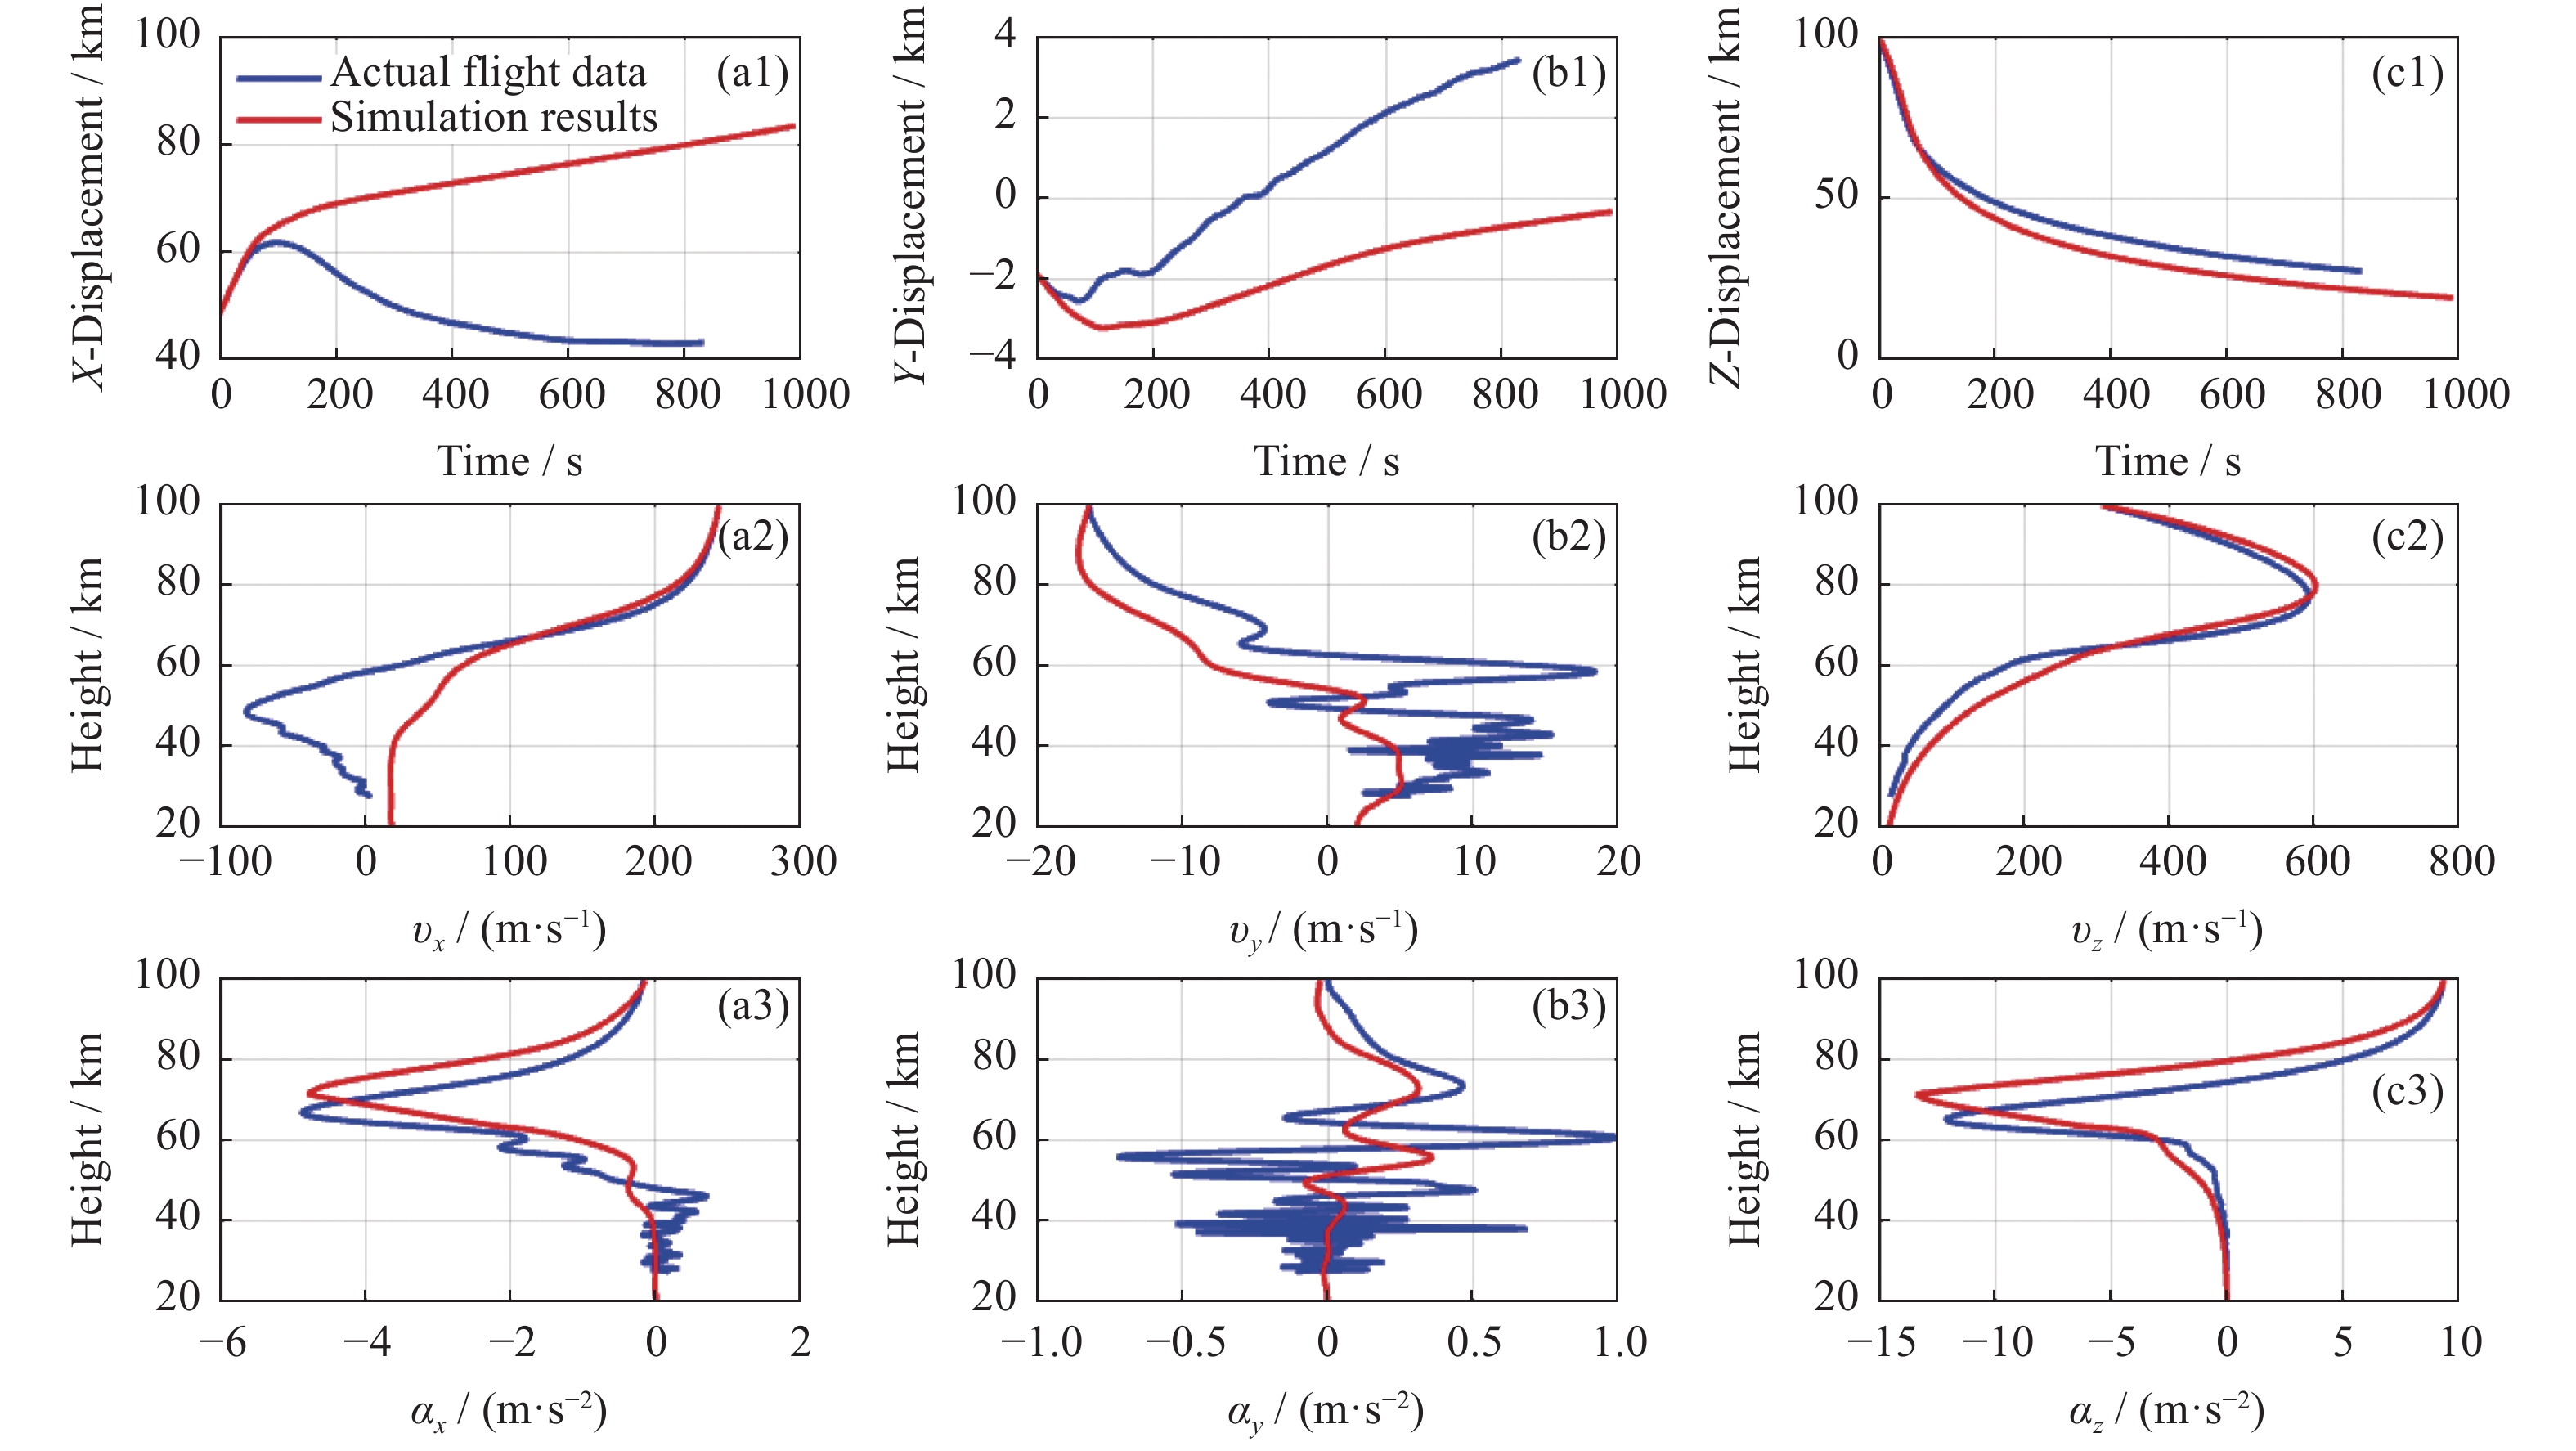
图 3 正演仿真模型落球飞行轨迹与真实落球飞行轨迹的对比
Figure 3. Comparison of the modeling flight path and the real flight path
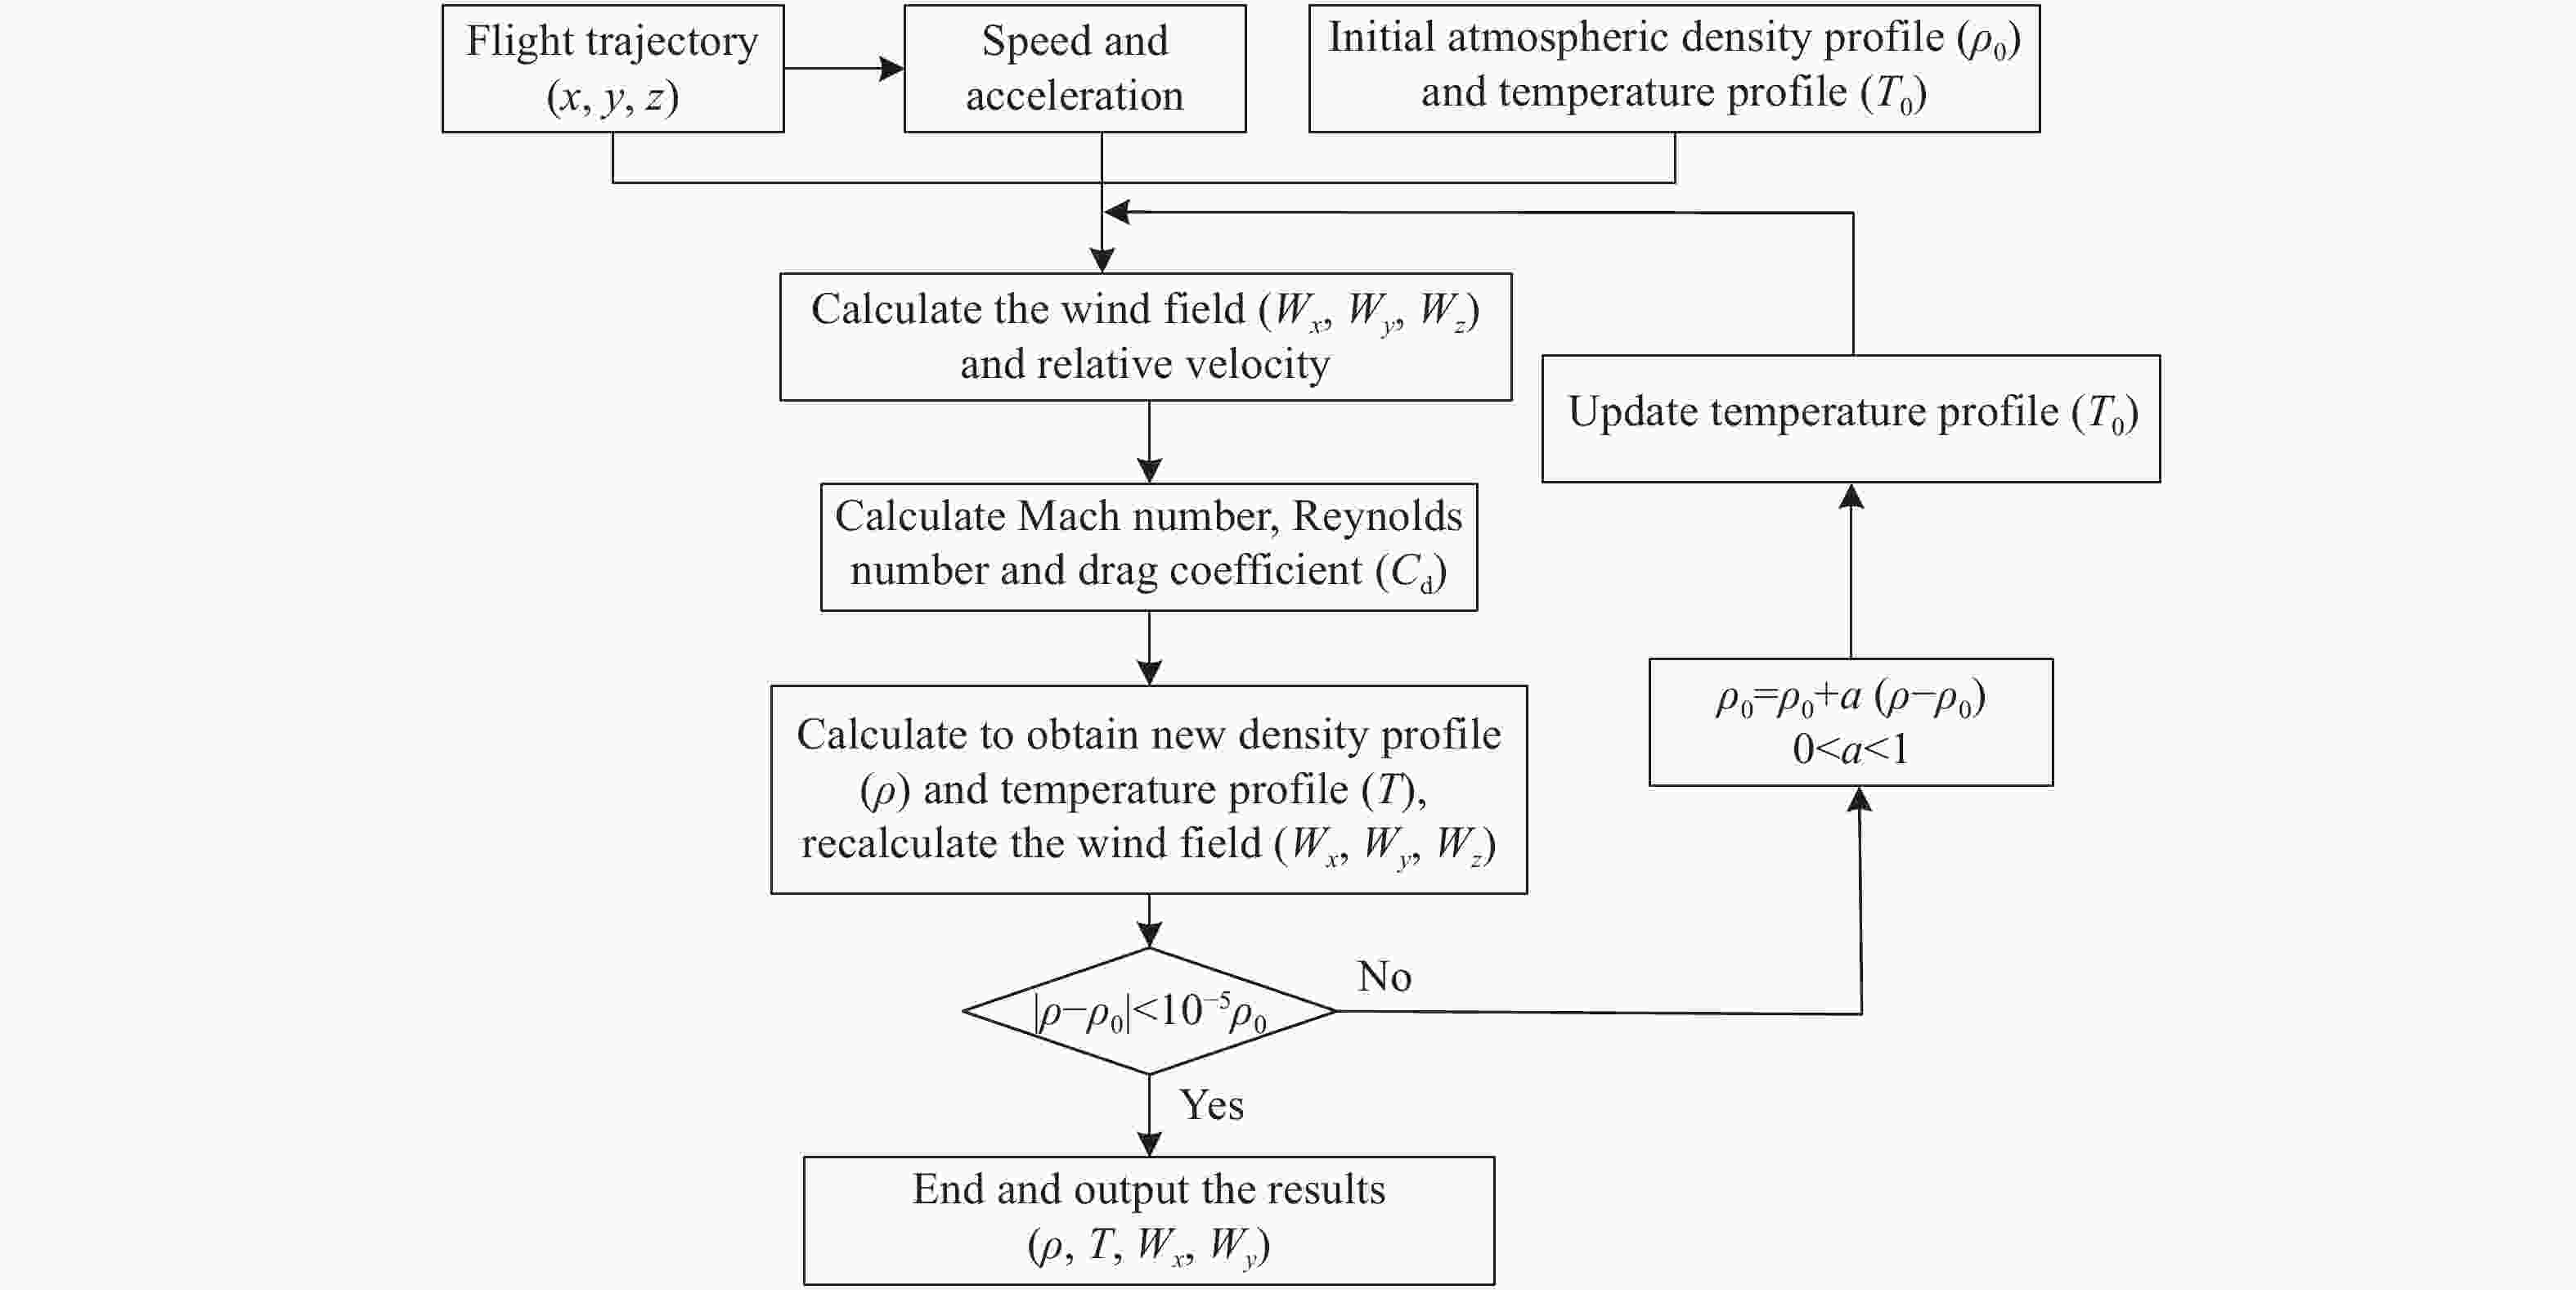
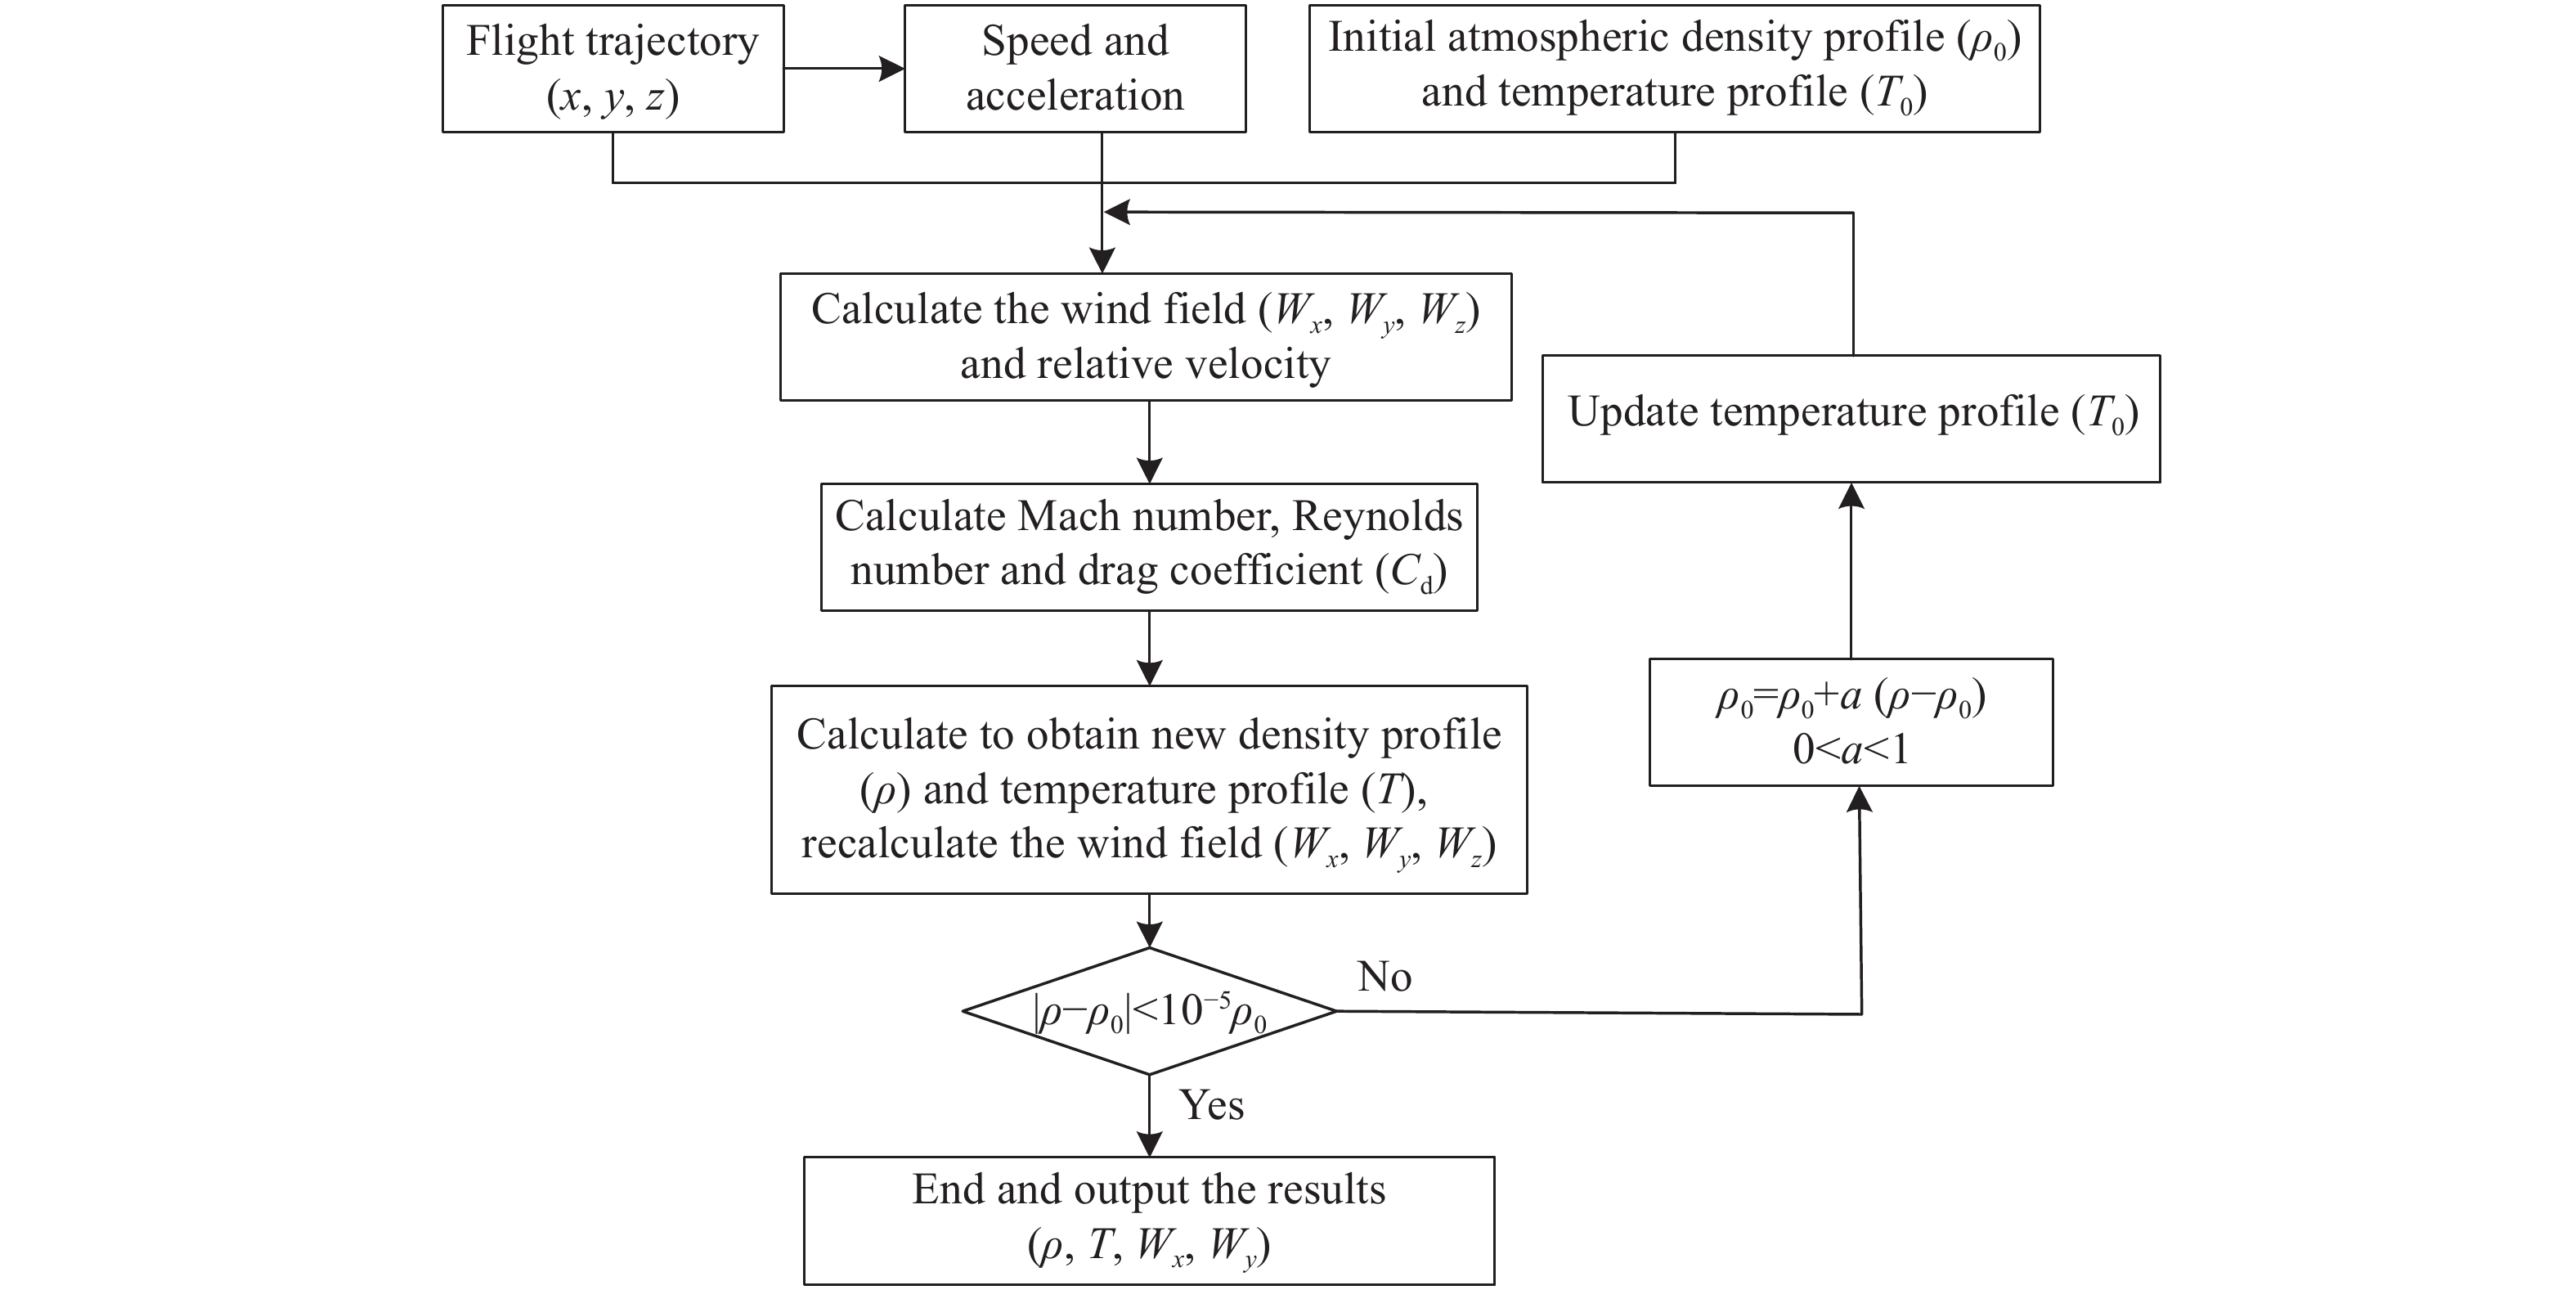
图 4 落球探测大气参数反演模型流程
Figure 4. Flow chart of inversion model of atmospheric parameters for falling-sphere detection
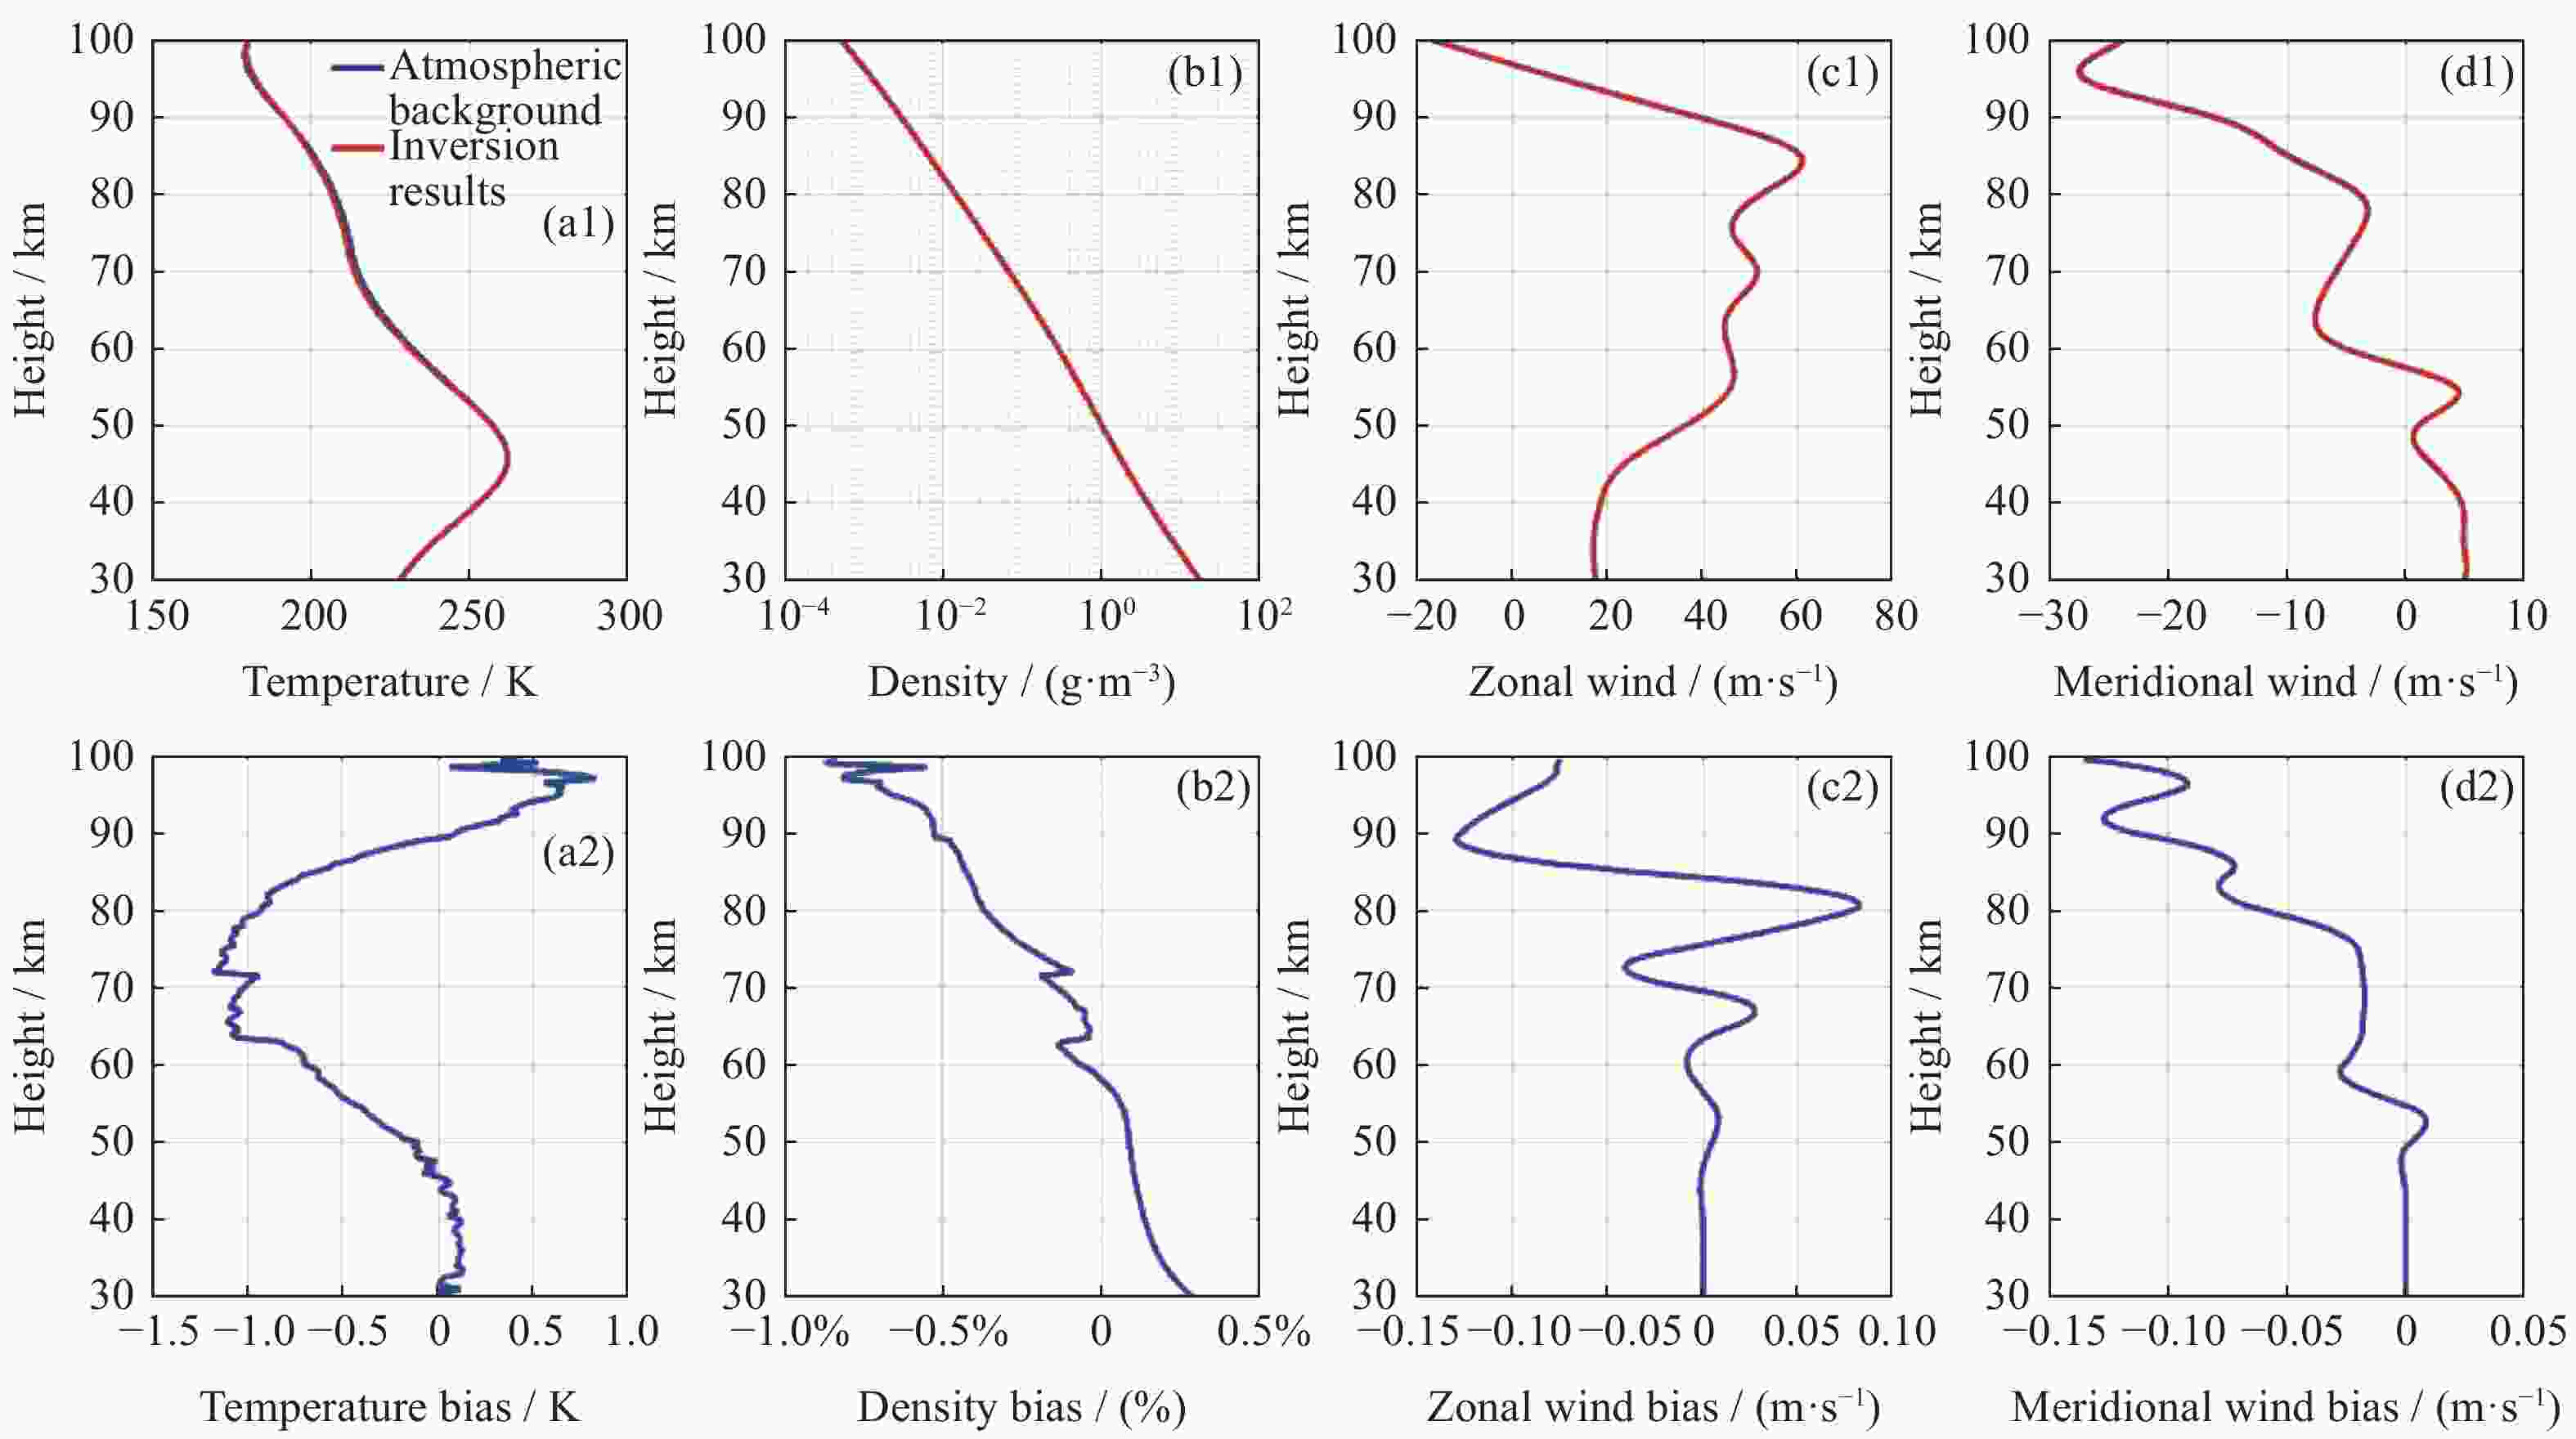
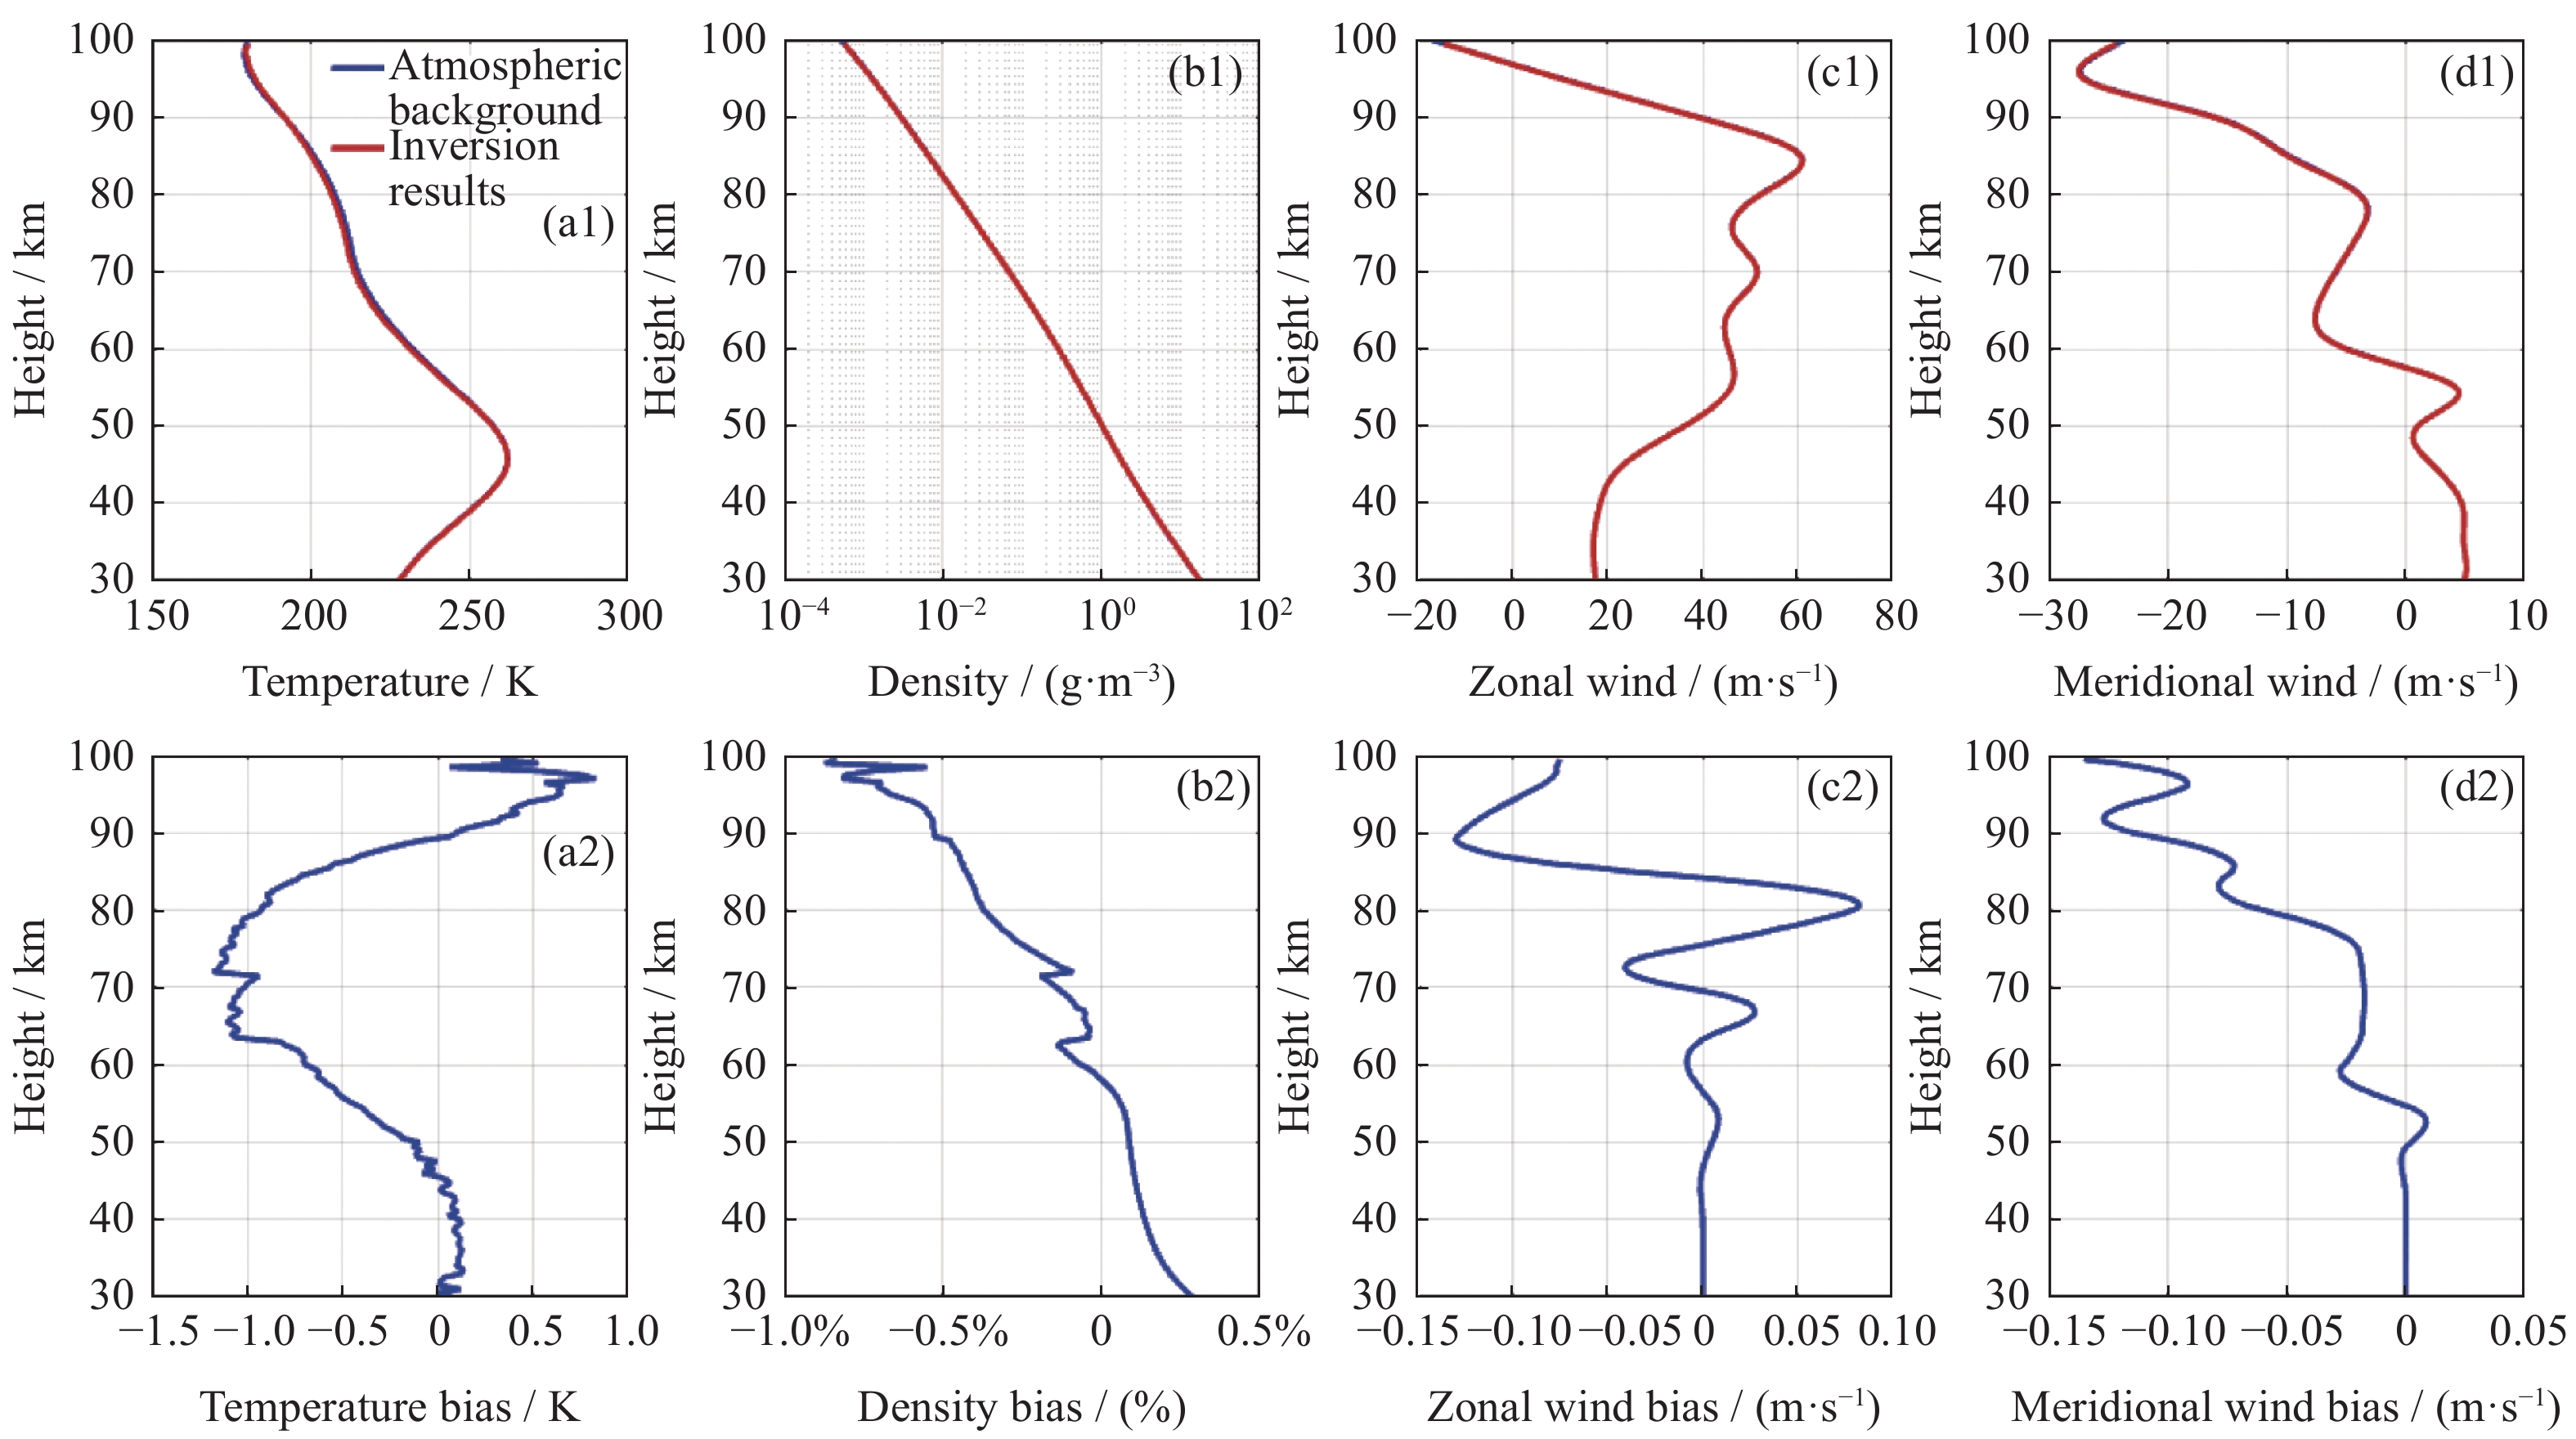
图 5 落球探测大气参数反演结果与背景环境大气参数对比
Figure 5. Comparison of atmospheric parameters between inversion results and background environment
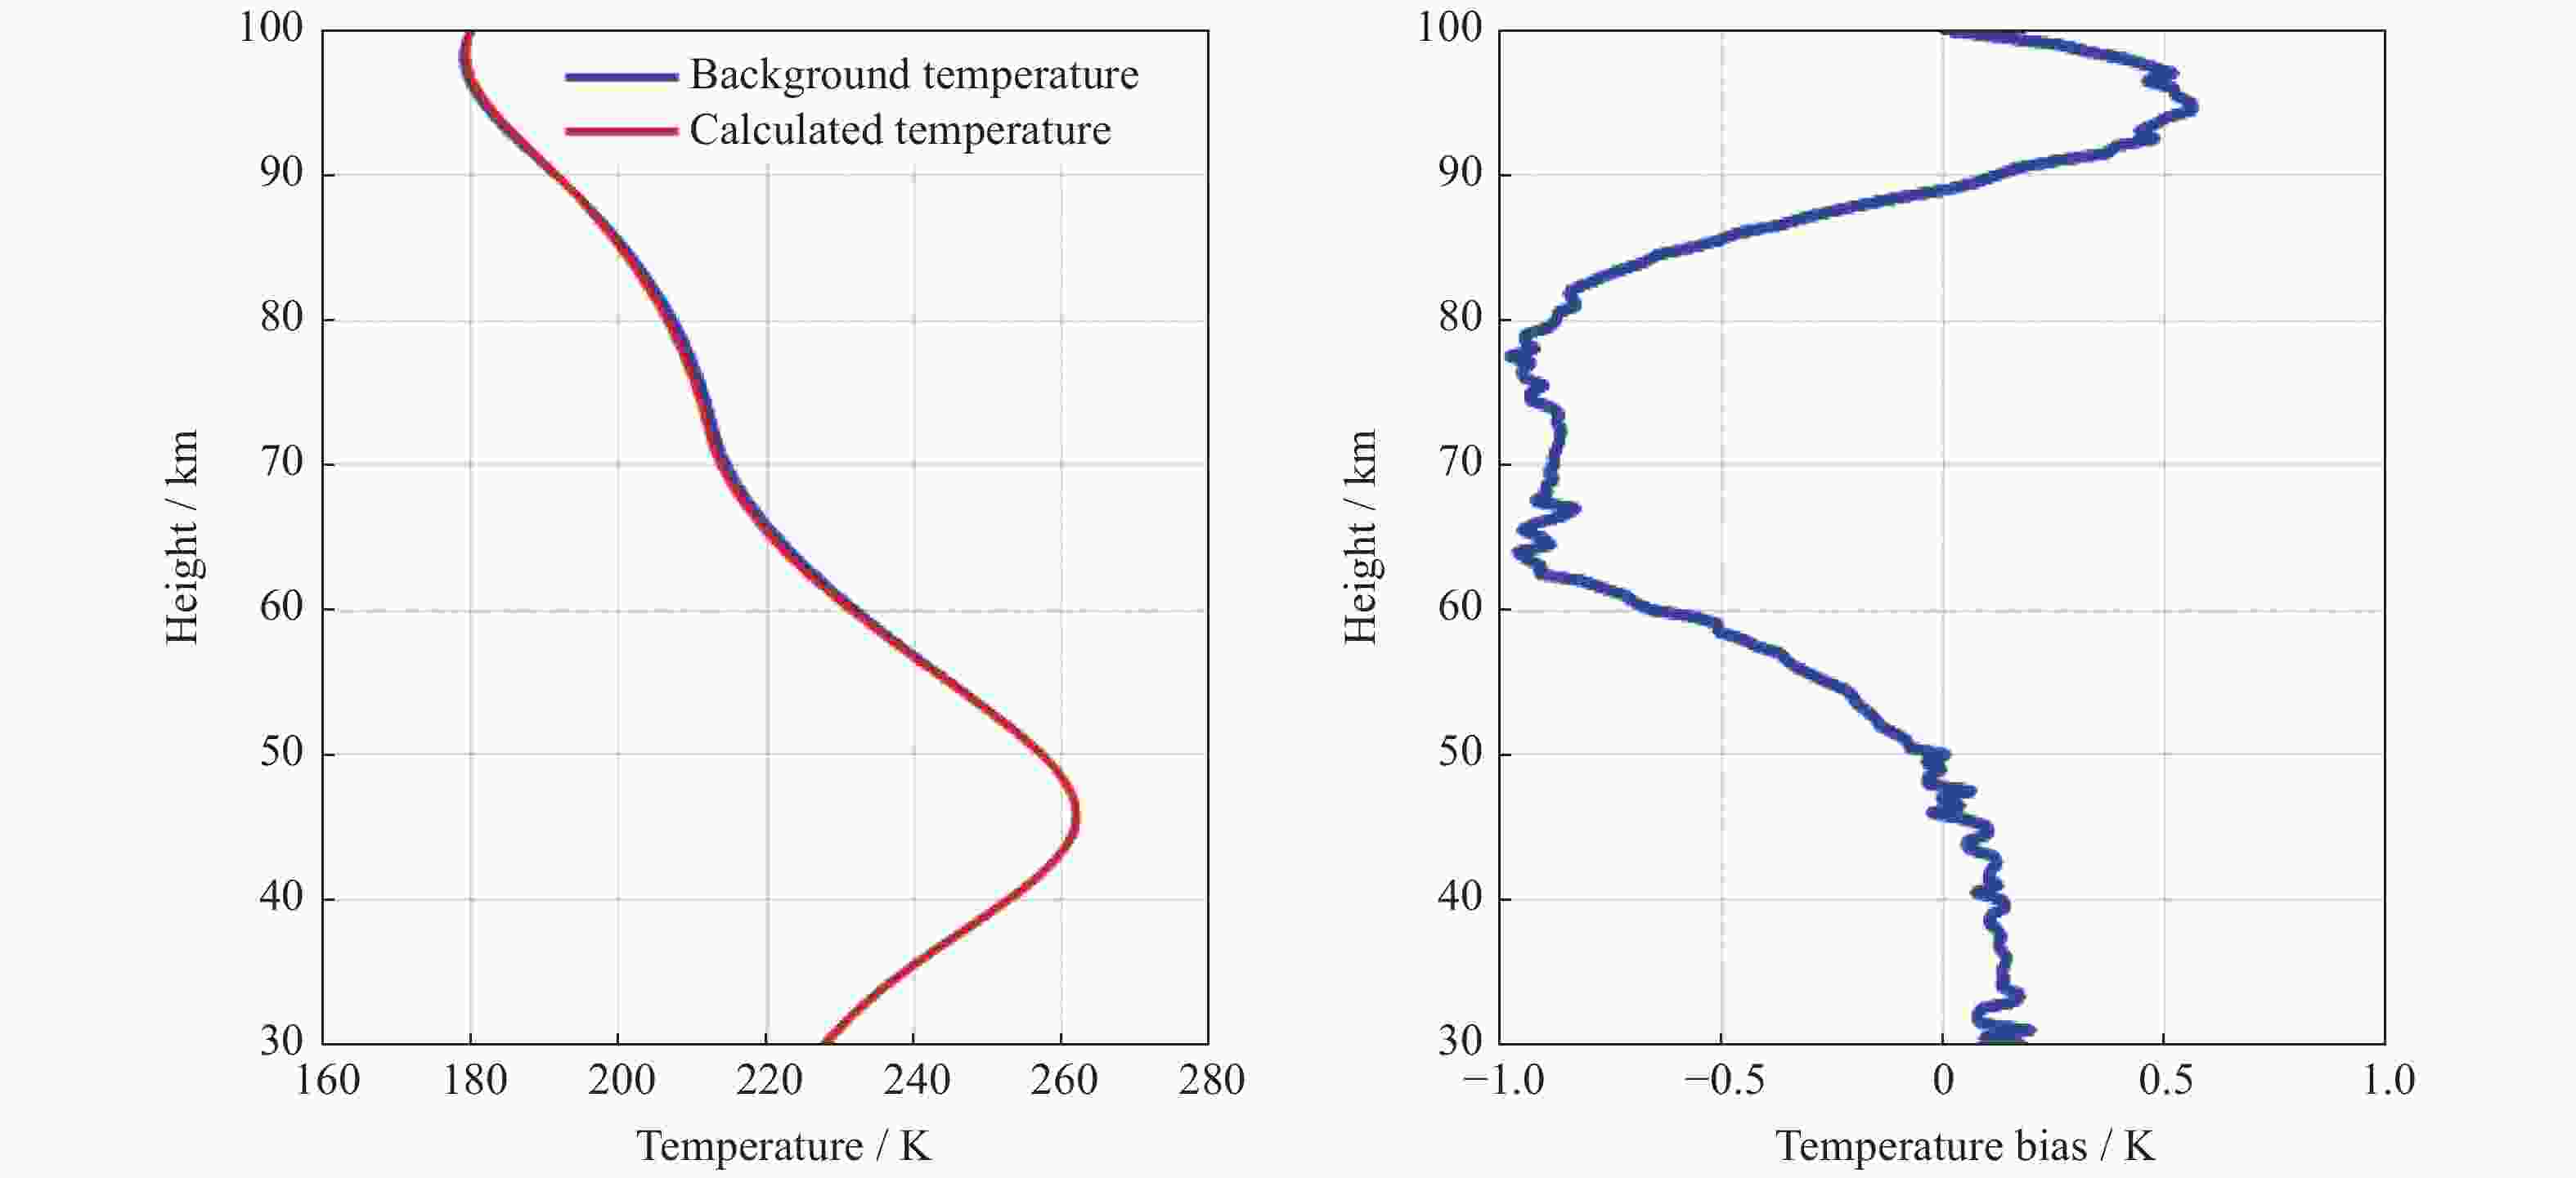
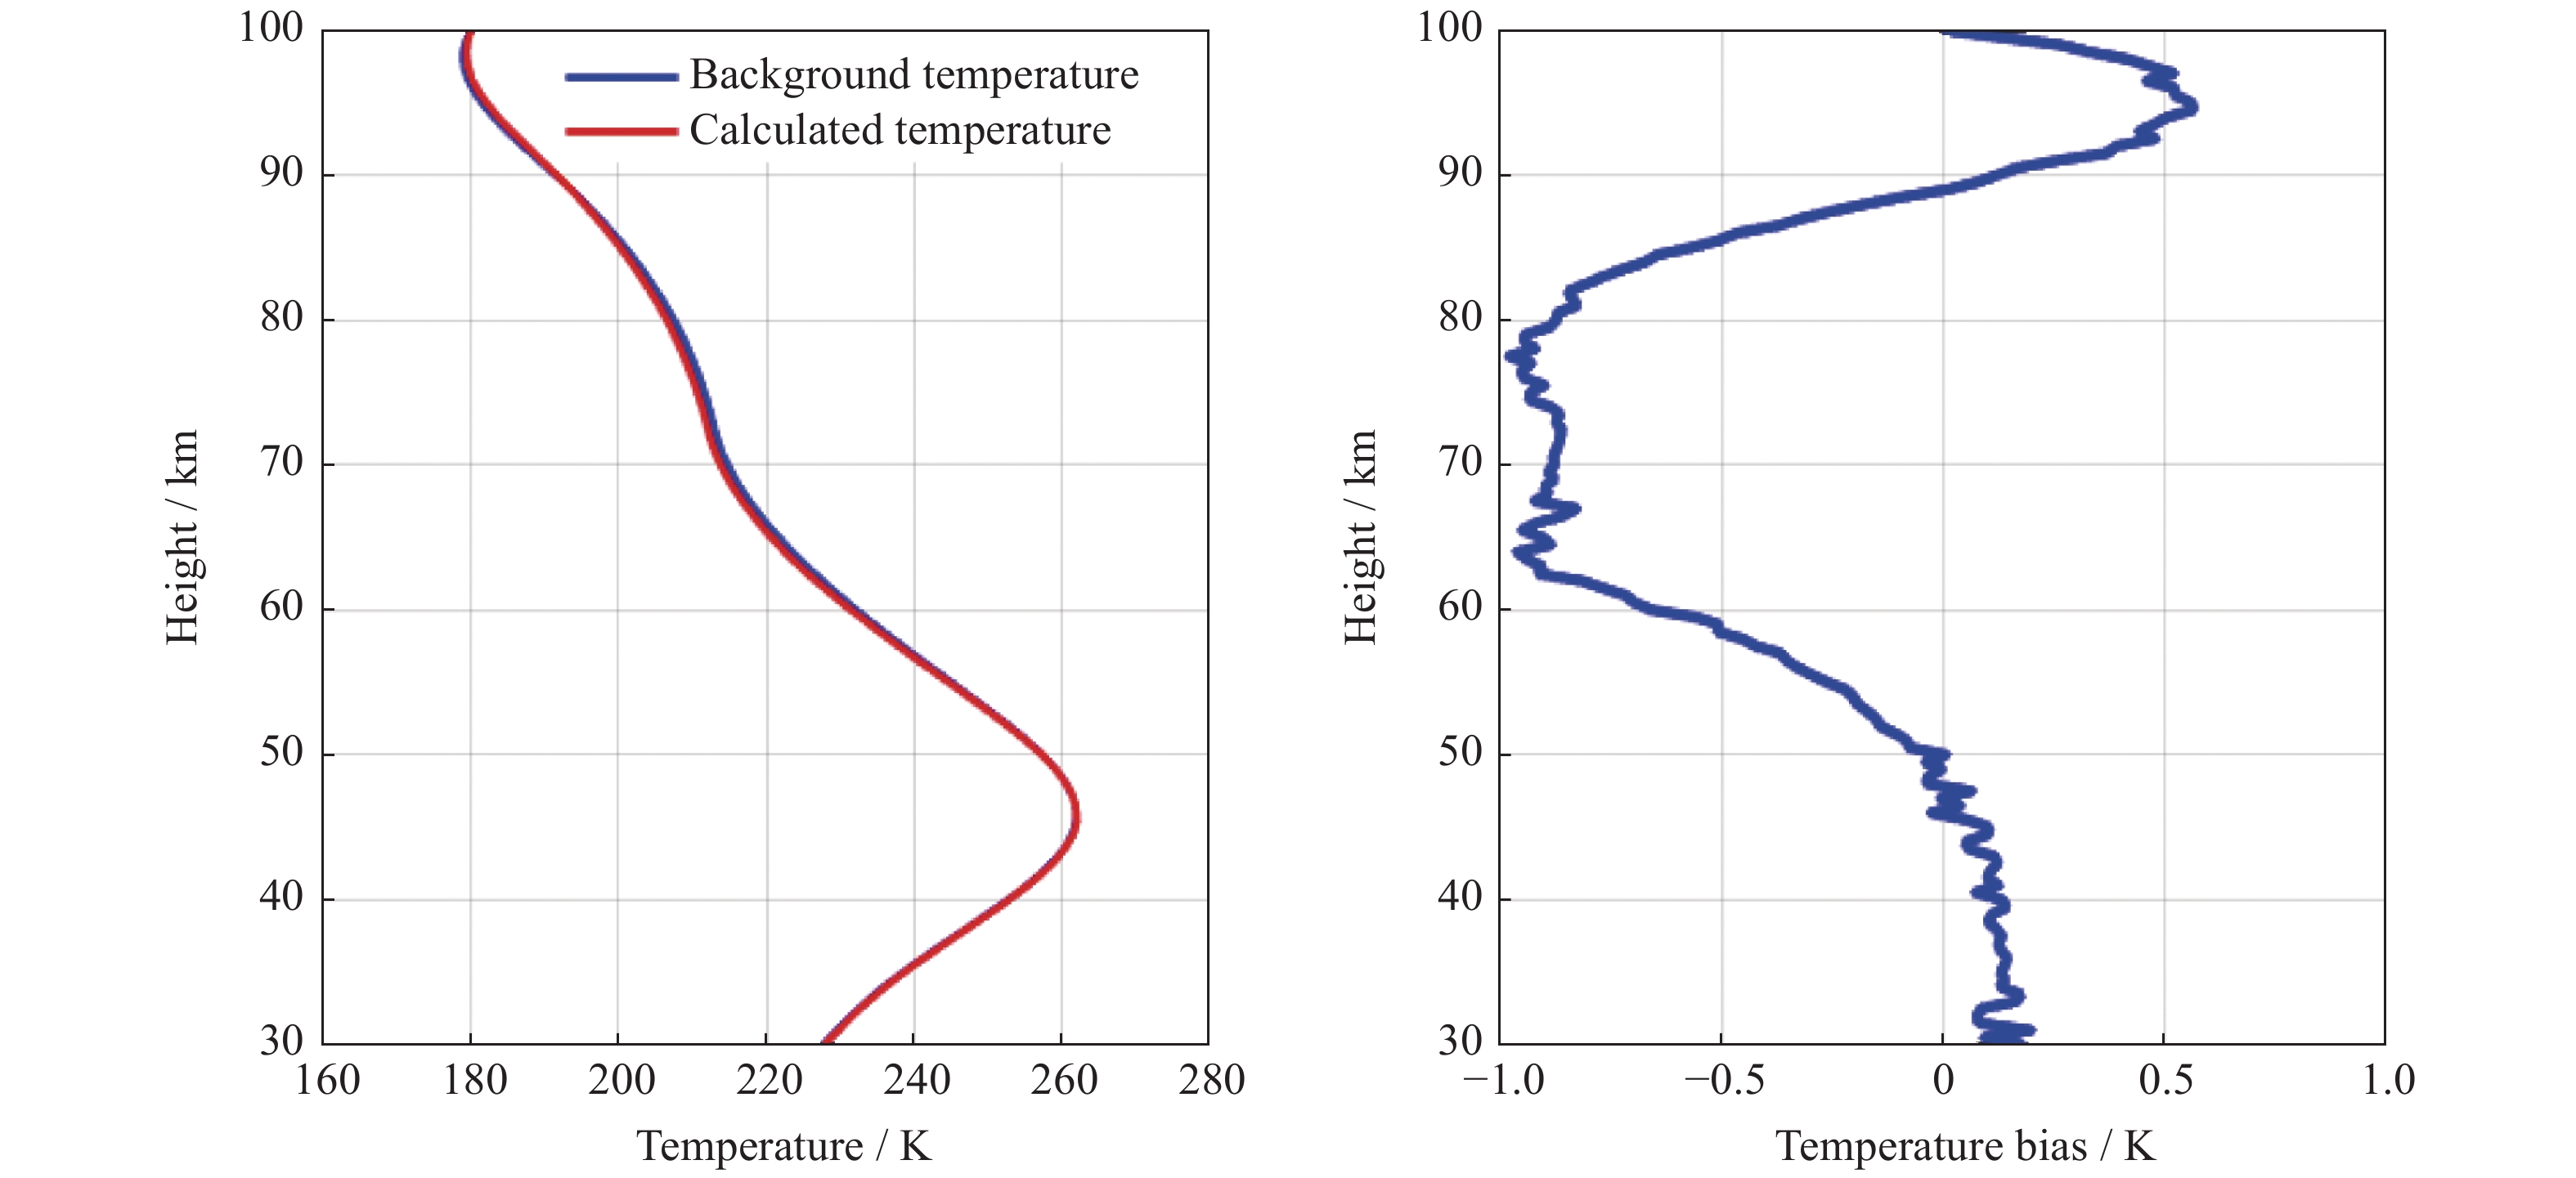
图 6 大气密度廓线推导计算大气温度廓线时的误差
Figure 6. Error diagram of atmospheric temperature profile derived from atmospheric density profile
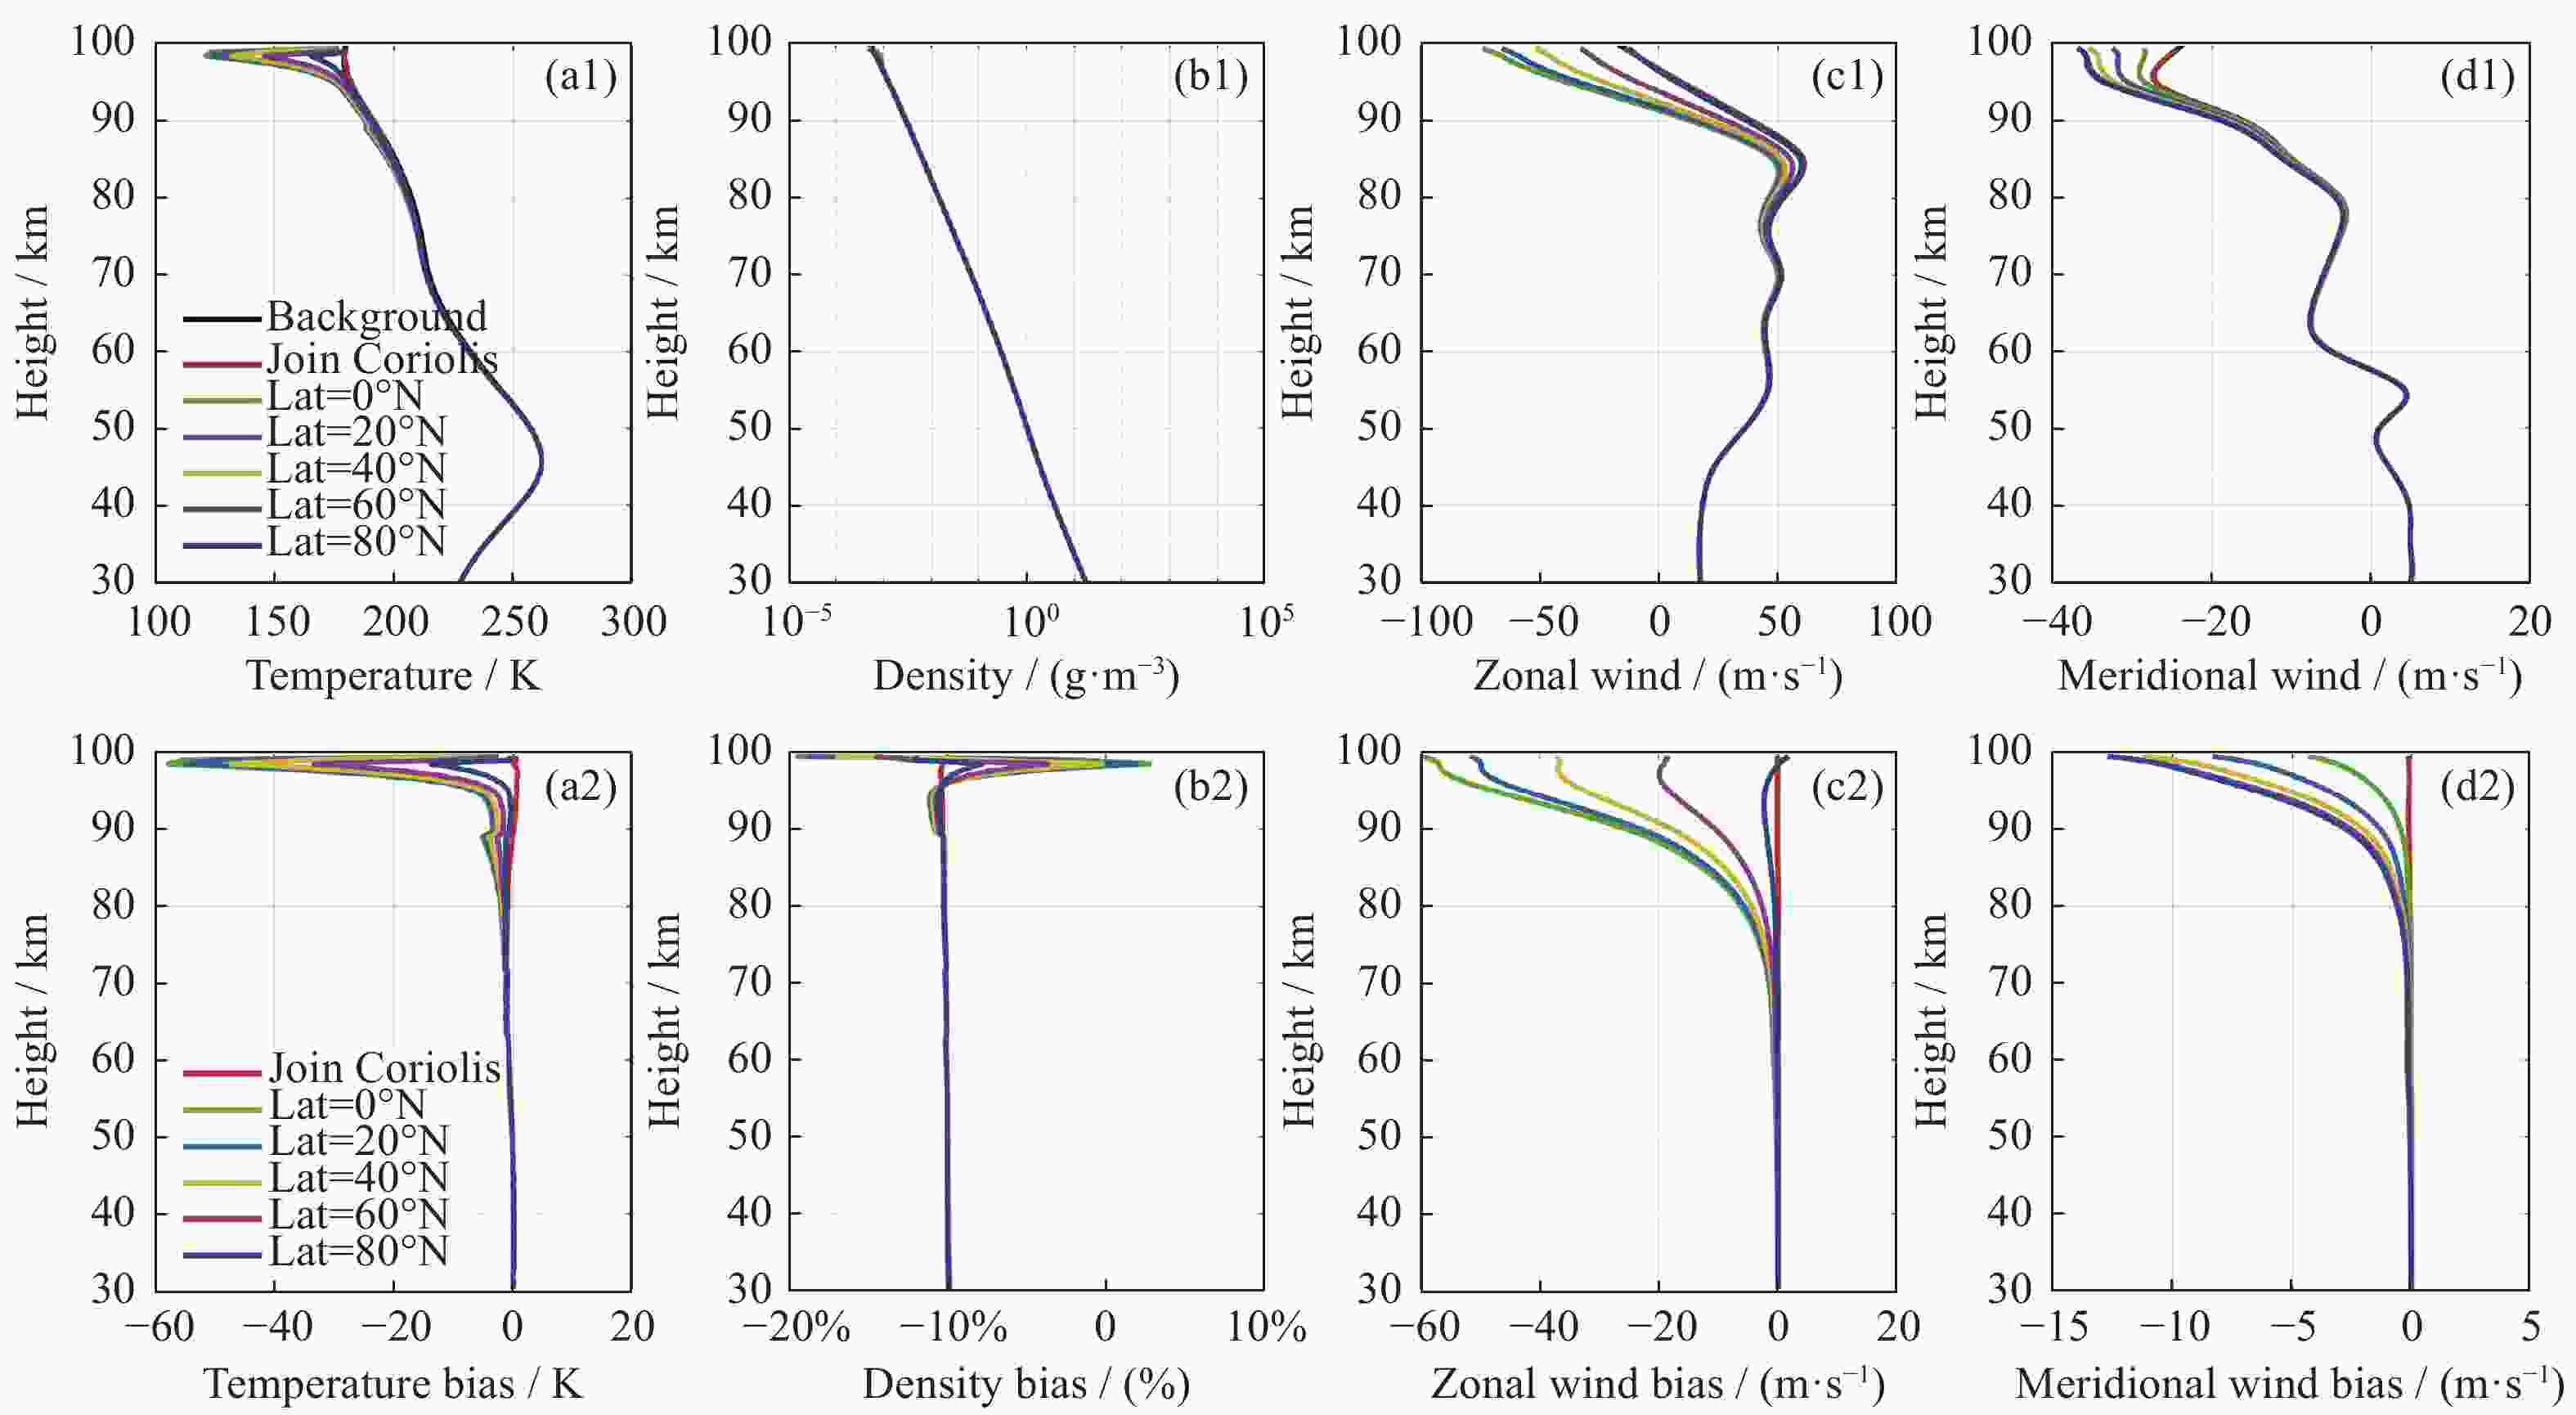
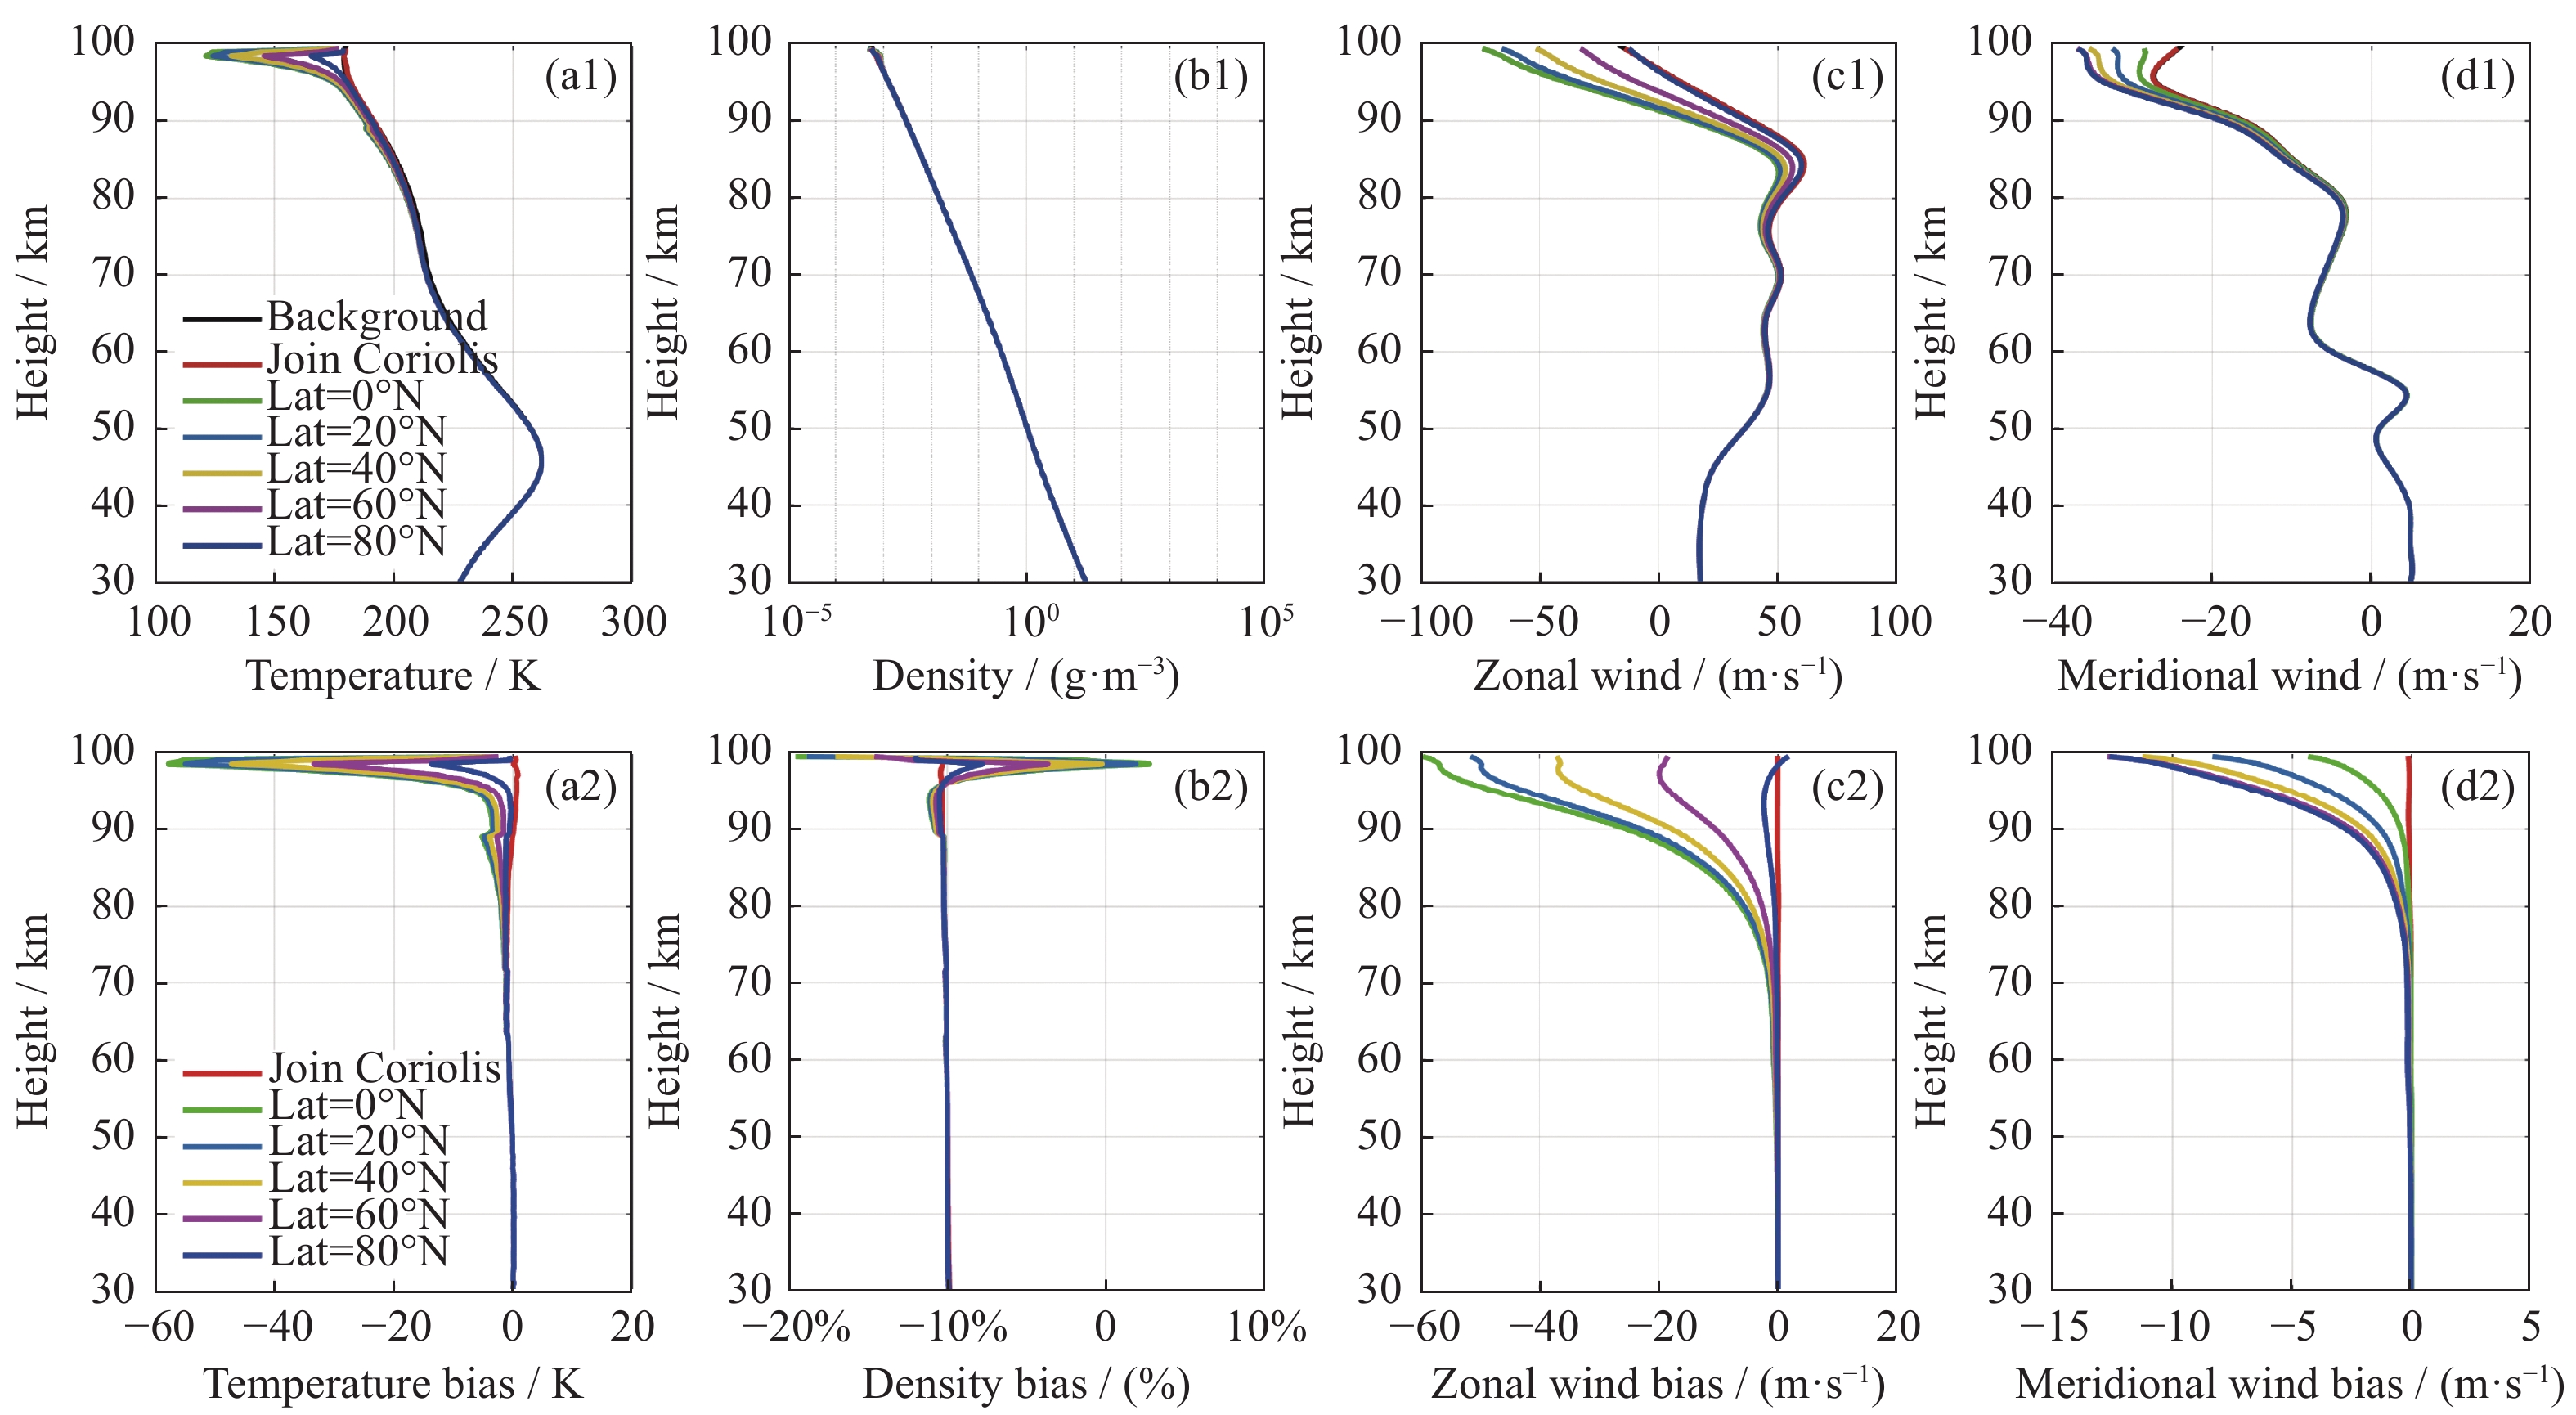
图 8 不同纬度条件下忽略科氏力项时的大气参数反演结果及误差廓线
Figure 8. Atmospheric parameter inversion results and error profiles when the Coriolis force term is ignored for different latitudes
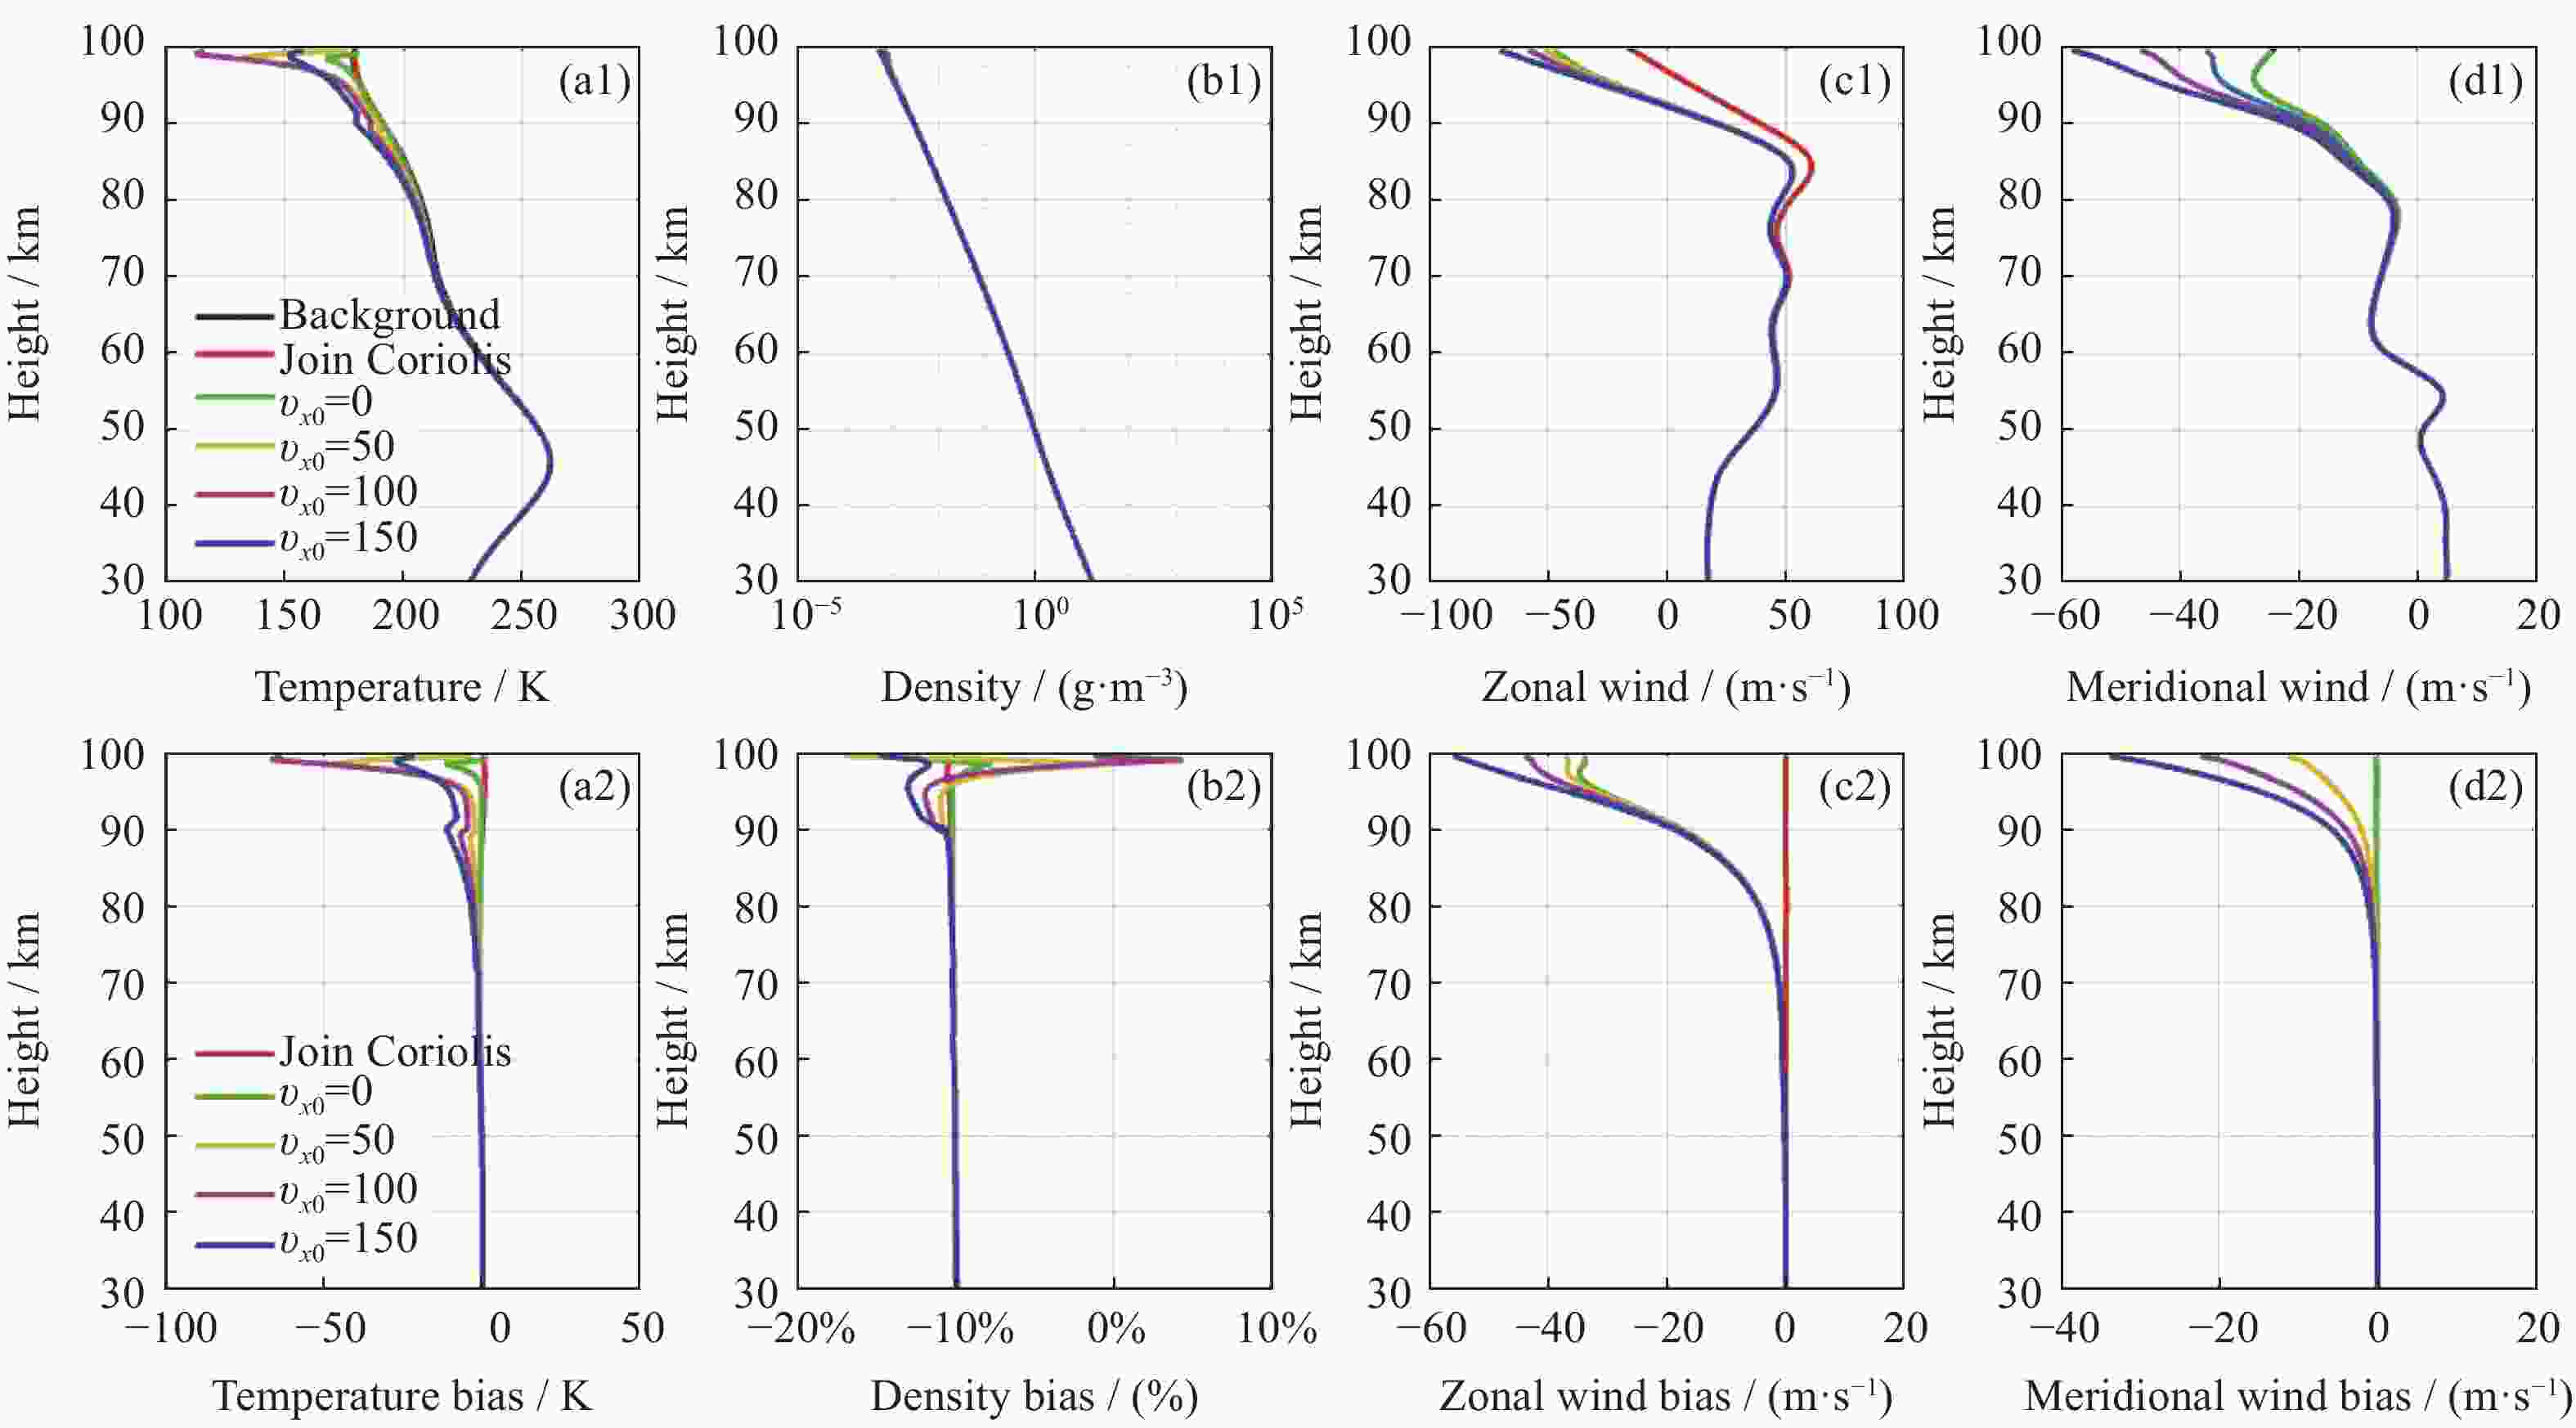
图 9 不同
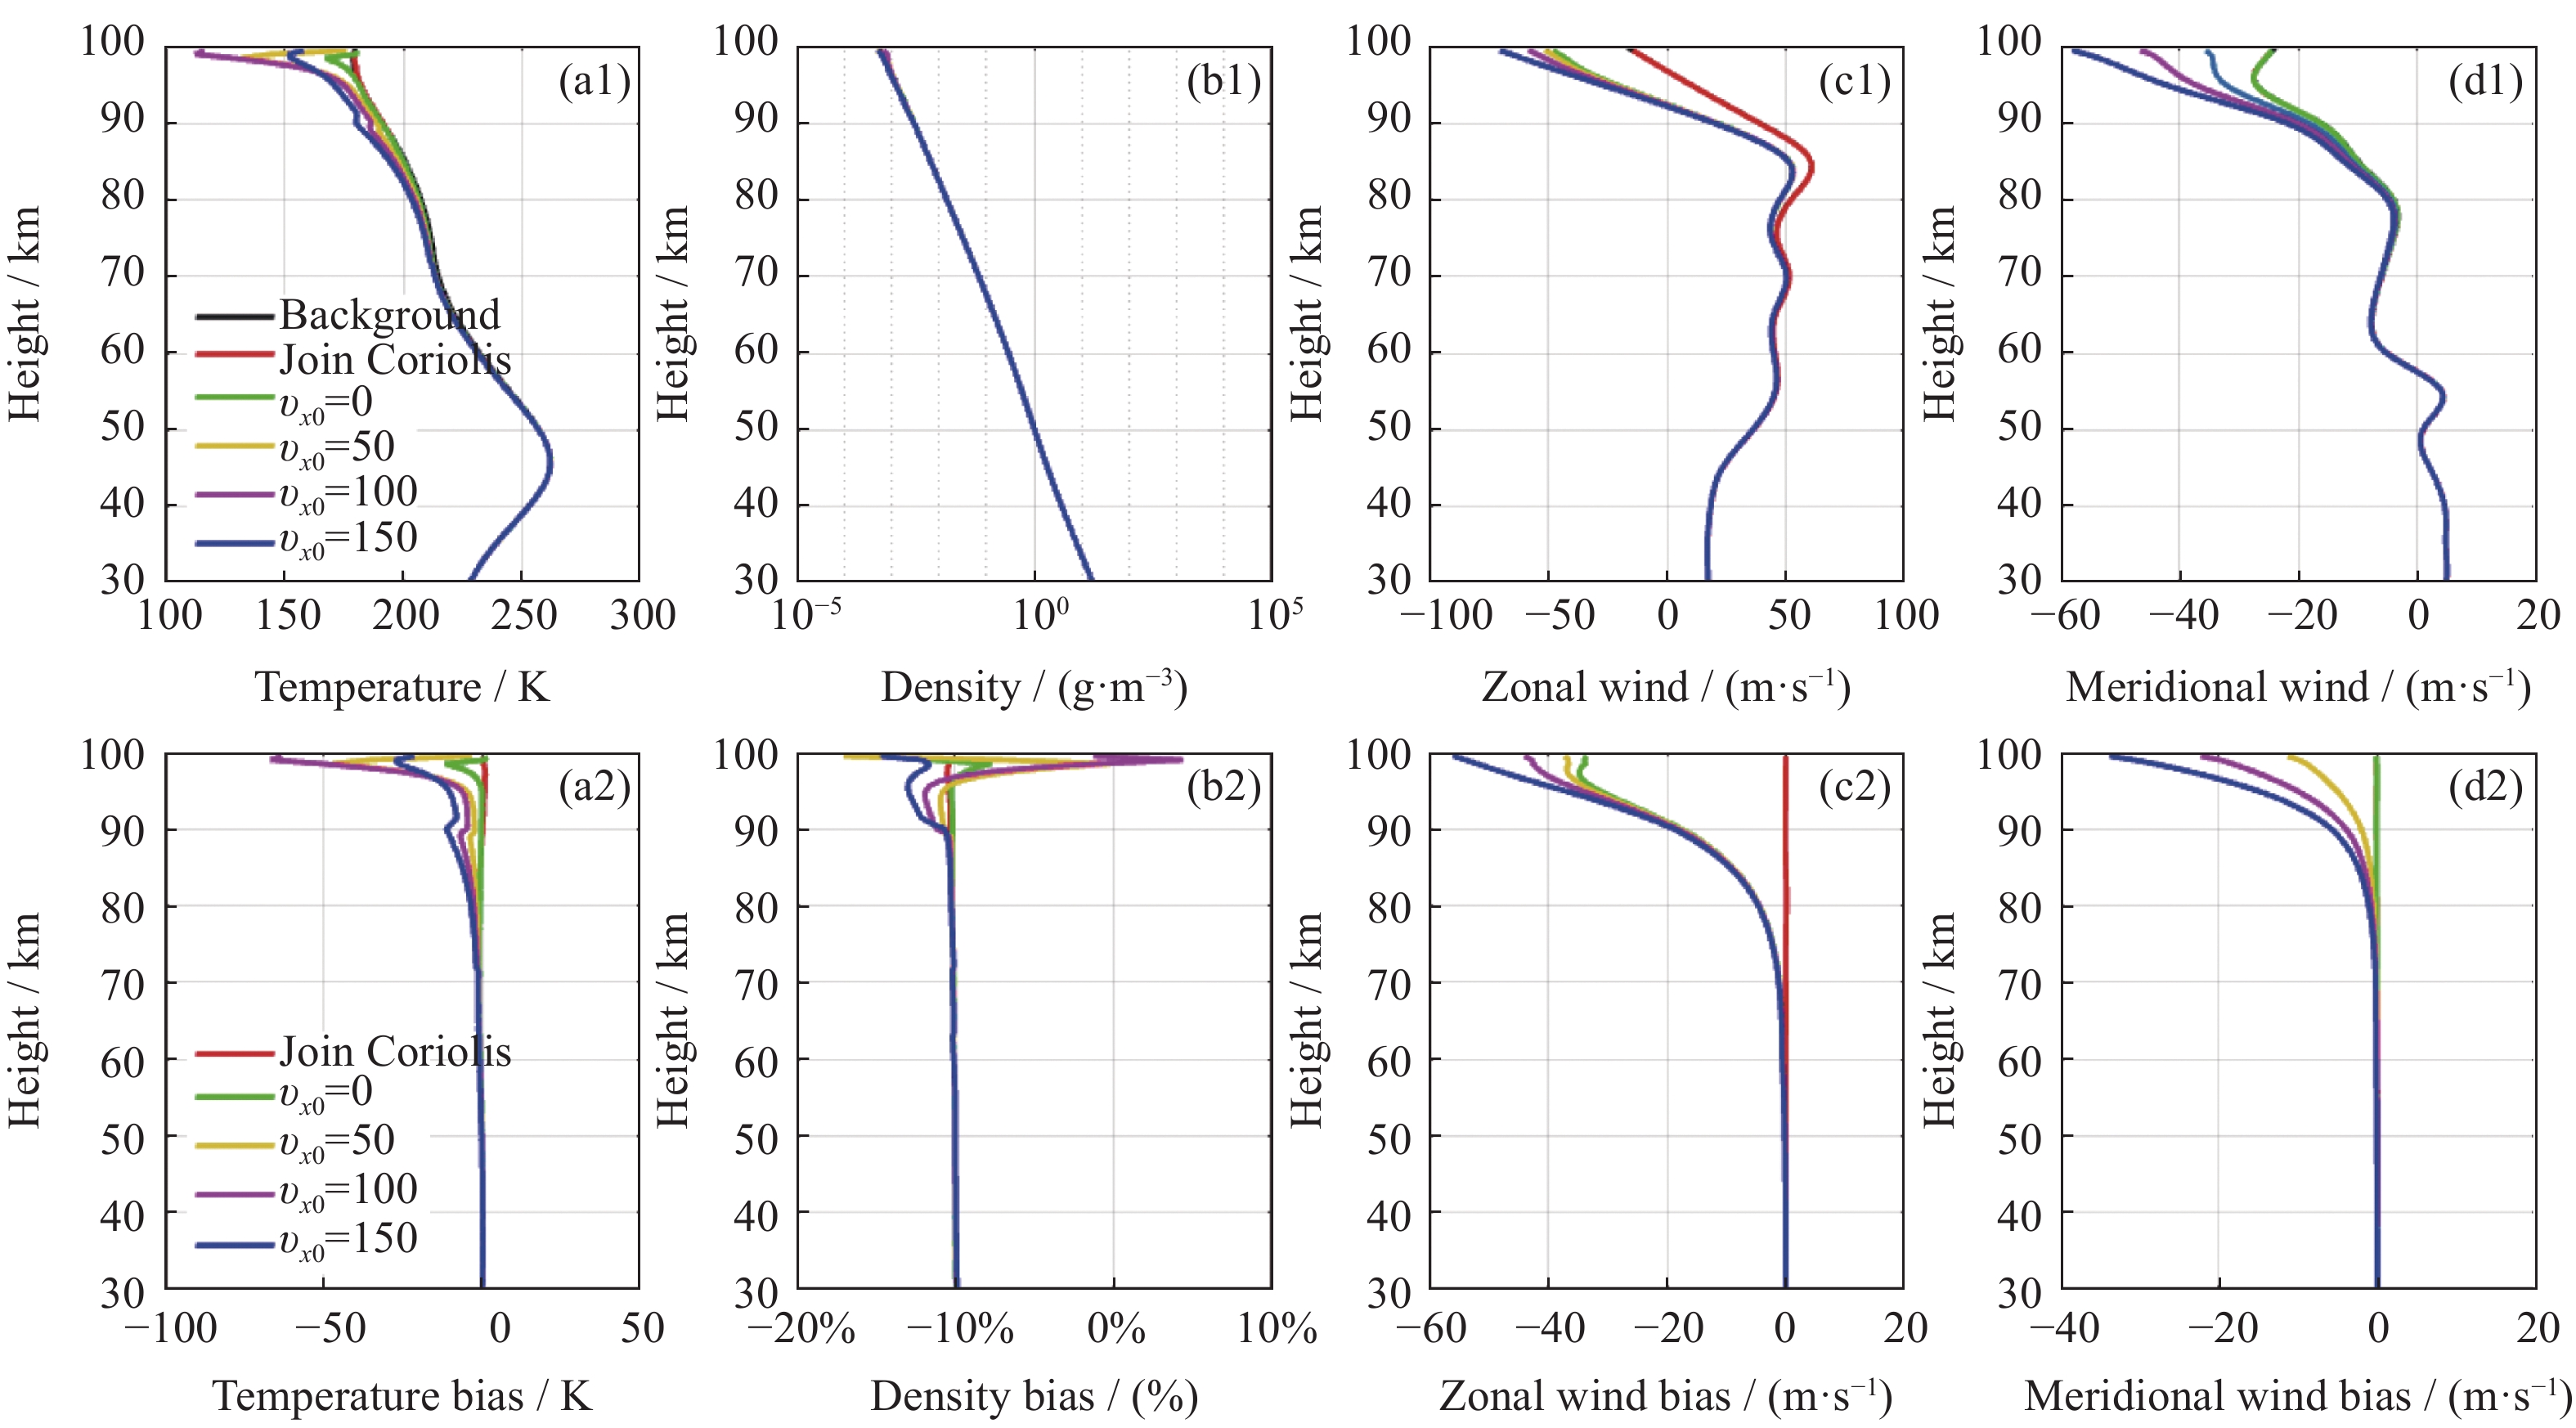
$ {v_{{x_0}}} $ 条件下忽略科氏力项大气参数反演结果及误差廓线Figure 9. Atmospheric parameter inversion results and error profiles when the Coriolis force term is ignored for different
$ {v_{{x_0}}} $ 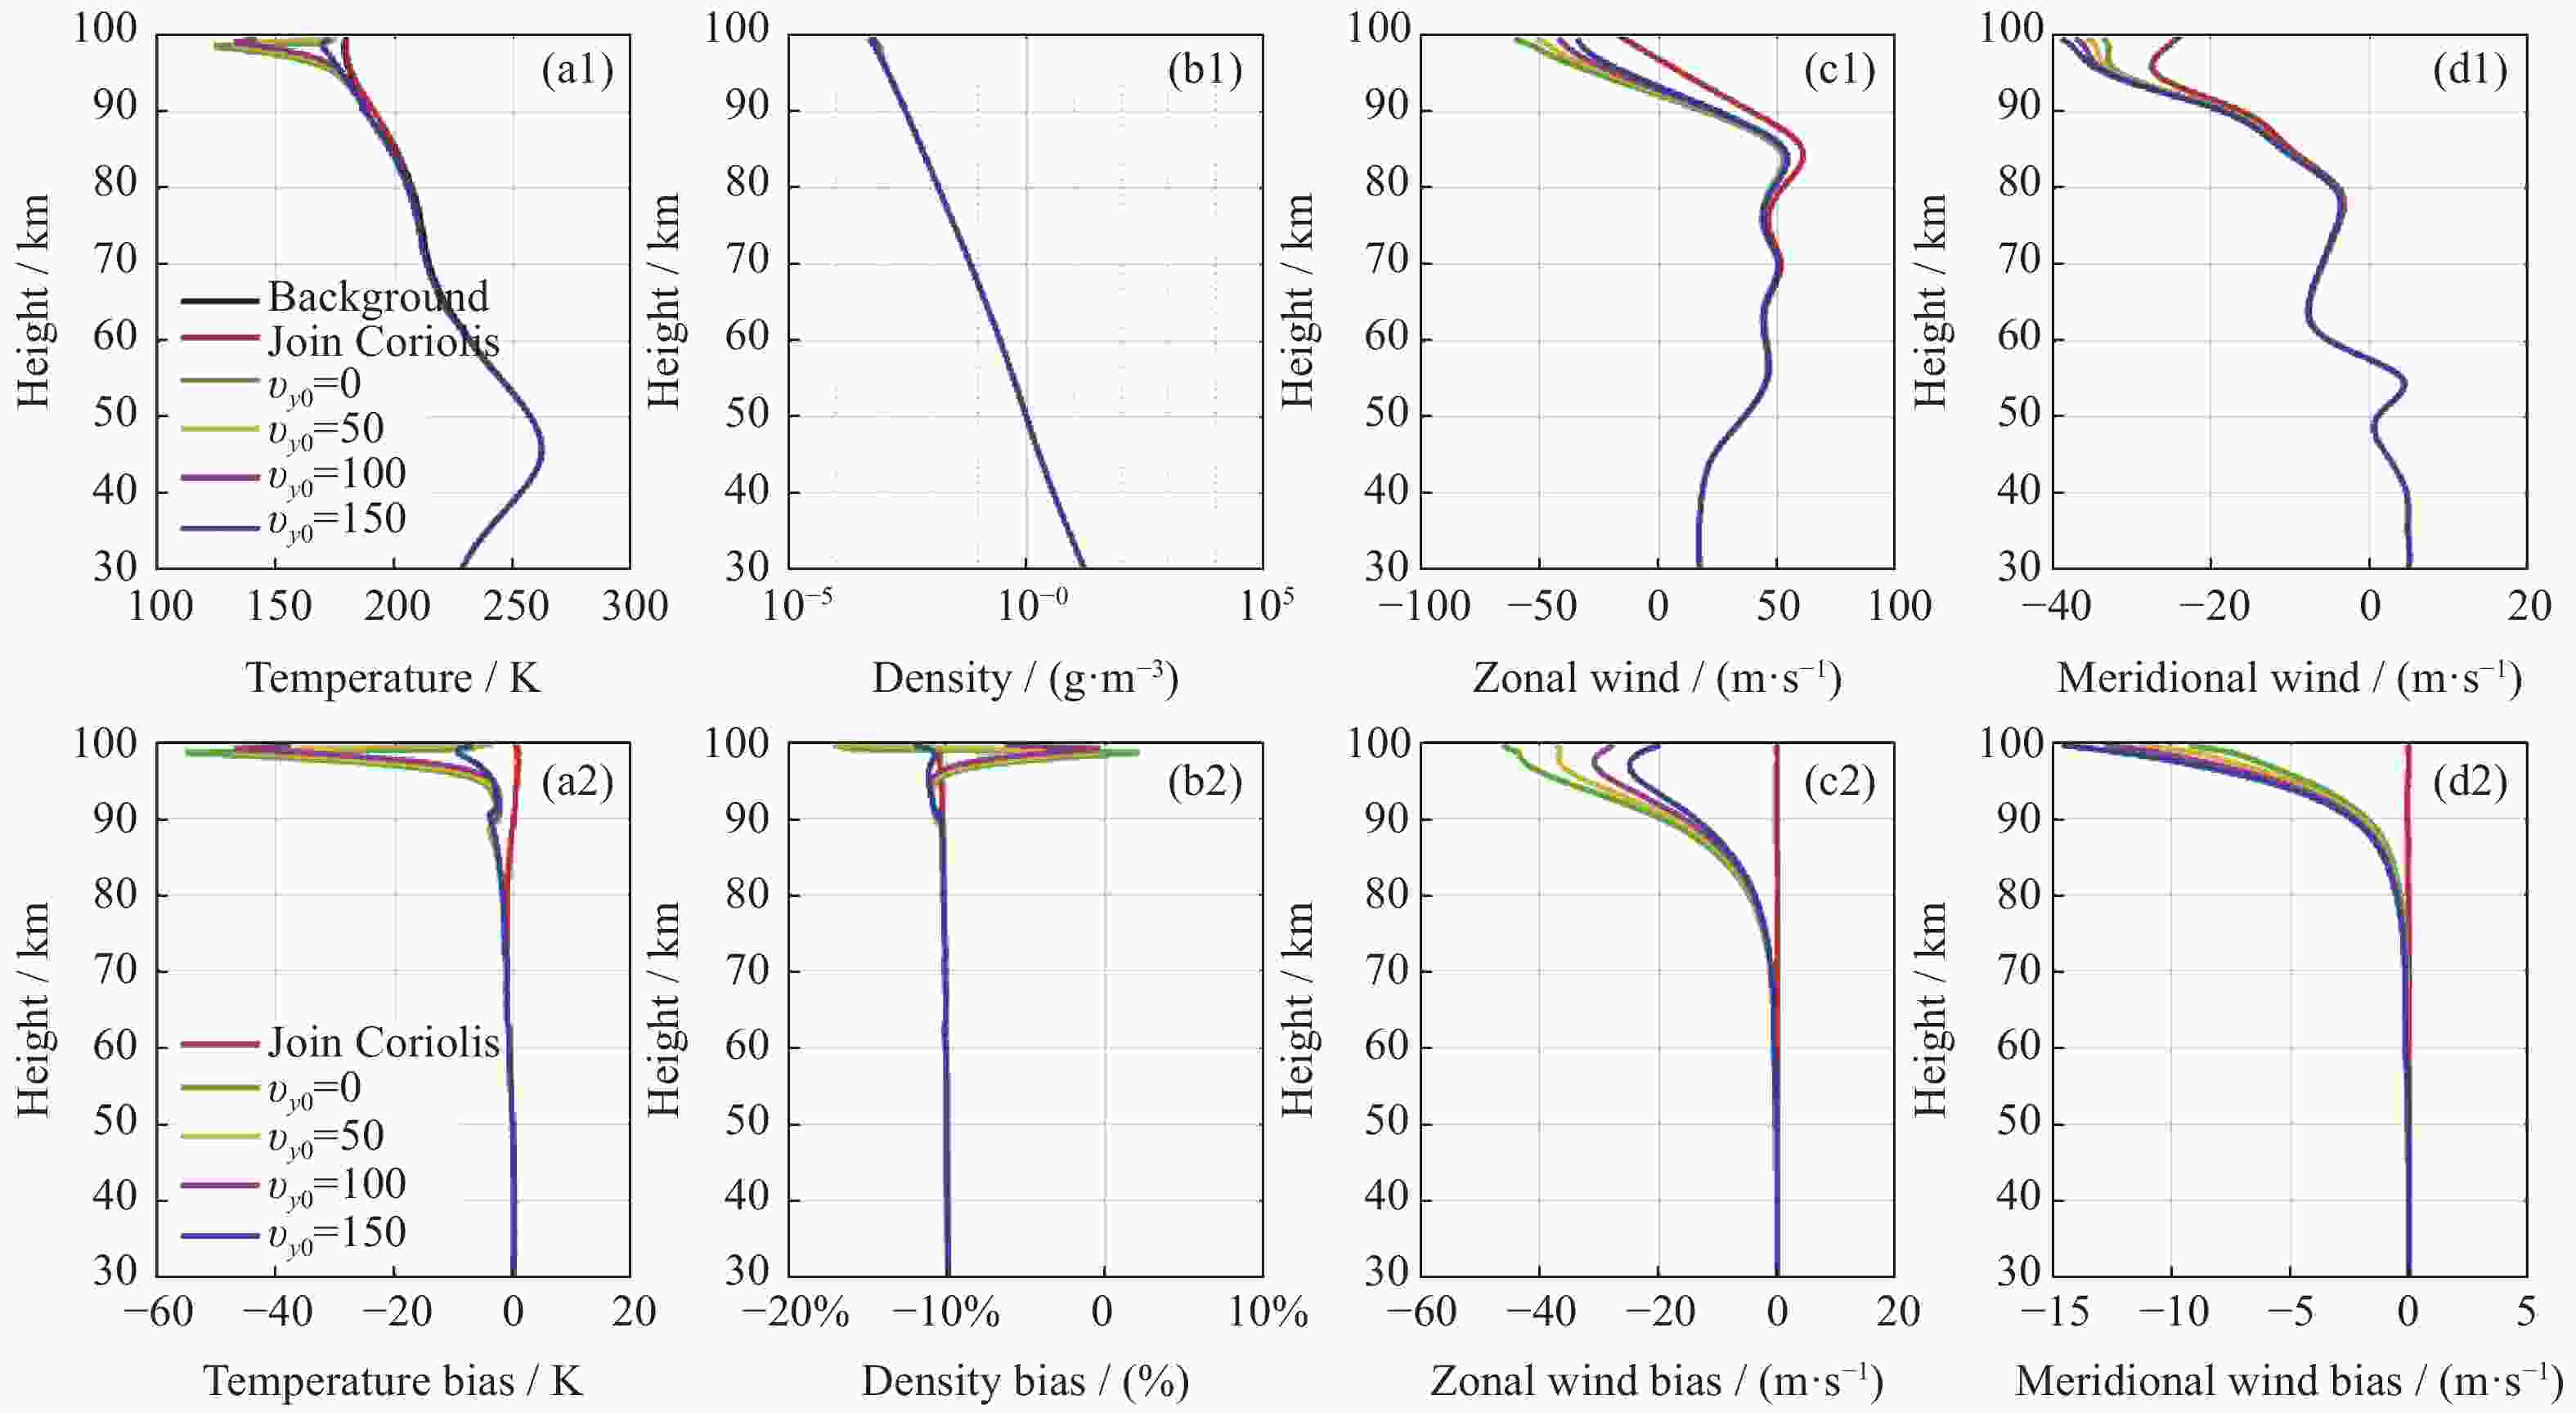
图 10 不同
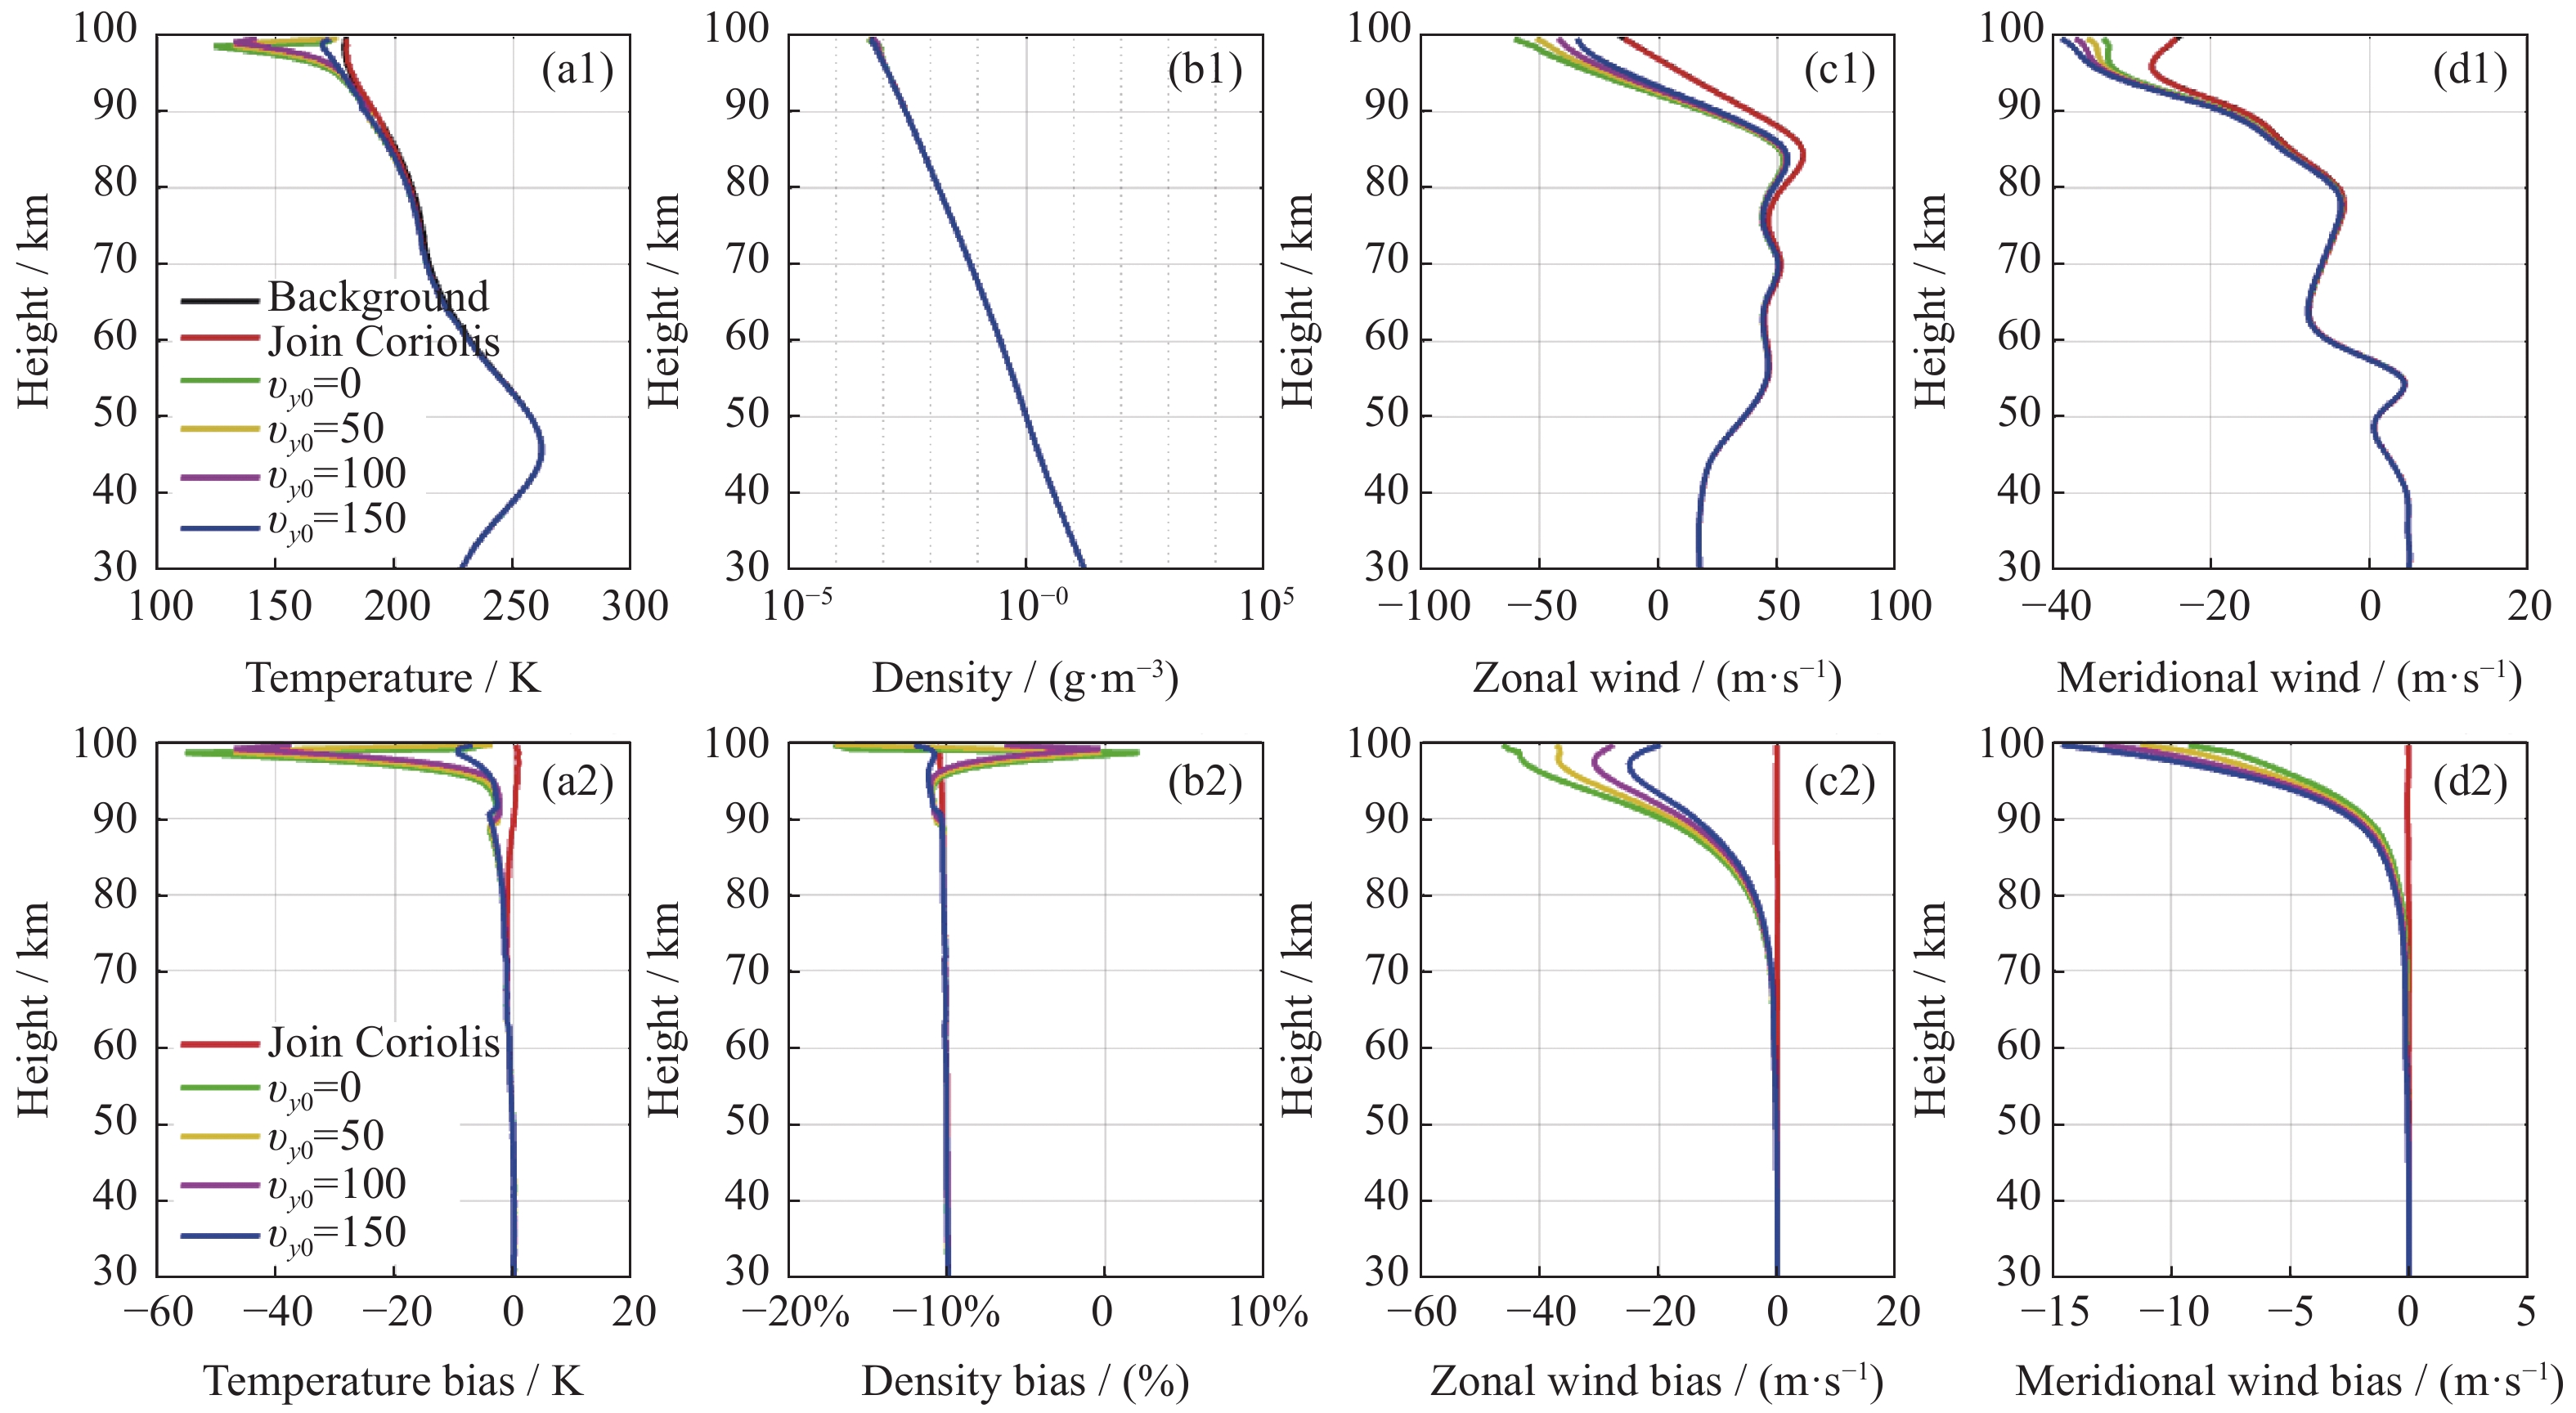
$ {v_{{y_0}}} $ 条件下忽略科氏力项大气参数反演结果及误差廓线Figure 10. Atmospheric parameter inversion results and error profiles when the Coriolis force term is ignored for different
$ {v_{{y_0}}} $ 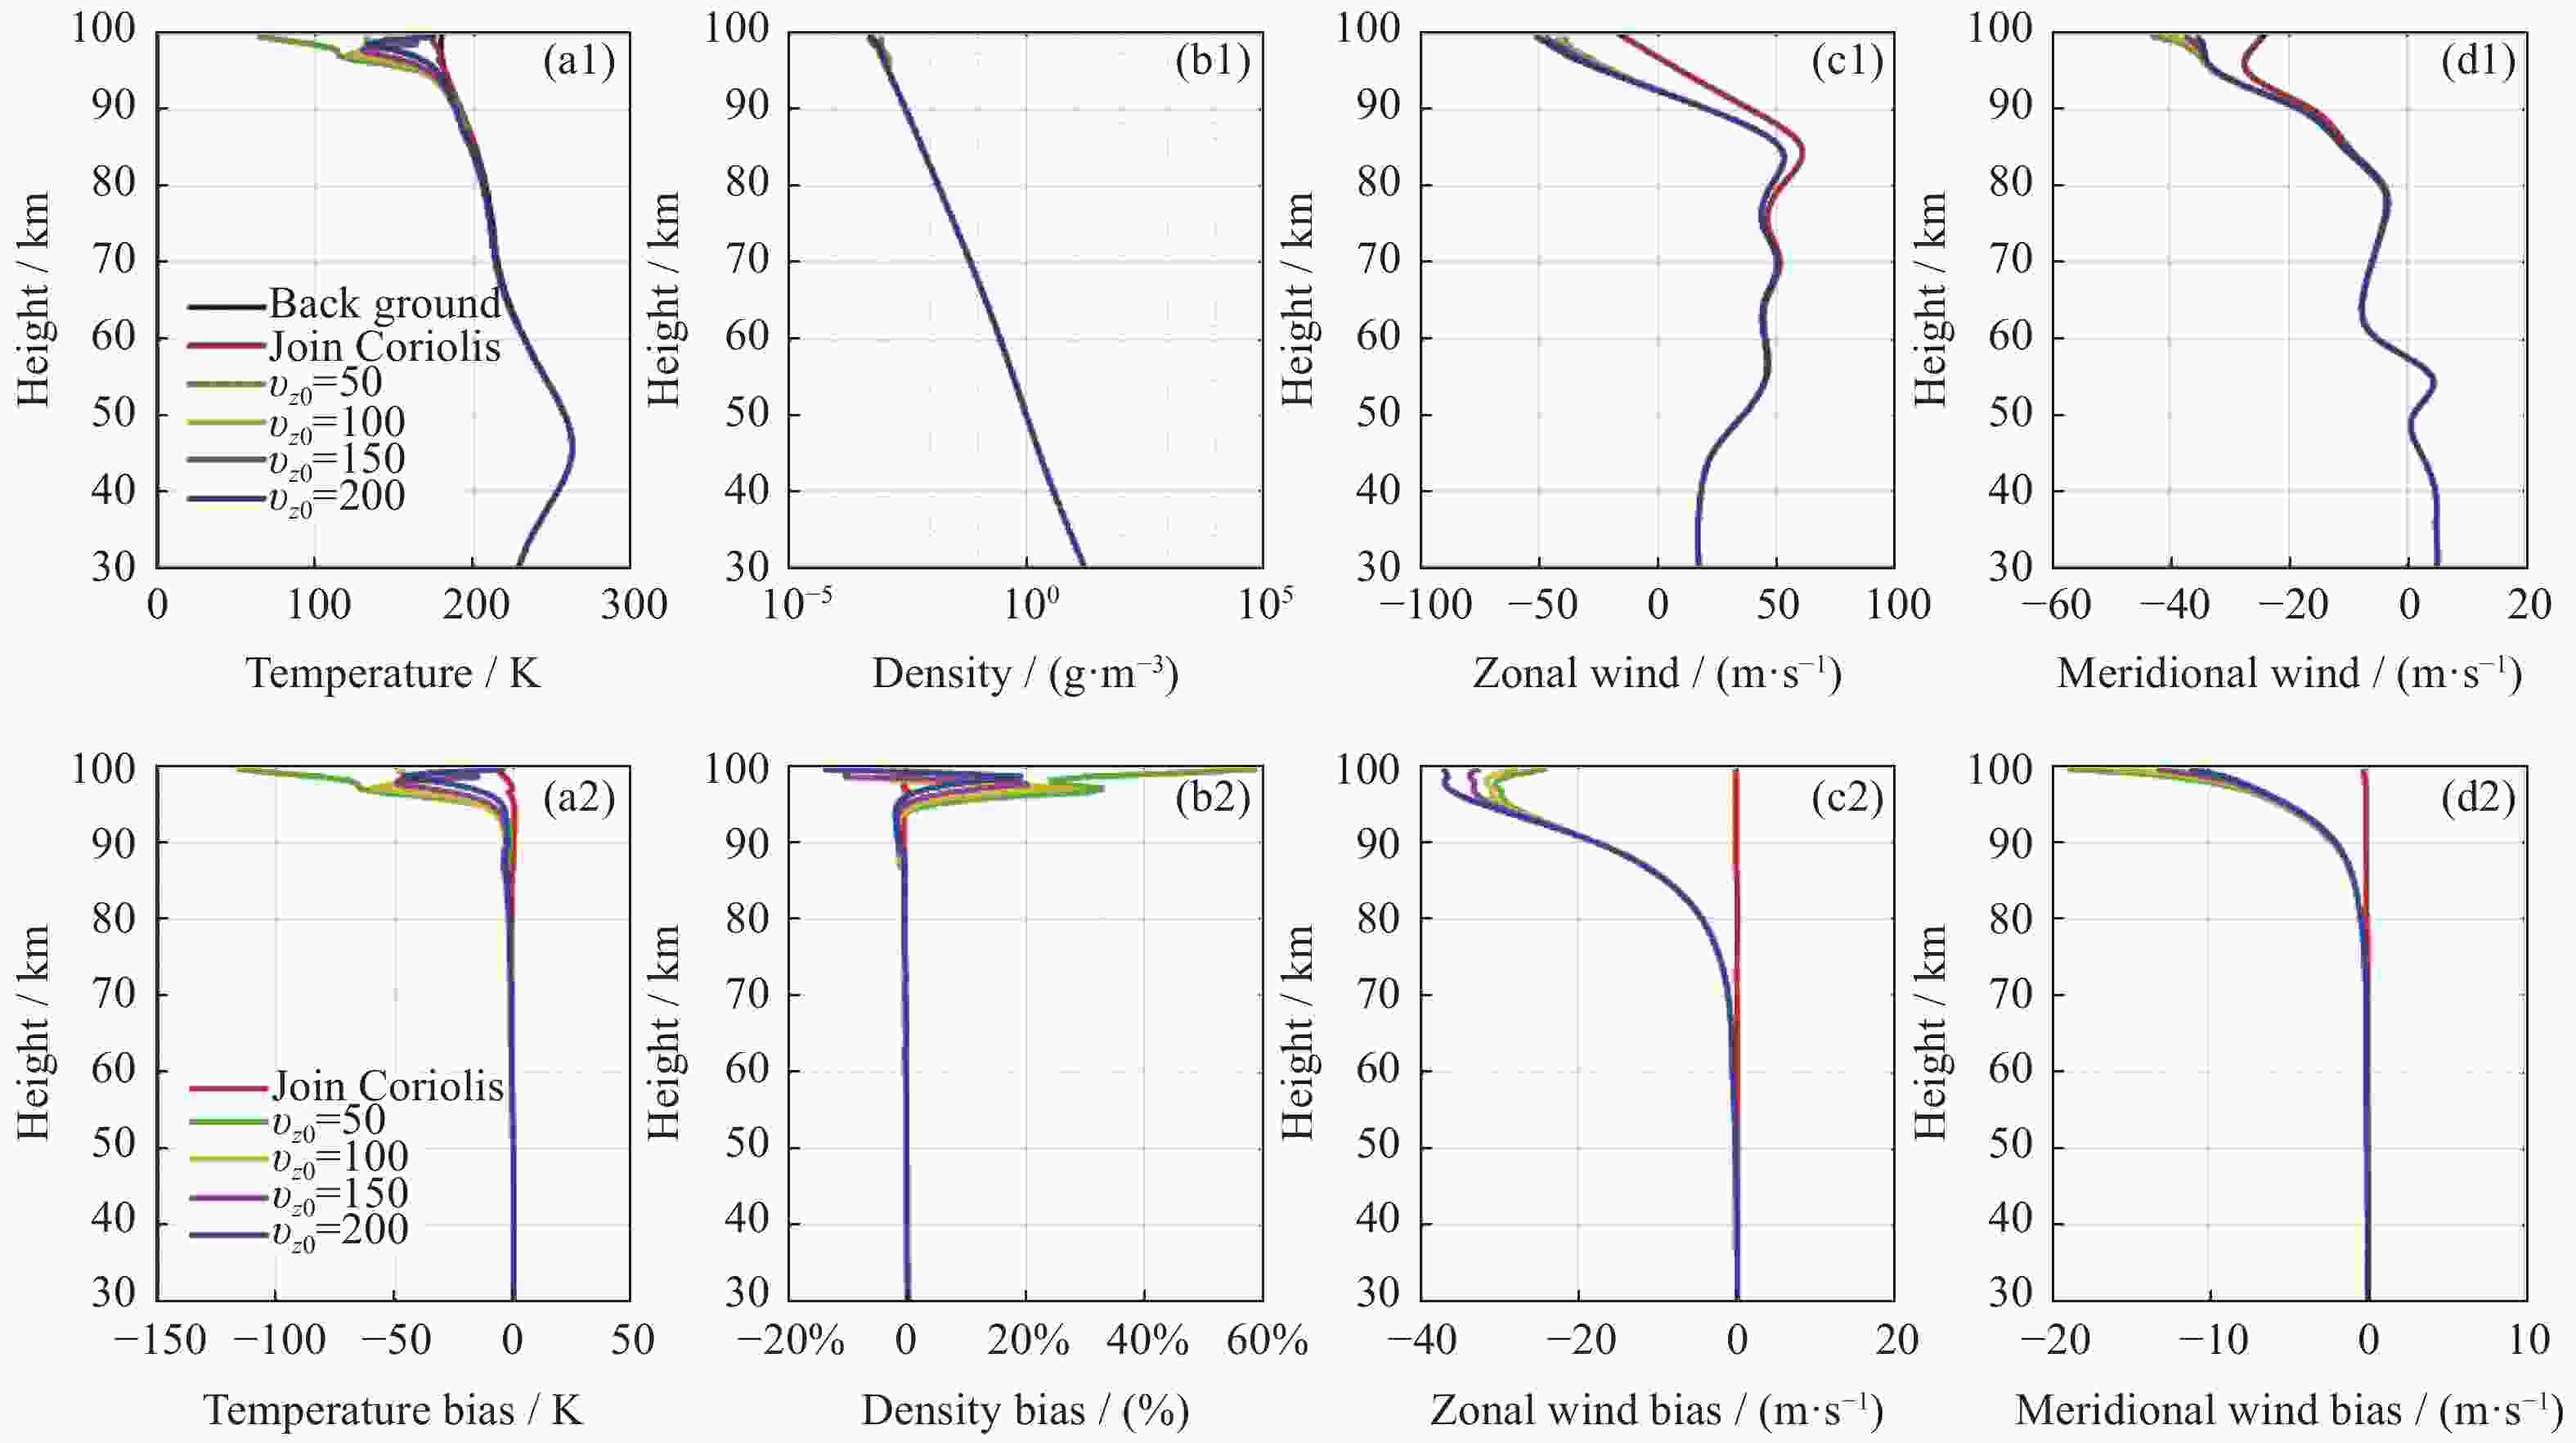
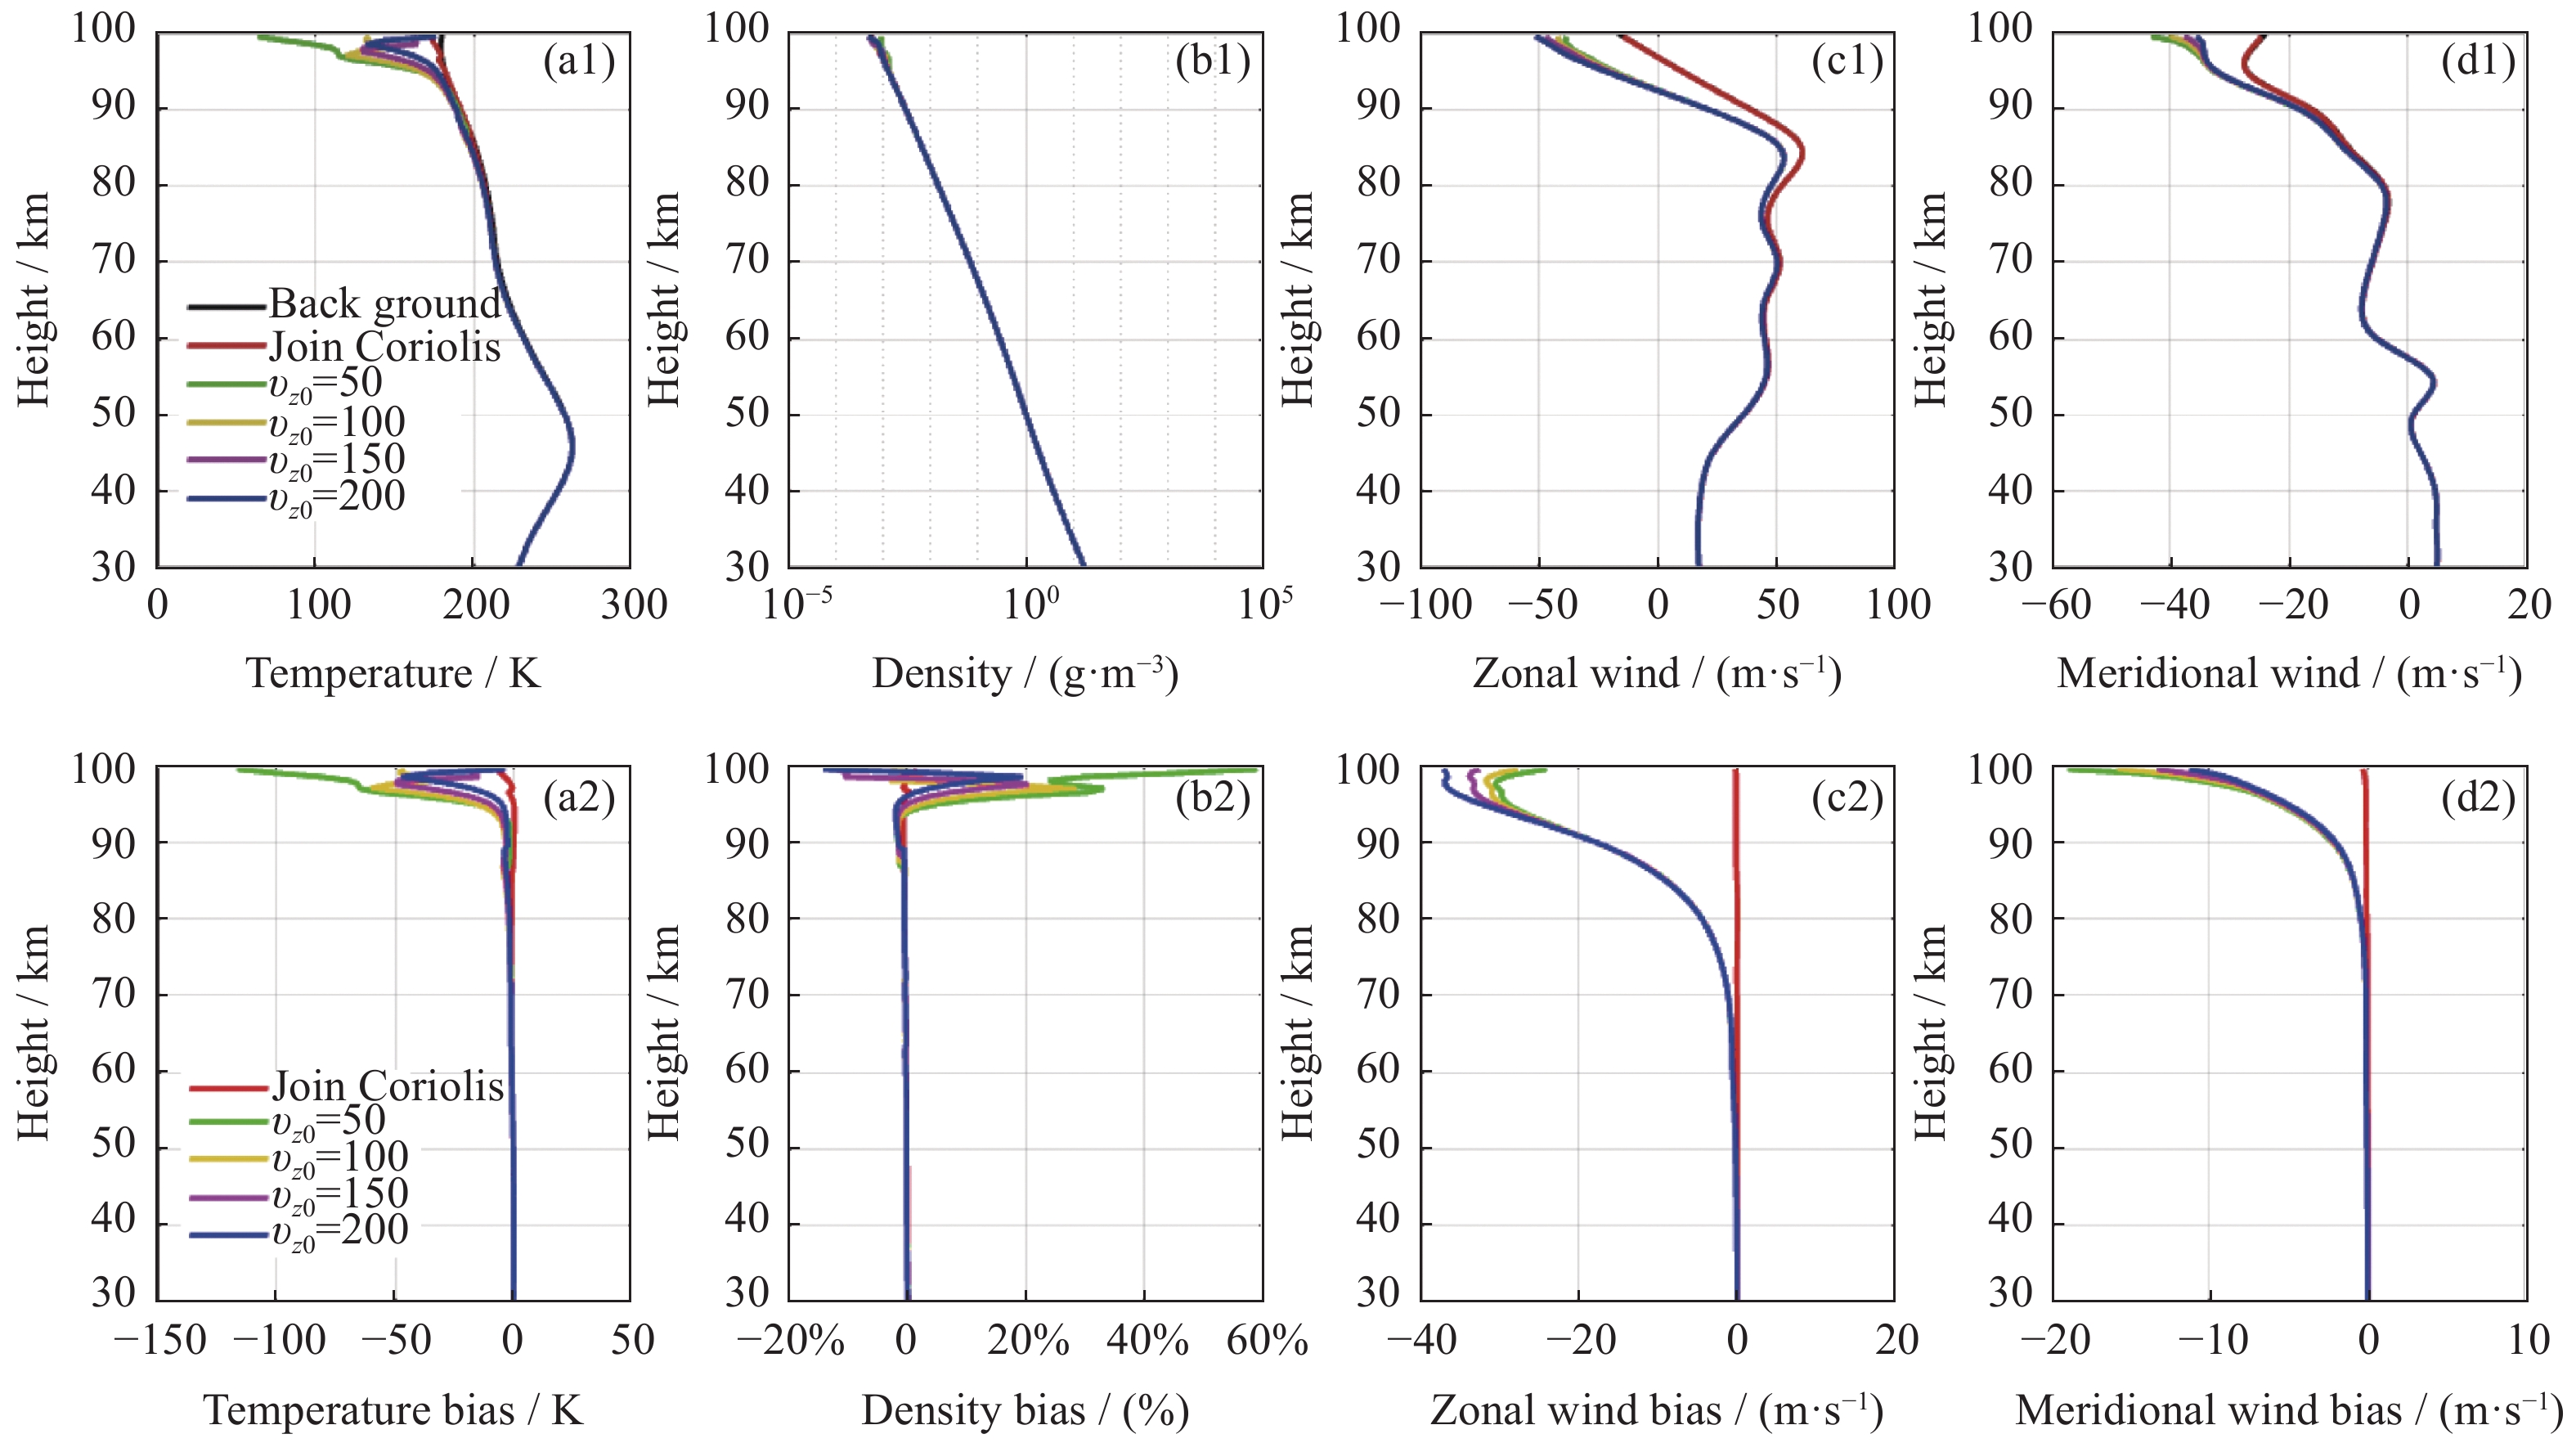
图 11 不同
$ {v_{{z_0}}} $ 条件下忽略科氏力项大气参数反演结果及误差廓线Figure 11. Fig.11 Atmospheric parameter inversion results and error profiles when the Coriolis force term is ignored for different
$ {v_{{z_0}}} $ 表 1 模型验证的初始参数设置
Table 1. Initial parameter settings for model verifications
球体参数 坐标系原点 初始位置/km 初始速度/(m·s–1) 直径/m 质量/g 经度 纬度 x0 y0 z0 vx vy vz 1.003 275.3 86°E 41°N 48.6 –1.8 99.3 243.6 –16.3 307.1  下载: 导出CSV
表 2 初始参数设置
Table 2. Initial parameter schemes
方案 球体参数 坐标系
原点初始位置/
km初始速度/
(m·s–1)直径/m 质量/g 经度 纬度 x0 y0 z0 $ {v_{{x_0}}} $ $ {v_{{y_0}}} $ $ {v_{{z_0}}} $ 方案一 1 300 86°E 变量 0 0 100 50 50 200 方案二 1 300 86°E 40°N 0 0 100 变量 50 200 方案三 1 300 86°E 40°N 0 0 100 50 变量 200 方案四 1 300 86°E 40°N 0 0 100 50 50 变量
下载: 导出CSV
表 3 不同纬度条件下忽略科氏力项时的大气参数反演误差
Table 3. Atmospheric parameter errors when the Coriolis force term is ignored for different latitudes
大气
参数考虑
科氏力纬度/(°)N 高度/
km0 20 40 60 80 温度
误差/
K0.07 0.07 0.07 0.07 0.08 0.08 30 –1.02 –1.17 –1.16 –1.14 –1.10 –1.05 70 –0.64 –3.30 –3.14 –2.67 –1.99 –1.20 85 0.65 –6.56 –6.19 –5.13 –3.34 –0.83 95 密度
误差/
(%)0.29 0.21 0.21 0.22 0.23 0.24 30 –0.14 –0.20 –0.20 –0.19 –0.18 –0.16 70 –0.43 –0.35 –0.36 –0.38 –0.41 –0.43 85 –0.66 –1.82 –1.71 –1.42 –1.09 –0.88 95 纬向风
误差/
(m·s–1)0.00 –0.02 –0.01 –0.01 –0.01 0.00 30 –0.01 –1.52 –1.41 –1.12 –0.70 –0.20 70 –0.04 –12.71 –11.59 –9.07 –5.46 –1.21 85 –0.09 –47.70 –42.63 –32.40 –18.32 –2.18 95 经向风
误差/
(m·s–1)0.00 0.00 0.00 –0.01 –0.01 –0.01 30 –0.02 –0.03 –0.08 –0.12 –0.16 –0.18 70 –0.07 –0.18 –0.56 –0.88 –1.11 –1.22 85 –0.10 –1.41 –3.47 –5.13 –6.18 –6.49 95
下载: 导出CSV
表 4 不同
$ {v_{{x_0}}} $ 条件下忽略科氏力项时的大气参数反演误差Table 4. Atmospheric parameter errors when the Coriolis force term is ignored for different
$ {v_{{x_0}}} $ 大气
参数考虑
科氏力$ {v_{{x_0}}} $/(m·s–1) 高度/
km0 50 100 150 温度
误差/
K0.12 0.12 0.07 0.03 –0.01 30 –1.01 –0.99 –1.14 –1.28 –1.43 70 –0.66 –0.65 –2.67 –4.47 –6.42 85 0.64 –0.18 –5.13 –6.66 –10.64 95 密度
误差/
(%)0.16 0.16 0.22 0.28 0.33 30 –0.16 –0.14 –0.19 –0.24 –0.29 70 –0.45 –0.32 –0.38 –0.49 –0.59 85 –0.72 –0.46 –1.42 –3.64 –5.87 95 纬向风
误差/
(m·s–1)0.00 –0.01 –0.01 –0.01 –0.01 30 0.02 –1.09 –1.12 –1.15 –1.19 70 0.00 –8.99 –9.07 –9.24 –9.50 85 –0.05 –31.48 –32.40 –34.39 –37.39 95 经向风
误差/
(m·s–1)0.00 –0.01 –0.01 –0.01 –0.01 30 –0.02 –0.07 –0.12 –0.18 –0.23 70 –0.07 –0.09 –0.88 –1.66 –2.42 85 –0.10 –0.05 –5.13 –10.23 –15.23 95
下载: 导出CSV
表 5 不同
$ {v_{{y_0}}} $ 条件下忽略科氏力项时的大气参数反演误差Table 5. Atmospheric parameter errors when the Coriolis force term is ignored for different
$ {v_{{y_0}}} $ 大气
参数考虑
科氏力$ {v_{{y_0}}} $/(m·s–1) 高度/
km0 50 100 150 温度
误差/
K0.09 0.09 0.07 0.06 0.05 30 –1.02 –1.14 –1.14 –1.13 –1.14 70 –0.66 –2.77 –2.67 –2.50 –2.55 85 0.64 –6.17 –5.13 –3.63 –3.52 95 密度
误差/
(%)0.26 0.20 0.22 0.24 0.25 30 –0.14 –0.19 –0.19 –0.19 –0.19 70 –0.43 –0.36 –0.38 –0.41 –0.44 85 –0.70 –1.09 –1.42 –1.85 –2.29 95 纬向风
误差/
(m·s–1)0.00 –0.01 –0.01 –0.01 –0.01 30 –0.01 –1.18 –1.12 –1.06 –1.00 70 –0.04 –9.80 –9.07 –8.30 –7.51 85 –0.11 –36.78 –32.40 –27.87 –23.29 95 经向风
误差/
(m·s–1)0.00 –0.01 –0.01 –0.01 –0.01 30 0.01 –0.09 –0.12 –0.15 –0.18 70 –0.03 –0.76 –0.88 –0.98 –1.09 85 –0.04 –4.45 –5.13 –5.76 –6.32 95
下载: 导出CSV
表 6 不同
$ {v_{{z_0}}} $ 条件下忽略科氏力项时的大气参数反演误差Table 6. Atmospheric parameter errors when the Coriolis force term is ignored for different
$ {v_{{z_0}}} $ 大气
参数考虑
科氏力$ {v_{{z_0}}} $/(m·s–1) 高度/
km50 100 150 200 温度
误差/
K0.06 0.06 0.07 0.07 0.07 30 –1.01 –1.12 –1.15 –1.15 –1.14 70 –0.74 –2.86 –3.58 –3.21 –2.67 85 0.07 –17.00 –16.40 –10.26 –5.13 95 密度
误差/
(%)0.29 0.23 0.23 0.22 0.22 30 –0.16 –0.21 –0.21 –0.20 –0.19 70 –0.40 –0.28 –0.25 –0.31 –0.38 85 –0.42 5.51 3.00 0.28 –1.42 95 纬向风
误差/
(m·s–1)0.00 –0.01 –0.01 –0.01 –0.01 30 –0.01 –1.14 –1.14 –1.13 –1.12 70 –0.03 –8.86 –8.91 –8.98 –9.07 85 –0.10 –28.98 –29.77 –30.96 –32.40 95 经向风
误差/
(m·s–1)0.00 –0.01 –0.01 –0.01 –0.01 30 –0.02 –0.13 –0.13 –0.13 –0.12 70 –0.07 –0.91 –0.90 –0.89 –0.88 85 –0.12 –5.65 –5.53 –5.36 –5.13 95
下载: 导出CSV
-
[1] WAN Mingjie. Ten major threats to national aerospace defense[J]. National Defense Technology, 2019, 40(5): 1-5 [2] LV Daren, CHEN Zeyu, GUO Xia, et al. Recent progress in near space atmospheric environment study[J]. Advances in Mechanics, 2009, 39(6): 674-682 doi: 10.3321/j.issn:1000-0992.2009.06.008 [3] 朱家佳, 米琳, 李晓辉, 等. 临近空间科学探测数据的共享与实践[J]. 空间科学学报, 2021, 41(5): 828-835ZHU Jiajia, MI Lin, LI Xiaohui, et al. Near space scientific exploratory data sharing research and practice[J]. Chinese Journal of Space Science, 2021, 41(5): 828-835 [4] 郜颖哲, 刘晓, 徐寄遥. 基于激光雷达夜间观测提取重力波方法的定量比较[J]. 空间科学学报, 2021, 41(4): 597-608GAO Yingzhe, LIU Xiao, XU Jiyao. Quantitative estimations on the gravity wave extraction methods from night-time Lidar observation[J]. Chinese Journal of Space Science, 2021, 41(4): 597-608 [5] 杨钧烽, 肖存英, 胡雄, 等. 中国廊坊中间层和低热层大气平均风观测模拟[J]. 空间科学学报, 2017, 37(3): 284-290 doi: 10.11728/cjss2017.03.284YANG Junfeng, XIAO Cunying, HU Xiong, et al. Observations and simulations of the mean winds in mesosphere and lower thermosphere over Langfang of China[J]. Chinese Journal of Space Science, 2017, 37(3): 284-290 doi: 10.11728/cjss2017.03.284 [6] 谢衍新, 肖存英, 胡雄, 等. TIMED/SABER与AURA/MLS临近空间探测温度数据比较[J]. 空间科学学报, 2018, 38(3): 361-367 doi: 10.11728/cjss2018.03.361XIE Yanxin, XIAO Cunying, HU Xiong, et al. Comparison between temperature data of TIMED/SABER and AURA/MLS[J]. Chinese Journal of Space Science, 2018, 38(3): 361-367 doi: 10.11728/cjss2018.03.361 [7] 杜晓勇, 杜智涛, 郭粤宁, 等. 利用掩星温度数据推算大气月平均纬向风场[J]. 空间科学学报, 2020, 40(6): 1030-1038 doi: 10.11728/cjss2020.06.1030DU Xiaoyong, DU Zhitao, GUO Yuening, et al. Research of monthly zonal winds derived from radio occultation temperature data[J]. Chinese Journal of Space Science, 2020, 40(6): 1030-1038 doi: 10.11728/cjss2020.06.1030 [8] SHENG Zheng, ZHOU Shudao, GE Wei, et al. Gravity wave in near space by falling-sphere detection[J]. Equipment Environmental Engineering, 2019, 16(6): 21-24 [9] BARTMAN F L, CHANEY L W, JONES L M, et al. Upper-air density and temperature by the falling-sphere method[J]. Journal of Applied Physics, 1956, 27(7): 706-712 doi: 10.1063/1.1722470 [10] OTTERMAN J, SATTINGER I J, SMITH D F. Analysis of a falling-sphere experiment for measurement of upper-atmosphere density and wind velocity[J]. Journal of Geophysical Research, 1961, 66(3): 819-822 doi: 10.1029/JZ066i003p00819 [11] FAUCHER G A, PROCUNIER R W, SHERMAN F S. Upper-atmosphere density obtained from measurements of drag on a falling sphere[J]. Journal of Geophysical Research, 1963, 68(11): 3437-3450 doi: 10.1029/JZ068i011p03437 [12] LÜBKEN F J, HILLERT W, LEHMACHER G, et al. Intercomparison of density and temperature profiles obtained by Lidar, ionization gauges, falling spheres, datasondes and radiosondes during the DYANA campaign[J]. Journal of Atmospheric and Terrestrial Physics, 1994, 56(13/14): 1969-1984 [13] SCHMIDLIN F J, LEE H S, MICHEL W. The inflatable sphere: a technique for the accurate measurement of middle atmosphere temperatures[J]. Journal of Geophysical Research:Atmospheres, 1991, 96(D12): 22673-22682 doi: 10.1029/91JD02395 [14] BORDOGNA M T, FIDJELAND L, FJÄLLID M, et al. MUSCAT experiment: active free falling units for in situ measurements of temperature and density in the middle atmosphere[C]//Proc. 21 st ESA Symposium European Rocket & Balloon Programmes and Related Research. Thun, Swizerland: ESA, 2013, 350: 575-582 [15] JIANG Xiujie, LIU Bo, YU Shiqiang, et al. Development status and trend of sounding rocket[J]. Science & Technology Review, 2009, 27(23): 101-110 doi: 10.3321/j.issn:1000-7857.2009.23.021 [16] SHI Dongbo, HU Xiong, TU Cui, et al. Near space environment detection technology- sounding rocket falling sphere[J]. Equipment Environmental Engineering, 2018, 15(7): 89-92 [17] GE W, SHENG Z, ZHANG Y Y, et al. The study of in situ wind and gravity wave determination by the first passive falling-sphere experiment in China's northwest region[J]. Journal of Atmospheric and Solar-Terrestrial Physics, 2019, 182: 130-137 doi: 10.1016/j.jastp.2018.11.015 [18] China Meteorological Administration Climate Monitoring Application Management Division. Guide to Meteorological Instruments and Methods of Observation (5 ed. )[M]. Beijing: Meteorological Press, 1992 [19] PICONE J M, HEDIN A E, DROB D P, et al. NRLMSISE-00 empirical model of the atmosphere: statistical comparisons and scientific issues[J]. Journal of Geophysical Research: Space Physics, 2002, 107(A12): 1468 [20] DROB D P, EMMERT J T, CROWLEY G, et al. An empirical model of the Earth’s horizontal wind fields: HWM07[J]. Journal of Geophysical Research:Space Physics, 2008, 113(A12): A12304 [21] HENDERSON C B. Drag coefficients of spheres in continuum and rarefied flows[J]. AIAA Journal, 1976, 14(6): 707-708 doi: 10.2514/3.61409 [22] SHENG Peixuan, MAO Jietai, LI Jianguo, et al. Atmospheric Physics[M]. 2 nd ed. Beijing: Peking University Press, 2013 -

 下载:
下载:


 点击查看大图
计量
- 文章访问数: 308
- HTML全文浏览量: 153
- PDF下载量: 22
- 被引次数: 0

