


Quantitative Characterization of Photospheric Magnetic Field in Solar Active Regions
-
摘要: 为有效解决太阳活动区磁场特征量化问题,对所有SOHO卫星MDI磁图预处理后,分割出日面角45°以内的活动区,分析活动区投影面积变形来源,研究建立Cosine面积校正因子,校正活动区面积,构建具有21个特征参数的活动区磁场特征量化指标体系,通过主成分分析法对量化结果计算累积方差,结合活动区10486爆发X17.2级耀斑时的磁场变化定性分析。结果表明:强梯度极性分隔线权重磁场绝对值之和R、极性分隔线长度LPS、 强梯度极性分隔线长度Lsg和强梯度极性分隔线磁场绝对值之和$\phi $PSL能够解释活动区磁场结构变化; 磁场通量绝对值总和$\phi $uns、磁场负通量总和$\phi $–、磁场值代数和$\phi $tot和磁场绝对值之和的平均值$\phi $mean能够解释活动区磁场通量变化。$\phi $PSL为本文新构建特征参数。上述参数可有效监测耀斑爆发前后活动区磁场结构和磁场通量的变化情况,量化结果可作为耀斑、质子事件监测及耀斑预报模型输入,为开展太阳爆发活动监测预警提供技术支撑。Abstract: In order to resolve the quantitative technique of photospheric magnetic field in solar active regions, all SOHO Michelson Doppler Interferometer (MDI) magnetograms from 1996 to 2011 have been used, and all solar active regions located within 45° solar surface angle have been segmented. The projection distortion of magnetogram area have been studied, then the consine factors for area correction have been established, and solar active regions area have been corrected. Based on the photospheric parameters quantified by Ref. [18–20], the index system has been built and improved, and it has been used to quantity characterization of magnetic field. The quantitative result has been analyzed by the Principal Component Analysis (PCA), and magnetic field of active region10486 erupted X17.2 flare has been analyzed. The results show that R, LPS, Lsg and $\phi $PSL can explain the change of magnetic field structure in active region, and $\phi $uns, $\phi $–, $\phi $tot, and $\phi $mean can explain the change of magnetic flux in active region. $\phi $PSL is the new characteristic parameters in this paper. The above parameters can monitor the changes of magnetic field structure and magnetic flux in the active region effectively before and after the flare eruption; the quantitative results could be used as the input of flare, proton event monitoring and flare prediction model, and provided technical support for the monitoring and early warning of solar flare activity.
-
Key words:
- Solar active region /
- Area correction /
- Magnetic field /
- Quantitative index system
-
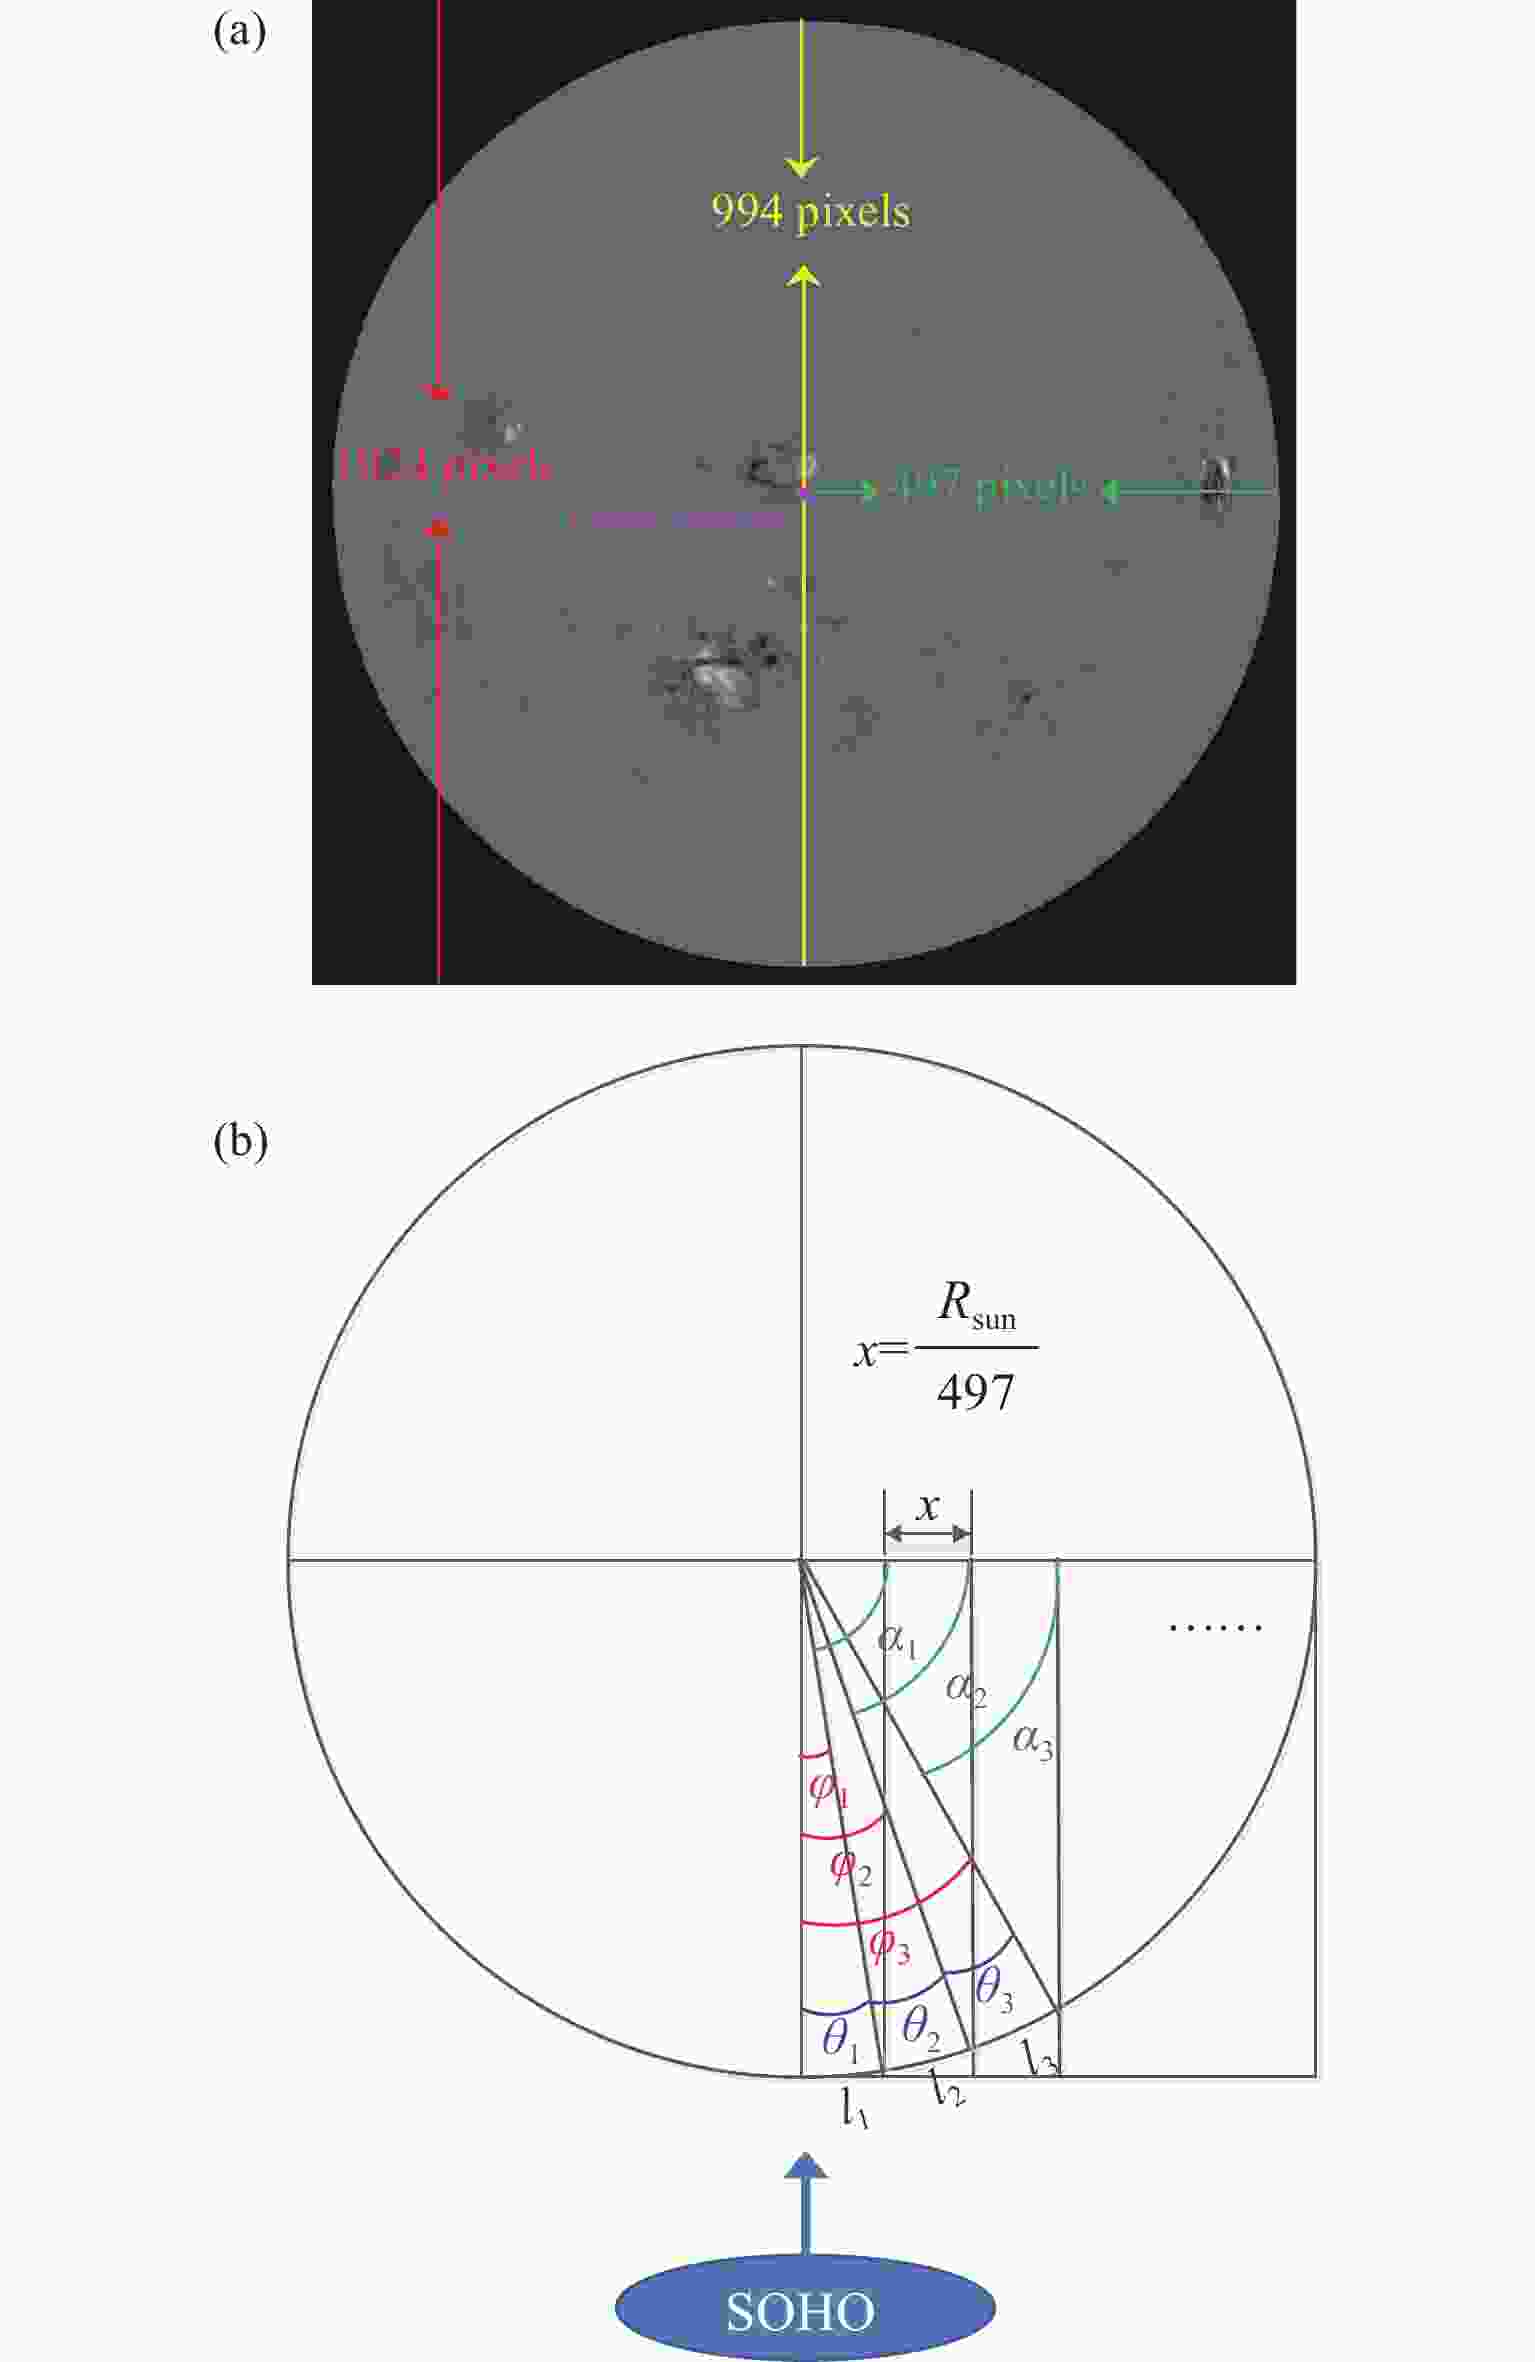
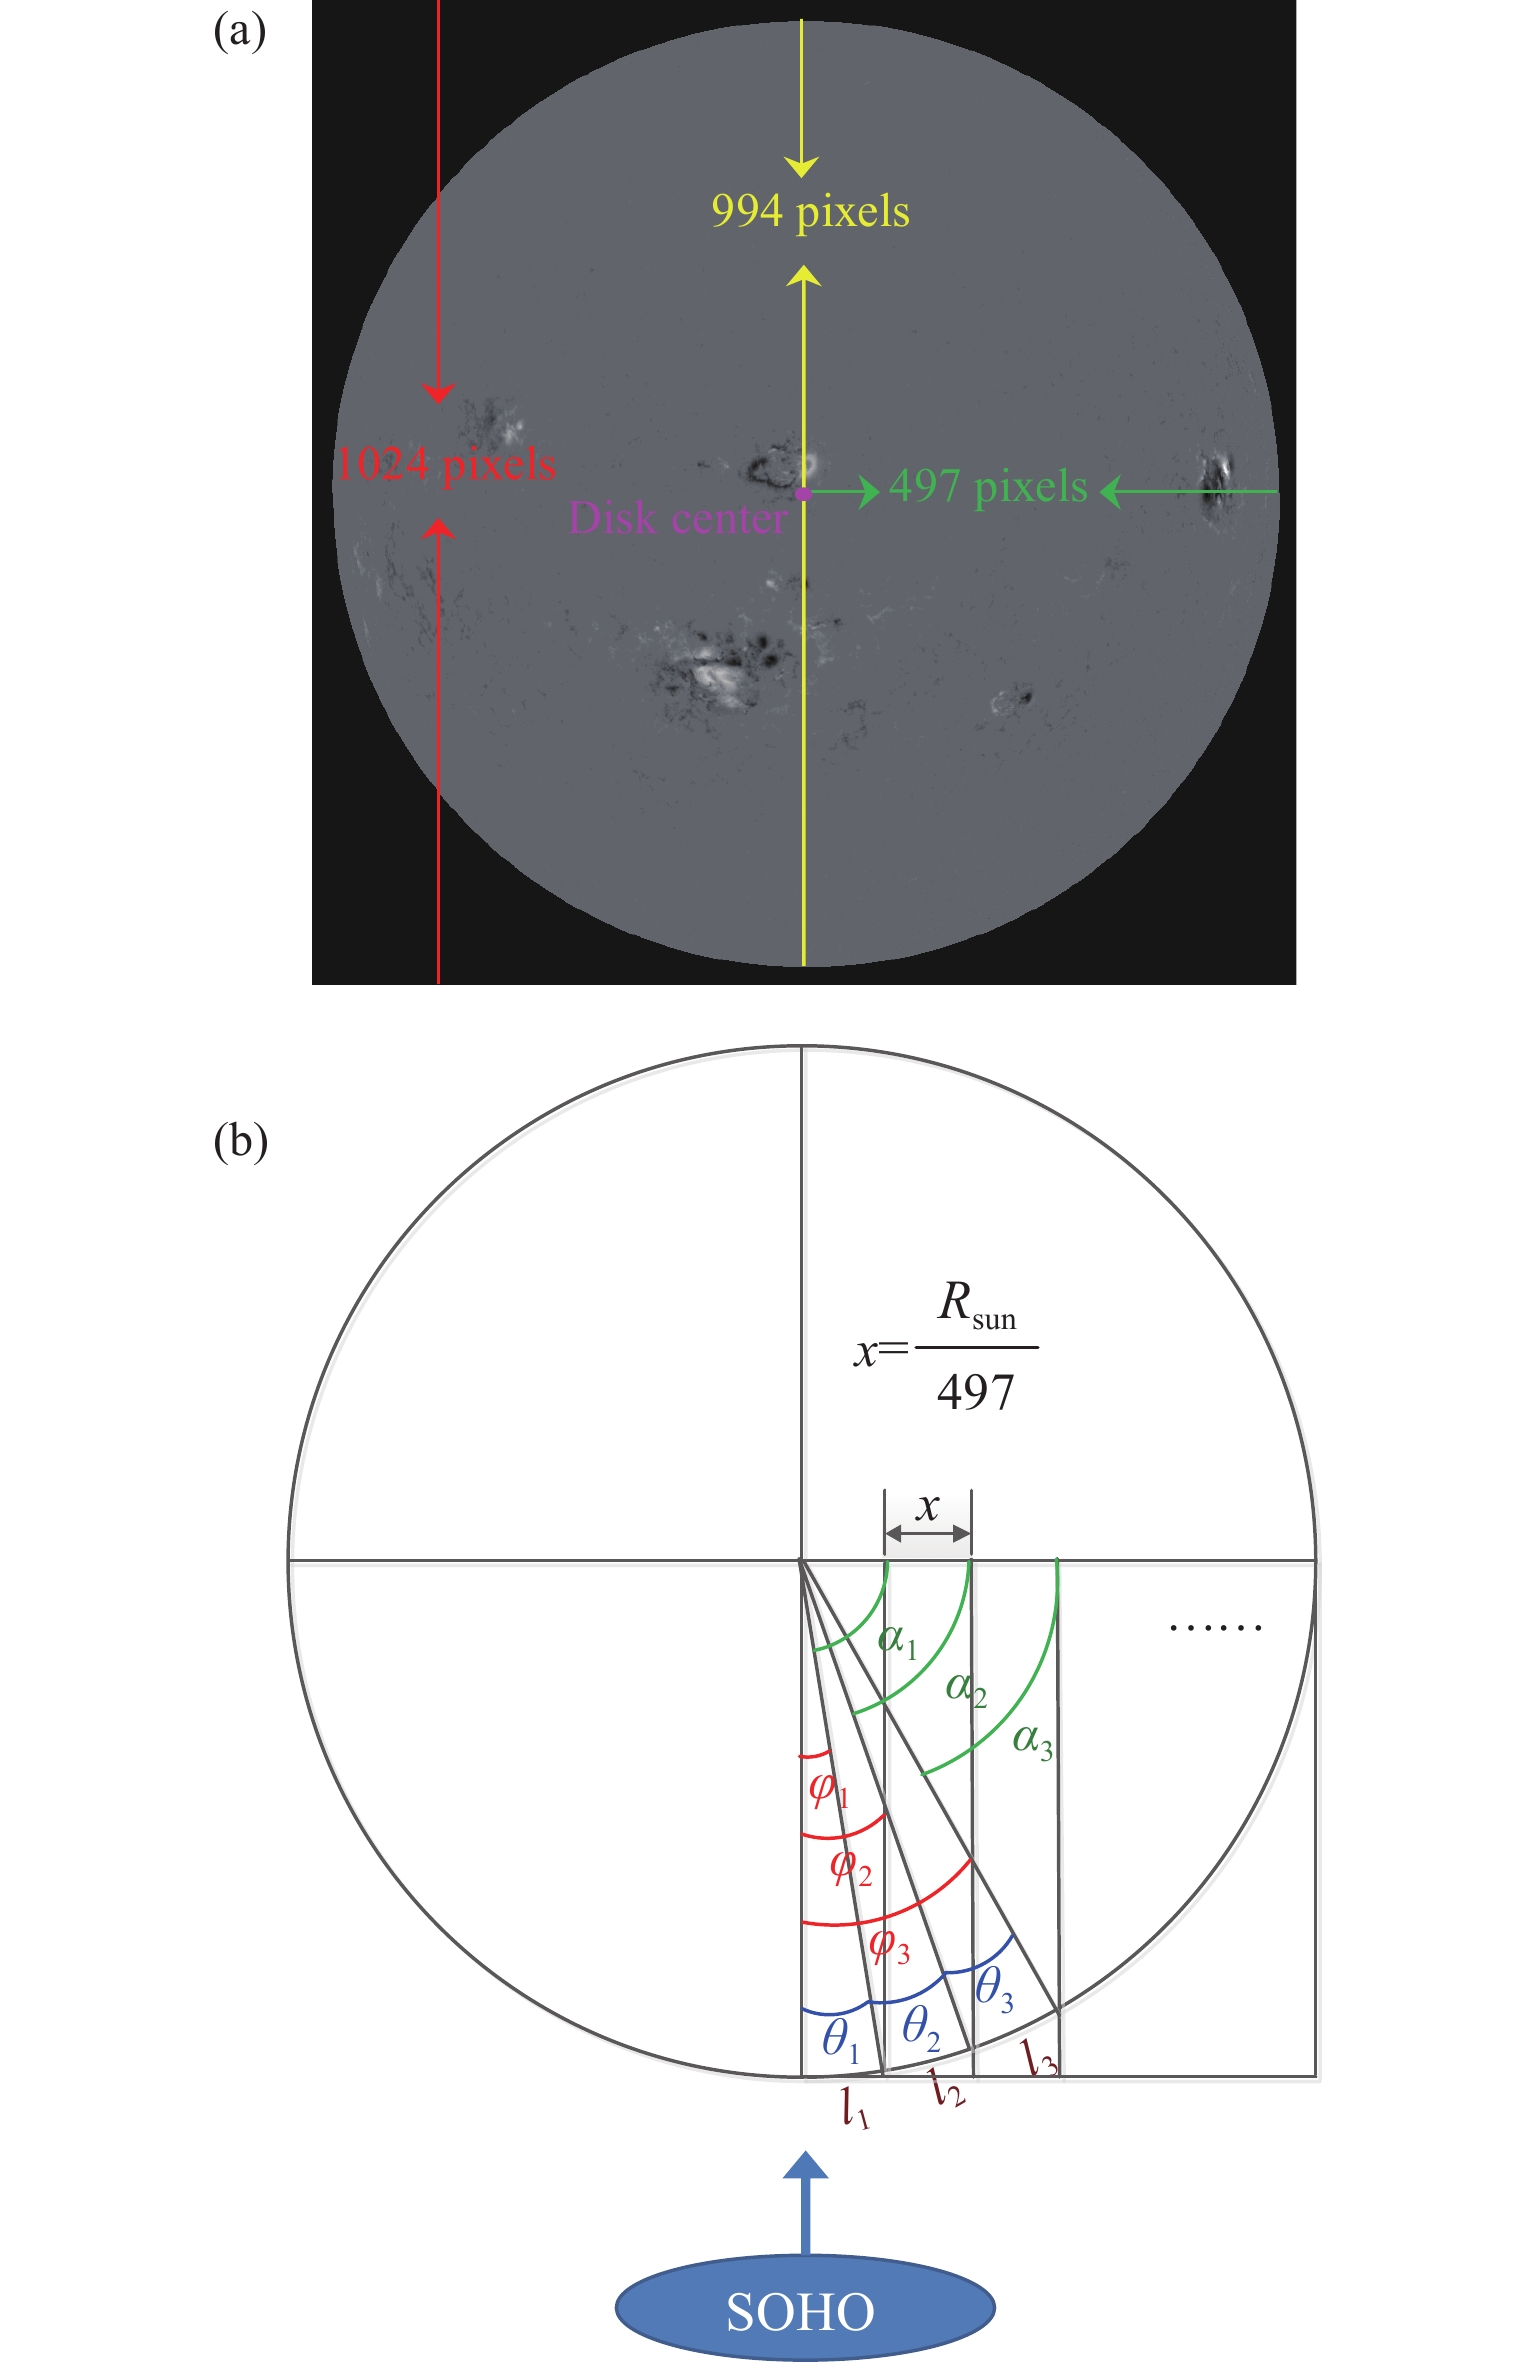
图 1 太阳球面面积校正。(a) 表示磁图影像为1024 pixel×1024 pixel (红线),太阳圆盘直径为994 pixel (黄线) ,太阳圆盘半径为497 pixel(绿线),紫色点为日面中心。(b) Rsun 表示太阳半径,$x$表示一个像元的边长,li表示平面图中像元边长所对应的弧长$x$,${\theta _i}$表示弧长li对应的日心角,αi和${\varphi _i}$表示计算过程中的变量
Figure 1. Schematic diagram of solar spherical area correction. (a) Shows that the magnetic image is 1024 pixel×1024 pixel (red line), the diameter of the solar disk is 994 pixel (yellow line), the radius of the solar disk is 497 pixel (green line), and the purple point is the center of the Sun. (b) Rsun denotes the solar radius, $x$ represents the edge length of a pixel, li represents the arc length corresponding to the pixel edge length $x$ in the plane view, ${\theta _i}$ represents the heliocentric angle corresponding to the arc length li, $ {a_i} $ and ${\varphi _i}$ represent the variables in the calculation process
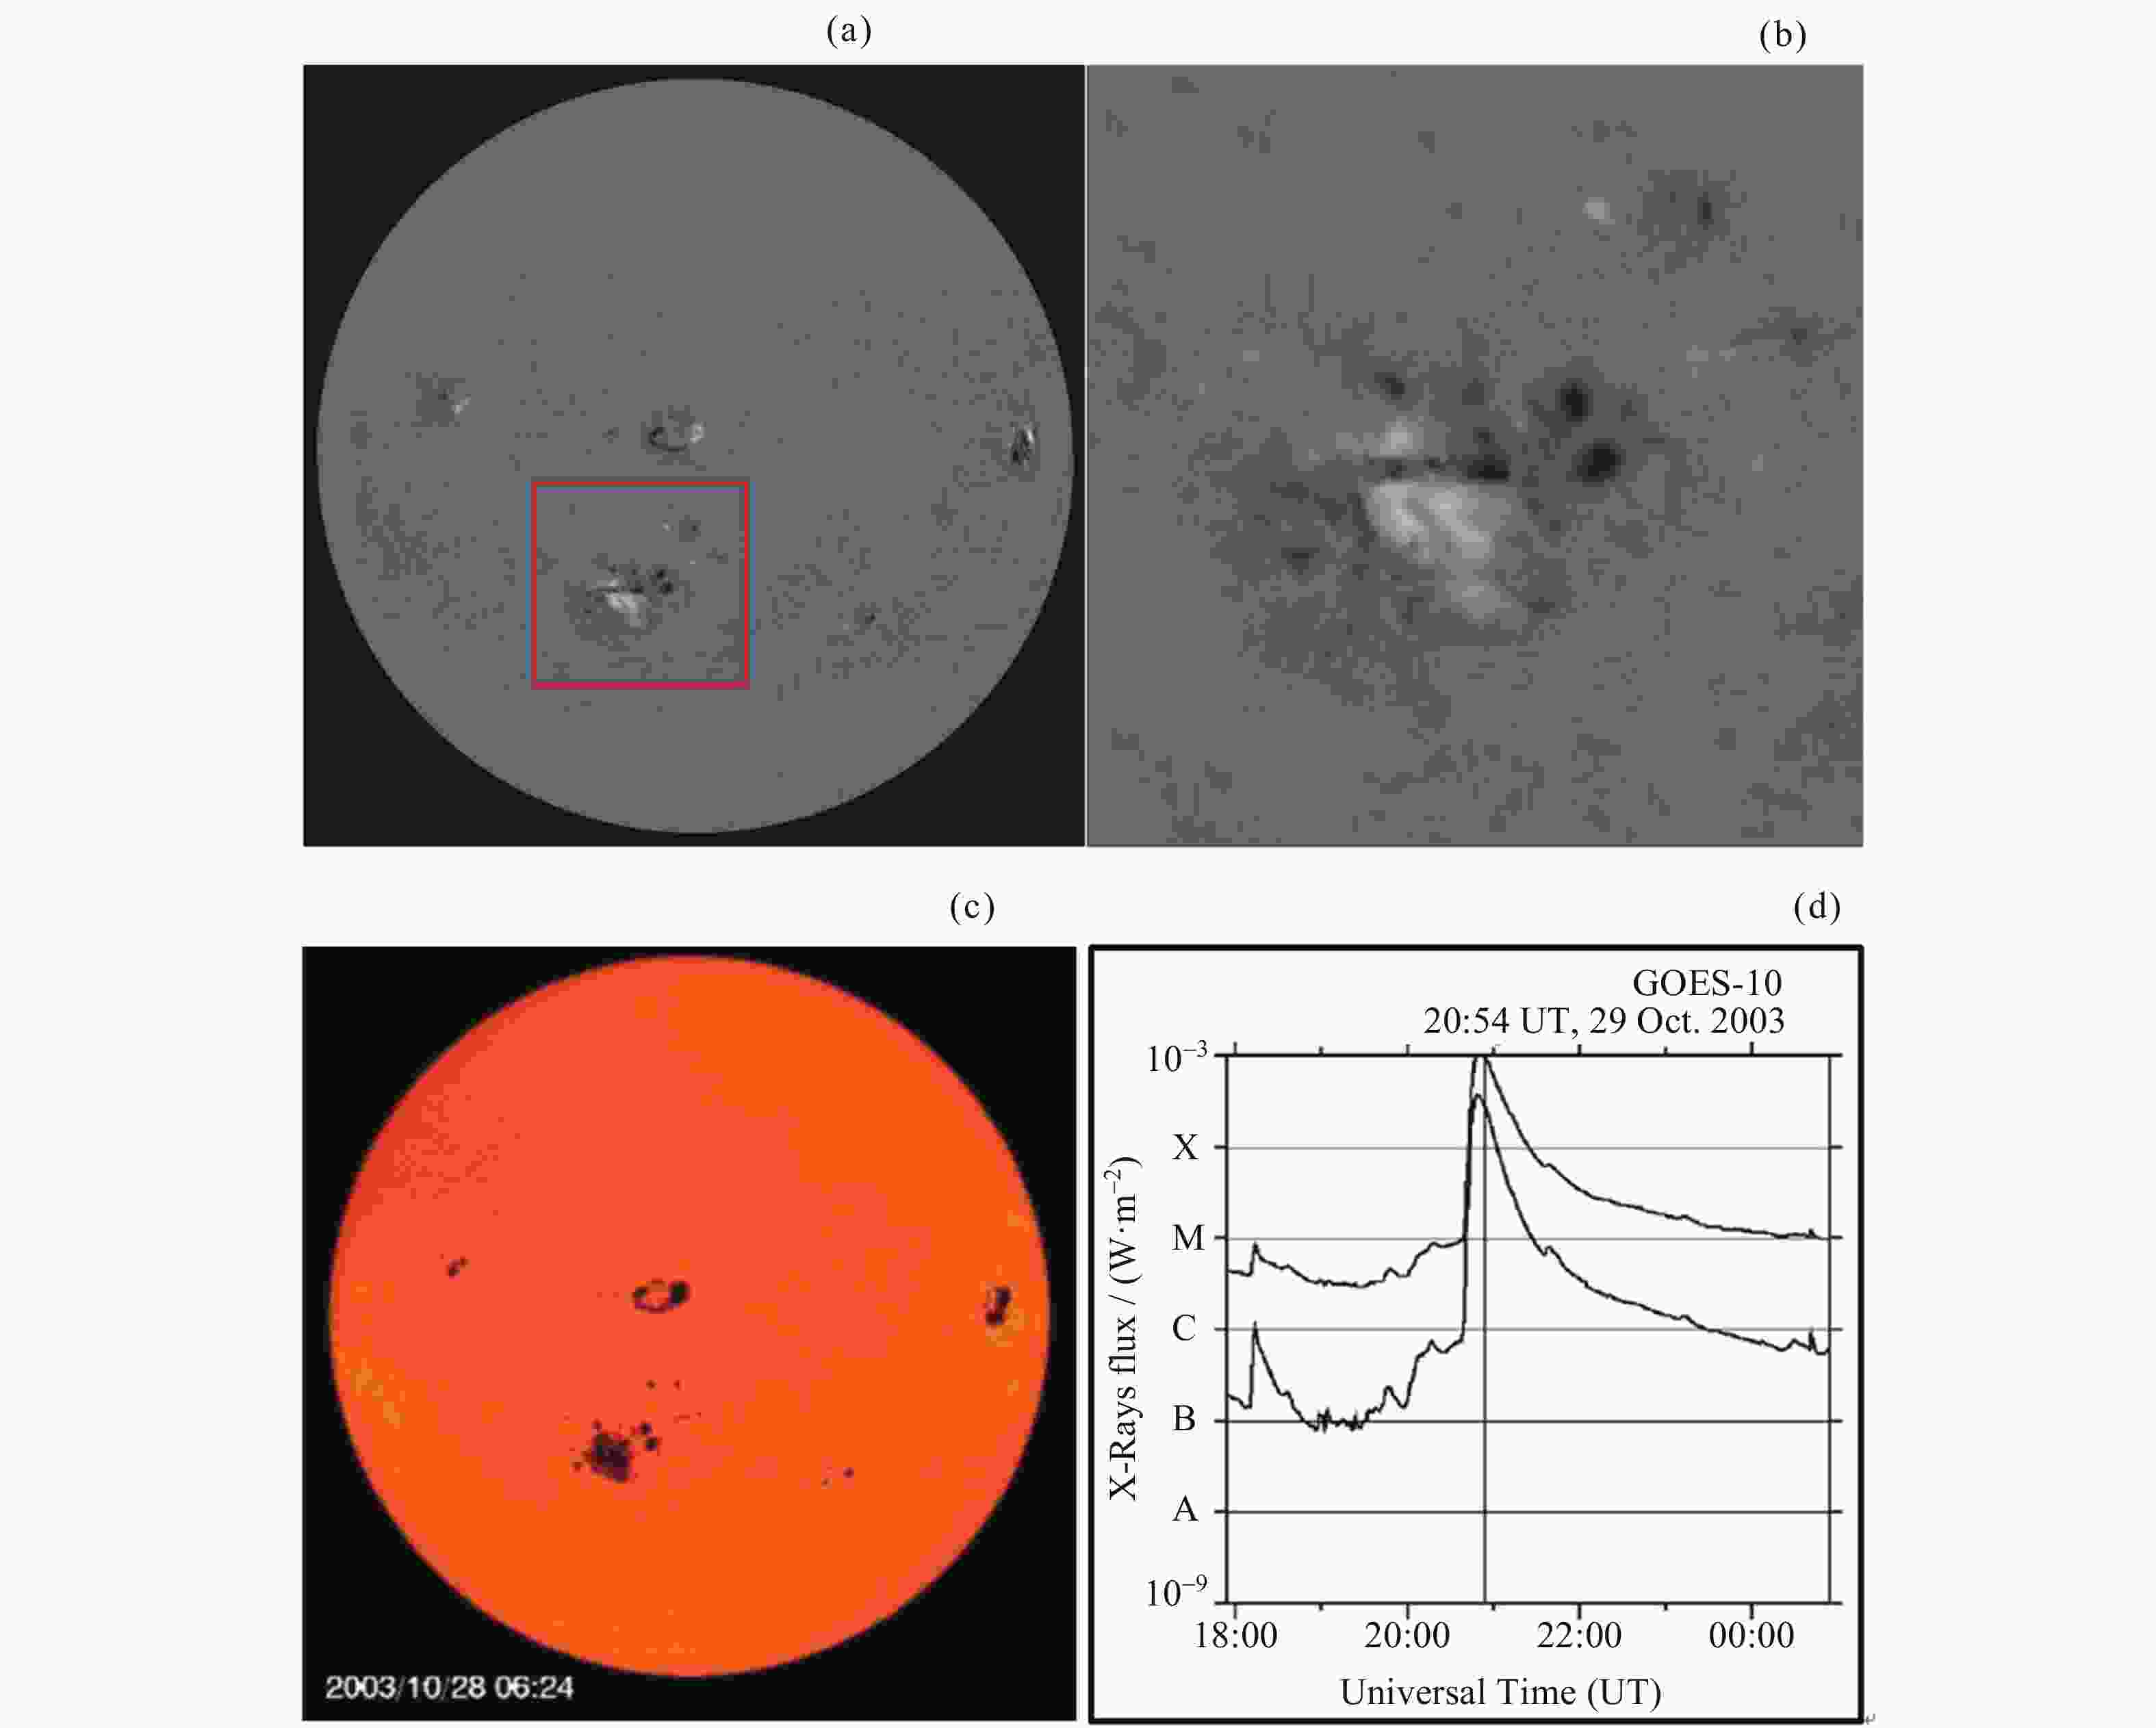
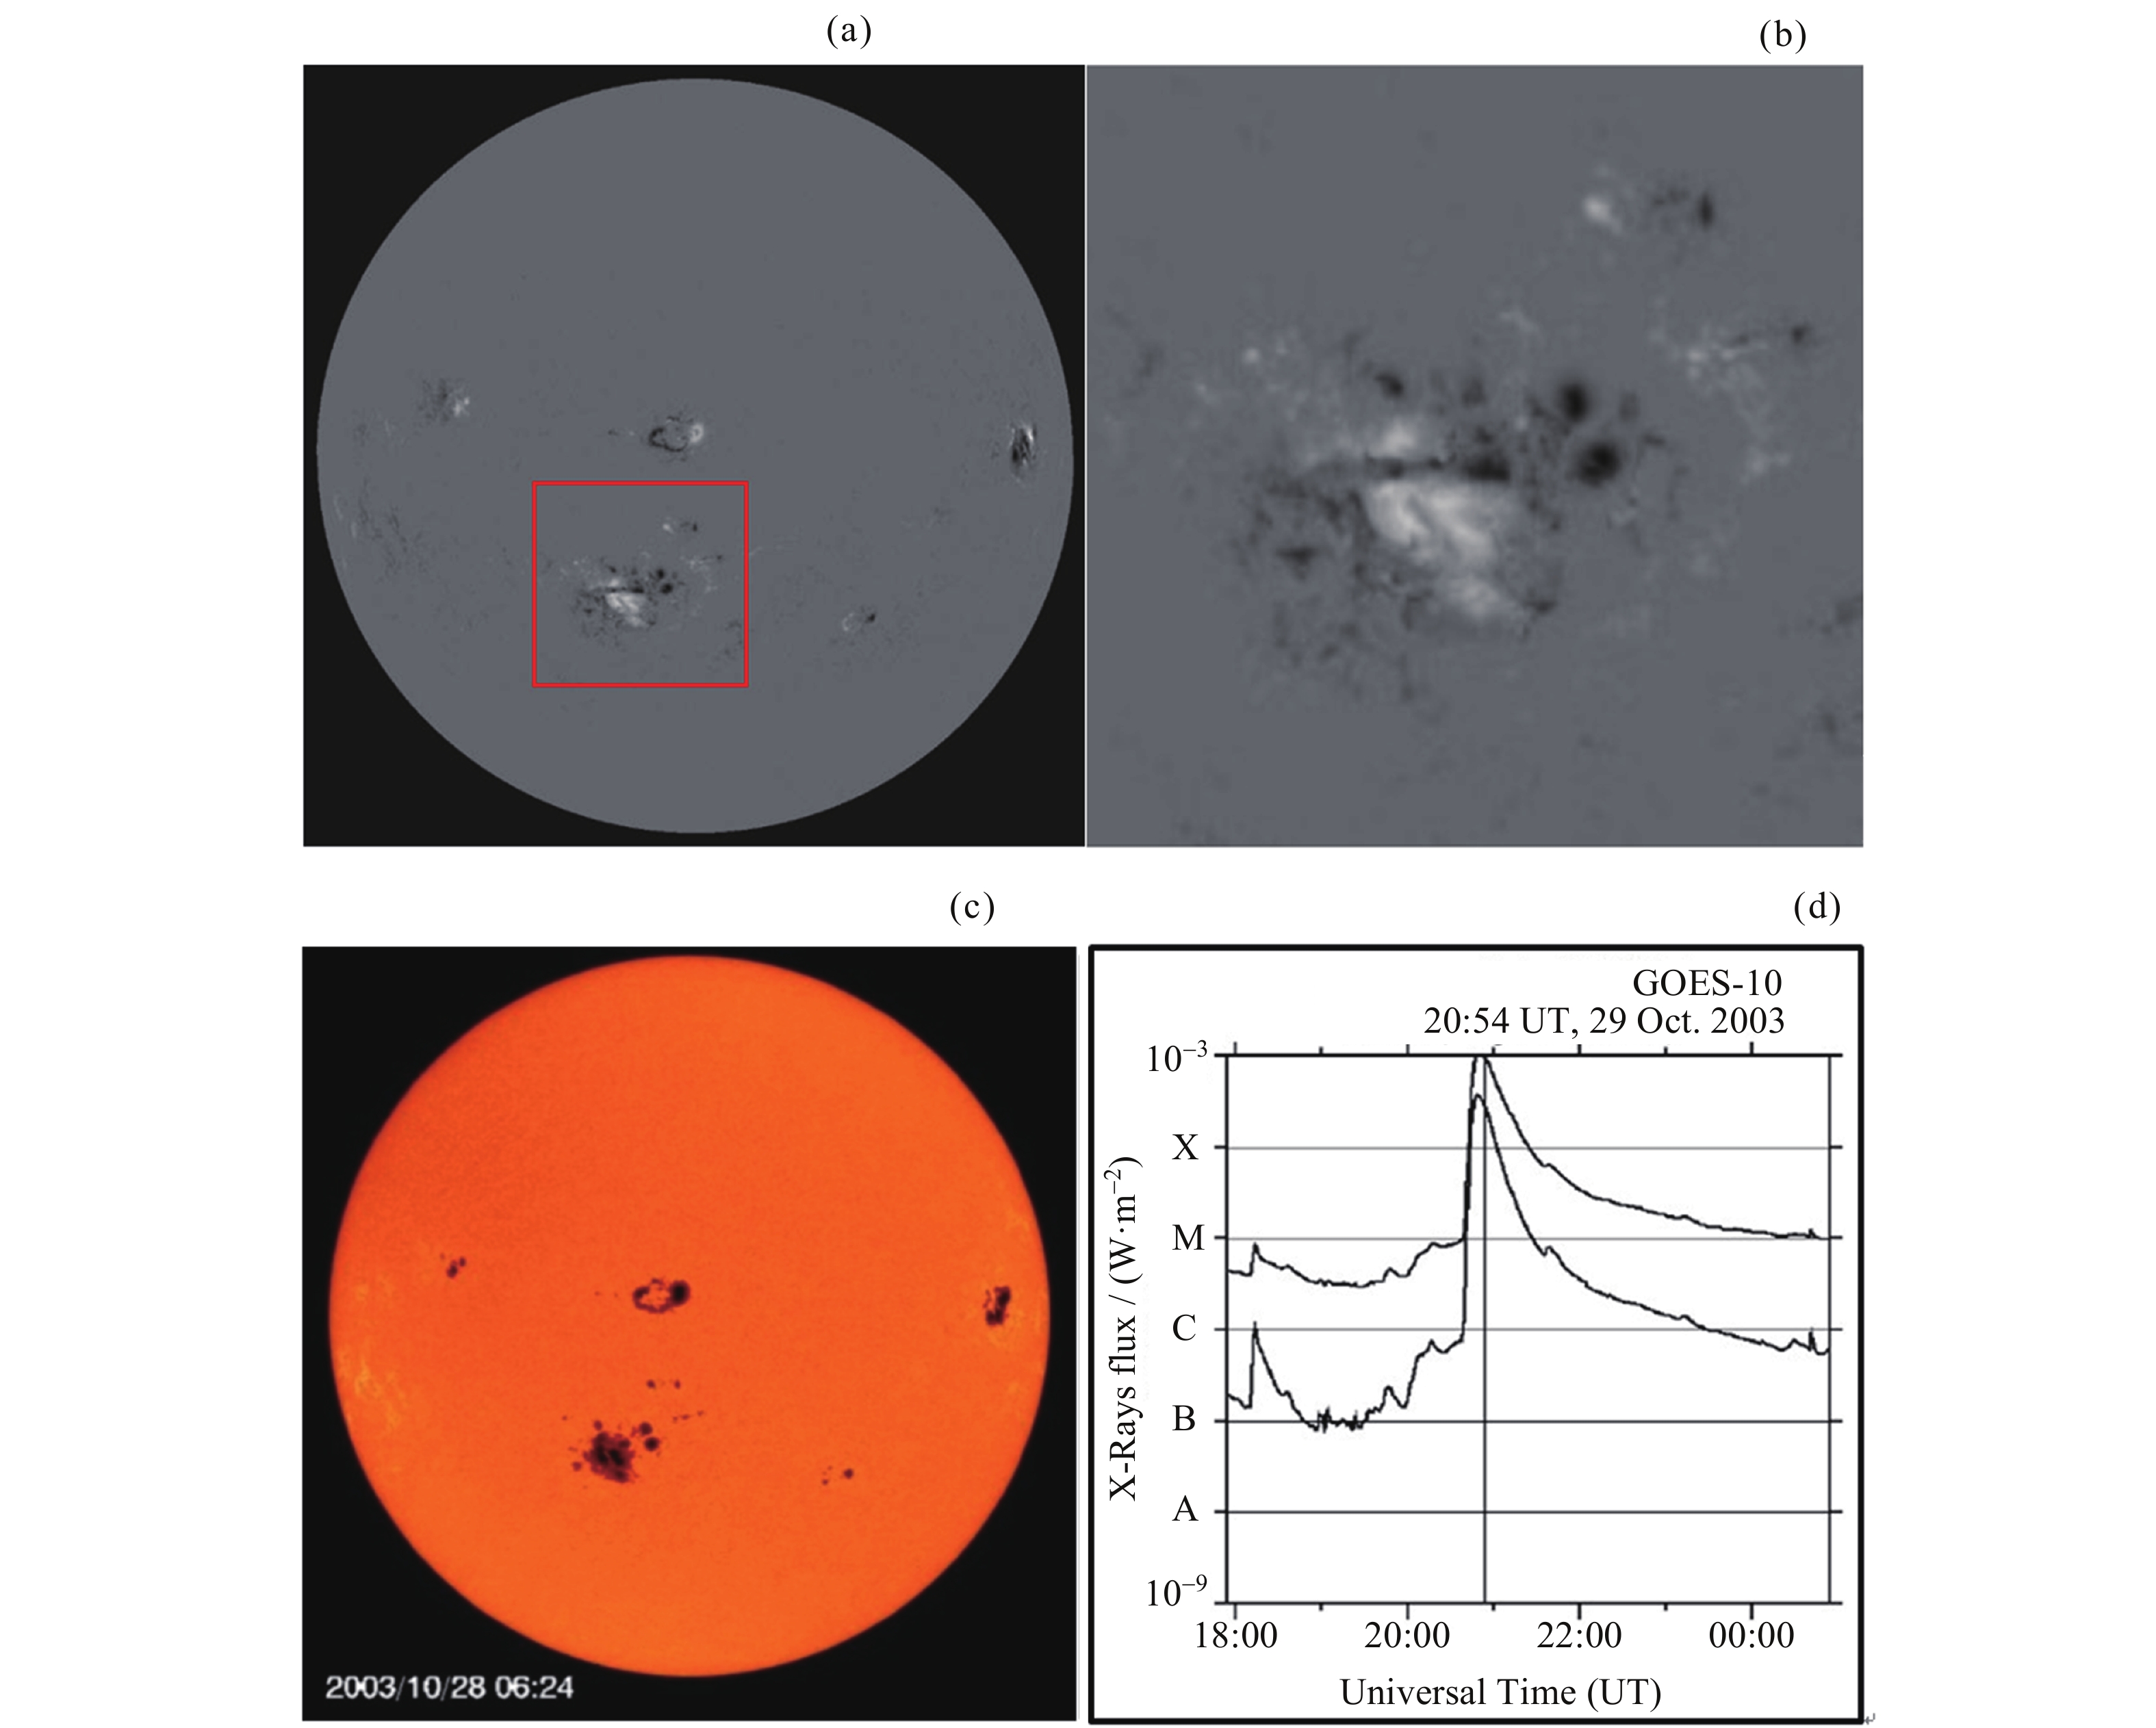
图 2 活动区10486磁场(a)(b)、黑子群(c)和X射线通量(d)
Figure 2. Magnetic field (a)(b), sunspot (c) and X-ray flux (d) of active region 10486
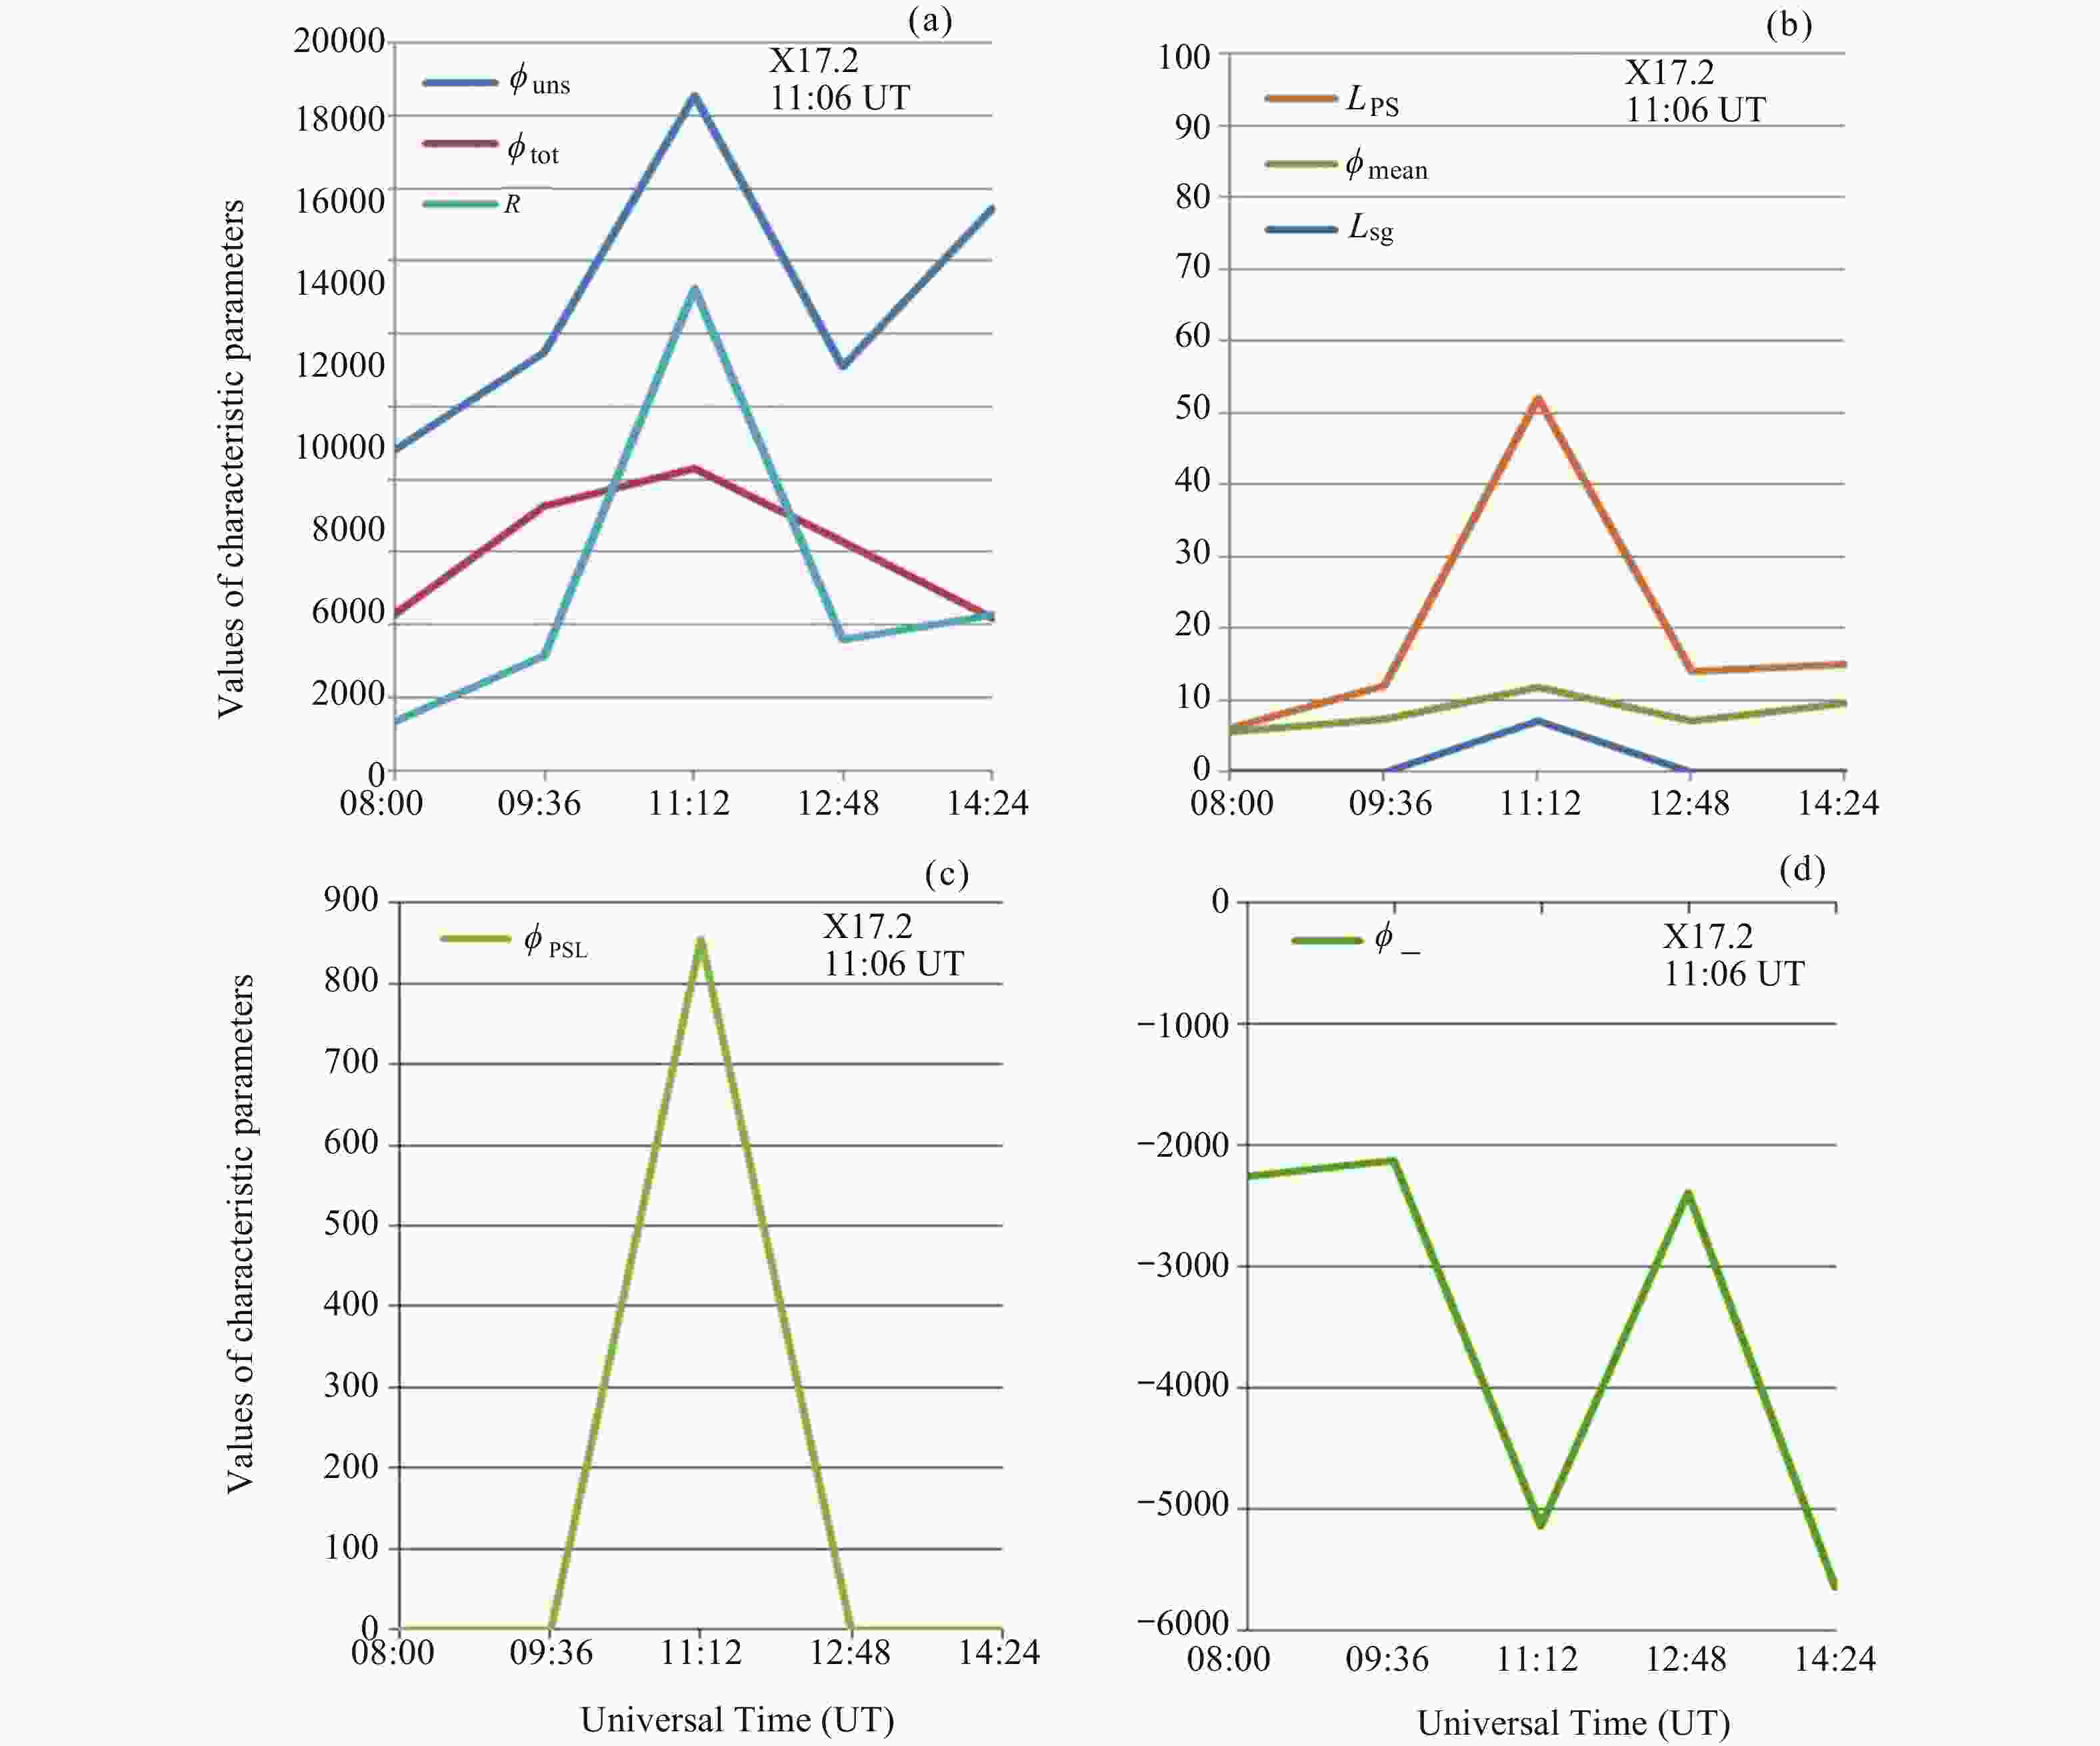
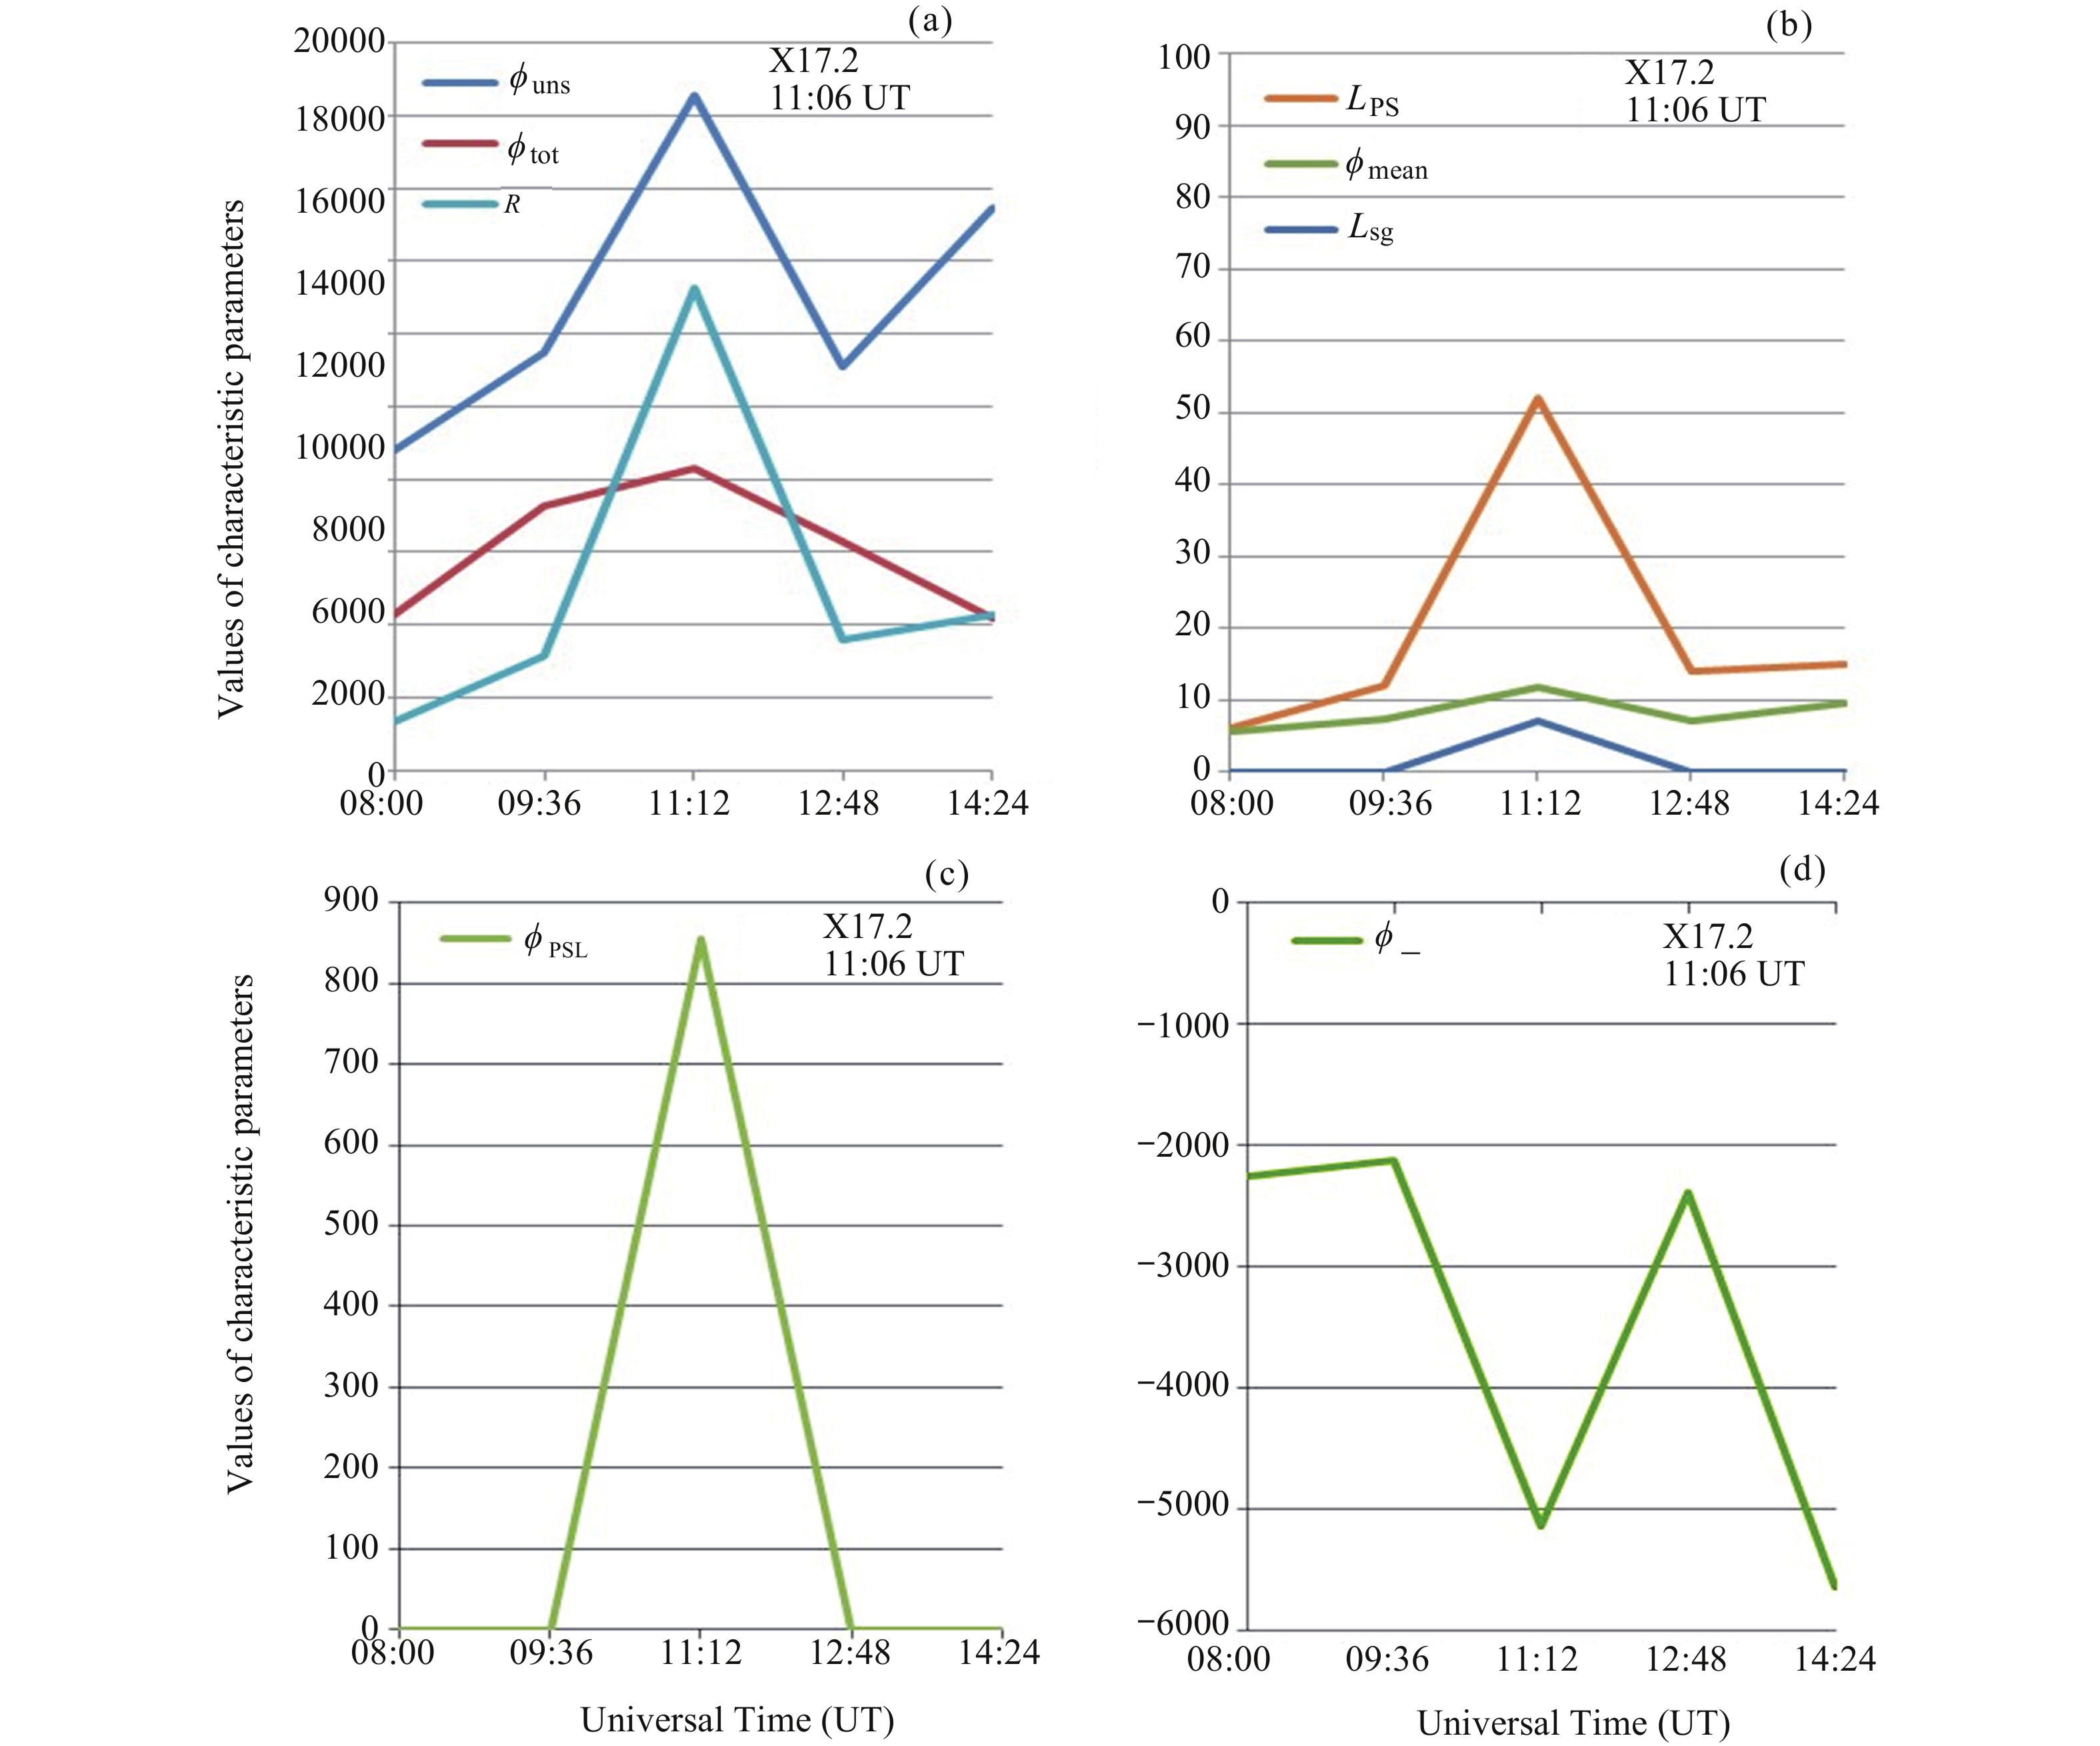
图 3 耀斑爆发前后最优特征参数变化趋势
Figure 3. Variation trend of the optimal characteristic parameters before and after the flare eruption
表 1 太阳活动区磁场特征量化指标
Table 1. Quantitative index of magnetic field characteristics in solar active region
特征参数 提出或优化算法表达 指标描述(均为单个活动区的量化指标) 编号 活动区磁场
特征量化活动区面积Atot $ \displaystyle\sum\nolimits_{p} {{A_{\cos ,t,i}}} $ 计算磁图面积校正后的活动区面积 1 磁场最大值$\phi $max $\phi $max,t,i 提取活动区中磁场最大值 2 磁场最小值$\phi $min $\phi $min,t,i 提取活动区中磁场最小值 3 磁场值代数和$\phi $tot $\displaystyle\sum\nolimits_{p} {{\phi _{t,i}}} $ 活动区中所有正负磁场值的代数和 4 磁场绝对值和的平均值$\phi $mean ${{\displaystyle\sum\nolimits_{p} {\left| {{\phi _{t,i}}} \right|} } \mathord{\left/ {\vphantom {{\displaystyle\sum\nolimits_{p} {\left| {{\phi _{t,i}}} \right|} } {\displaystyle\sum\nolimits_{p} {{A_{\cos ,t,i}}} }}} \right. } {\displaystyle\sum\nolimits_{p} {{A_{\cos ,t,i}}} }}$ 活动区中所有正负磁场值的绝对值和的平均值 5 磁场正通量总和$\phi $+ $ \displaystyle\sum\nolimits_{p} {\left( {{\phi _{t,i}} \gt 0} \right)} $ 活动区中所有正磁场值的代数和 6 磁场负通量总和$\phi $– $ \displaystyle\sum\nolimits_{p} {\left( {{\phi _{t,i}} \lt 0} \right)} $ 活动区中所有负磁场值的代数和 7 磁场通量绝对值总和$\phi $uns $ \displaystyle\sum\nolimits_{p} {\left| {{\phi _{t,i}}} \right|} $ 活动区中所有正负磁场值的绝对值的和 8 磁场通量不平衡率$\phi $imb $ {{\left| {\left( {{\phi _{ + ,t,i}} - \left| {{\phi _{ - ,t,i}}} \right|} \right)} \right|} \mathord{\left/ {\vphantom {{\left| {\left( {{\phi _{ + ,t,i}} - \left| {{\phi _{ - ,t,i}}} \right|} \right)} \right|} {{\phi _{uns,t,i}}}}} \right. } {{\phi _{uns,t,i}}}} $ 正负磁场通量差值相对于磁通量绝对值总和的变化率 9 磁场净通量增加率d$\phi $/dt ${\left. {\dfrac{{{\rm{d}}\phi }}{{{\rm{d}}t}}} \right|_{net,t,i}} = {\displaystyle\sum\nolimits_{p} {\left. {\frac{{{\rm{d}}\phi }}{{{\rm{d}}t}}} \right|} _{t,i}} = \dfrac{{\displaystyle\sum\nolimits_{p} {{\phi _{t,i}}} - \displaystyle\sum\nolimits_{p} {{\phi _{t - \Delta t,i}}} }}{{\Delta t}}$ 正负磁场值的代数和在单位时间内变化情况 10 活动区极性分
隔线特征量化强梯度极性分隔线长度Lsg $ \displaystyle\sum\nolimits_{p} {\nabla {\phi _{t,i}} \gt 50 \times {{10}^{ - 4}} \;{\rm{T}}} $,$ \nabla {\phi _{t,i}} $用三点拉格朗日插值获取,获
取后选取$ \nabla {\phi _{t,i}} \gt 50 \times {10^{ - 4}}\;{\rm{T}} $的像元,计算其个数。极性分隔线上相邻磁场值差值>50×10–4 T的像元个数总和 11 极性分隔线长度LPS $ \displaystyle\sum\nolimits_{p} {P \ne 0} $ 极性分隔线上磁场值≠0的像元个数总和 12 极性分隔线最大磁场梯度$\nabla\phi $max $\nabla\phi $max 极性分隔线上相邻磁场值差值最大的值 13 极性分隔线平均磁场梯度$\nabla \phi $mean $\nabla\phi $mean 极性分隔线上相邻磁场值差值的平均值 14 强梯度极性分隔线的梯度权重
(非势场测量)WLsg$ {W_{L\rm{sg}}} = \int {\left( {\nabla \phi z} \right)} {\rm{d}}l $,选取极性分隔线上磁场值>150×10–4 T
的像元,计算其三点拉格朗日插值,后利用此公式计算WLsgi极性分隔线上磁场值>150×10–4 T的像元拉格朗日插值长度积分 15 修正的WLsg,$W_{L{\rm{sg}}}^* $ $ \displaystyle\sum\nolimits_{p} {{M_{{\rm{PSL}},t,i}} \; \nabla {\phi _{t,i}}} $,$ \nabla {\phi _{t,i}} $用三点拉格朗日插值获取。 极性分隔线上磁场值>150×10–4 T的像元拉格朗日插值磁场值
积分16 强梯度极性分隔线权重磁场绝对值之和R $ \displaystyle\sum\nolimits_{p} ({{{M}}_{{\rm{PSL,t,i}}}}{{{G}}_{2{\rm{D}}}}) {\phi _{t,i}} $ 强梯度极性分隔线上磁场值乘以高斯权重后绝对值之和 17 强梯度极性分隔线磁场绝对值之和$\phi $PSL $ \displaystyle\sum\nolimits_{p} {\left| {{\phi _{{\rm{PSL}},t,i}}} \right|} $ 强梯度极性分隔线上磁场值绝对值之和 18 活动区分类 磁场极性类别(单极/多极) $\phi $imb,t,i ≥ 90%为单极,$\phi $imb,t,i<90%为多极 根据磁场通量不平衡率,分单极或多极 19 磁场强弱类别(强/弱) $\phi $uns,t,i ≥ 1021Mx为强通量,$\phi $uns,t,i<1021Mx为弱通量 根据磁场通量绝对值总和,分强通量或弱通量 20 磁场通量演化状态(增加/下降) d$\phi $/dt t,i≥0为磁通量增加,d$\phi $/dt t,i<0为磁通量下降 根据磁场净通量增加率,分磁通量增加或下降 21 注 Lsg、$\nabla \phi $max、$\nabla \phi $mean、 $\phi $PSL为本研究中新提出变量;Atot、$\phi $max、$\phi $min、$\phi $tot、$\phi $mean、$\phi $+、$\phi $–、$\phi $uns、$\phi $imb、 d$\phi $/dt、 LPS、 $W_{L{\rm{sg}}}^* $和R 由文献[21]提出;Lsg和WLsg由文献[18, 19]提出;所有公式中的t, i分别表示t时刻影像的第i个像元; P 为pixel取值范围; G2D为二维高斯平滑。  下载: 导出CSV
表 2 磁场特征量化结果主成分分析结果
Table 2. Results of principal component analysis of quantitative results of magnetic field characteristics
特征参数 初始特征值 提取的平方和载入值 合计 方差/(%) 累积 /(%) 合计 方差 /(%) 累积 /(%) 极性分隔线权重磁场值的和R 8.049 38.327 38.327 8.049 38.327 38.327 磁场通量绝对值总和$\phi $uns 3.404 16.208 54.535 3.404 16.208 54.535 极性分隔线长度LPS 1.782 8.488 63.023 1.782 8.488 63.023 磁场负通量总和$\phi $- 1.360 6.479 69.501 1.360 6.479 69.501 磁场值代数和$\phi $tot 1.113 5.302 74.803 1.113 5.302 74.803 磁场最小值$\phi $min 0.985 4.693 79.496 0.985 4.693 79.496 强梯度极性分隔线长度Lsg 0.889 4.234 83.729 0.889 4.234 83.729 强梯度极性分隔线磁场绝对值之和$\phi $PSL 0.800 3.812 87.541 0.800 3.812 87.541 磁场绝对值之和平均值$\phi $mean 0.562 2.678 90.219 0.562 2.678 90.219 极性分隔线最大磁场梯度$\nabla \phi $max 0.501 2.387 92.606 - - - 磁场强弱类别(强/弱) 0.454 2.164 94.770 - - - 修正的WLsg($W_{ L{\rm{sg}}}^* $) 0.370 1.763 96.533 - - - 磁场净通量增加率d$\phi $/dt 0.271 1.289 97.822 - - - 强梯度极性分隔线梯度权重WLsg 0.180 0.857 98.679 - - - 磁场通量不平衡率$\phi $imb 0.135 0.641 99.320 - - - 磁场极性类别(单极/多极) 0.088 0.421 99.741 - - - 磁场正通量总和$\phi $+ 0.034 0.163 99.903 - - - 磁场最大值$\phi $max 0.020 0.096 100.000 - - - 磁场通量演化状态(增加/下降) 0.000 0.000 100.000 - - - 极性分隔线平均磁场梯度$\nabla \phi $mean 0.000 0.000 100.000 - - - 面积Atot 0.000 0.000 100.000 - - -
下载: 导出CSV
表 3 2003年10月28日活动区10486磁场特征参数量化结果
Table 3. Quantitative results of characteristic parameters of magnetic field in 10486 active area on 28 October 2003
特征参数 08:00 UT 09:36 UT 11:12 UT 12:48 UT 14:24 UT 08:00-11:12 UT(增加率) 活动区面积Atot / pixel 1576.05 1588.32 1596.42 1597.98 1621.87 1.29% 磁场最大值$\phi $max / (×10–4)T 314.97 368.60 468.80 542.06 385.04 48.84% 磁场最小值$\phi $min / (×10–4)T –247.11 –206.13 –301.62 –491.54 –545.70 22.06% 磁场值代数和$\phi $tot / (×10–4)T 4283.35 7262.43 8284.17 6309.44 4197.62 93.40% 磁场绝对值和的平均值$\phi $mean / (×10–4)T 5.58 7.25 11.63 6.94 9.54 108.42% 磁场正通量总和$\phi $+ / (×10–4)T 6542.03 9385.23 13428.10 8700.38 9836.09 105.26% 磁场负通量总和$\phi $– / (×10–4)T –2258.68 –2122.80 –5143.94 –2390.94 –5638.47 127.74% 磁场通量绝对值总和$\phi $uns / (×10–4)T 8800.72 11508.03 18572.04 11091.32 15474.56 111.03% 磁场通量不平衡率$\phi $imb 0.49 0.63 0.45 0.57 0.27 –8.16%、–164.69% 磁场净通量增加率d$\phi $/dt 14.66 –25.52 16.51 1.32 –25.11 09:36-11:12 UT 强梯度极性分隔线长度Lsg / pixel 0.00 0.00 7.00 0.00 0.00 - 极性分隔线长度LPS / pixel 6.00 12.00 52.00 14.00 15.00 766.67% 极性分隔线最大磁场梯度$\nabla \phi $max / (×10–4)T 0.00 0.00 319.35 0.00 0.00 - 极性分隔线平均磁场梯度$\nabla \phi $mean / (×10–4)T 0.00 0.00 28.85 0.00 0.00 - 强梯度极性分隔线的梯度权重WLsg/ pixel 0.00 0.00 319.35 0.00 0.00 - 修正的WLsg,$W_{L{\rm{sg}}}^* $/ pixel 0.00 0.00 663.44 0.00 0.00 - 极性分隔线权重磁场值之和R / (×10–4)T 1317.16 3163.26 13262.56 3569.14 4297.99 906.91% 强梯度极性分隔线磁场绝对/ (×10–4)T
值之和$\phi $PSL / (×10–4)T0.00 0.00 855.14 0.00 0.00 - 磁场极性类别(单极/多极) 多极 多极 多极 多极 多极 - 磁场强弱类别(强/弱) 弱 弱 弱 弱 弱 - 磁场通量演化状态(增加/下降) 增加 下降 增加 增加 下降 - 注 表中灰色部分表示耀斑爆发前后磁场特征值变化较大的特征参数。
下载: 导出CSV
-
[1] 魏奉思. 关于我国空间天气保障能力发展战略的一些思考[J]. 气象科技进展, 2011, 1(4): 53-57WEI Fengsi. Some thoughts on the development strategy of space weather security in China[J]. Advances in Meteorological Science and Technology, 2011, 1(4): 53-57 [2] 焦维新. 空间天气学[M]. 北京: 气象出版社, 2003JIAO Weixin. Science of Space Weather[M]. Beijing: China Meteorological Press, 2003 [3] 马杰, 方涵先, 王世金, 等. 辐射带AP9模式在南大西洋异常区的系统性量化评估[J]. 空间科学学报, 2017, 37(4): 395-402 doi: 10.11728/cjss2017.04.395MA Jie, FANG Hanxian, WANG Shijin, et al. Systemic quantitative evaluation of the radiation belt AP9 model in SAA region[J]. Chinese Journal of Space Science, 2017, 37(4): 395-402 doi: 10.11728/cjss2017.04.395 [4] LIU X Z, DONG S L. Solar flare predictions based on fuzzy classification of active regions[J]. Chinese Science Bulletin, 1989, 34(1): 49-52 [5] XUAN J Y, ZHONG S H, LUO Z, et al. The spectral observation of continuous emission of a solar flare on Jan. 18, 1989[J]. Chinese Science Bulletin, 1992, 37(5): 391-396 [6] XU A A, WU G P, TANG Y H, et al. A phenomenological model of the solar flare based on the evolution of filament current[J]. Chinese Science Bulletin, 1994, 39(9): 759-765 [7] HU Y Q, LI X, AI G X. Mechanism for magnetic energy release in solar flares[J]. Chinese Science Bulletin, 1995, 40(23): 1983-1987 [8] HE L S, NISHINO M, ZHANG B C, et al. Absorption events associated with solar flares[J]. Chinese Science Bulletin, 2001, 46(5): 369-372 doi: 10.1007/BF03183265 [9] HUANG X, WANG H N, DAI X H. Influences of misprediction costs on solar flare prediction[J]. Science China Physics, Mechanics and Astronomy, 2012, 55(10): 1956-1962 doi: 10.1007/s11433-012-4878-3 [10] XIE W B, WANG H M, JING J, et al. The correlation between expansion speed and magnetic field in solar flare ribbons[J]. Science in China Series G: Physics, Mechanics and Astronomy, 2009, 52(11): 1754-1759 doi: 10.1007/s11433-009-0239-2 [11] GALLAGHER P T, MOON Y J, WANG H M. Active-region monitoring and flare forecasting- I. Data processing and first results[J]. Solar Physics, 2002, 209(1): 171-183 doi: 10.1023/A:1020950221179 [12] 赵海娟, 占腊生, 戎永辉. 国内外空间天气短期预报和警报及其现状[J]. 天文研究与技术-国家天文台台刊, 2004, 1(1): 28-46ZHAO Haijuan, ZHAN Lasheng, RONG Yonghui. Alert and short-term prediction of solar activity[J]. Astronomical Research and Technology—Publications of National Astronomical Observatories of China, 2004, 1(1): 28-46 [13] LI R, WANG H N, CUI Y M, et al. Solar flare forecasting using learning vector quantity and unsupervised clustering techniques[J]. Science China Physics, Mechanics and Astronomy, 2011, 54(8): 1546-1552 doi: 10.1007/s11433-011-4391-0 [14] 李蓉, 崔延美. 结合支持向量机和近邻法的太阳耀斑预报方法[J]. 计算机工程与设计, 2009, 30(15): 3605-3607, 3611LI Rong, CUI Yanmei. Solar flare forecasting method of combining support vector machine with nearest neighbors[J]. Computer Engineering and Design, 2009, 30(15): 3605-3607, 3611 [15] LI R, ZHU J. Solar flare forecasting based on sequential sunspot data[J]. Research in Astronomy and Astrophysics, 2013, 13(9): 1118-1126 doi: 10.1088/1674-4527/13/9/010 [16] LIU J F, LI F, WAN J, et al. Short-term solar flare prediction using multi-model integration method[J]. Research in Astronomy and Astrophysics, 2017, 17(4): 034 doi: 10.1088/1674-4527/17/4/34 [17] SCHRIJVER C J. Characteristic magnetic field pattern associated with all major solar flares and its use in flare forecasting[J]. The Astrophysical Journal, 2007, 655(2): L117-L120 doi: 10.1086/511857 [18] FALCONER D A, MOORE R L, GARY G A. A measure from line-of-sight magnetograms for prediction of coronal mass ejections[J]. Journal of Geophysical Research, 2003, 108(A10): 1380 doi: 10.1029/2003JA010030 [19] FALCONER D A, MOORE R L, GARY G A. Magnetogram measures of total nonpotentiality for prediction of solar coronal mass ejections from active regions of any degree of magnetic complexity[J]. The Astrophysical Journal, 2008, 689(2): 1433-1442 doi: 10.1086/591045 [20] HIGGINS P A, GALLAGHER P T, MCATEER R T J, et al. Solar magnetic feature detection and tracking for space weather monitoring[J]. Advances in Space Research, 2011, 47(12): 2105-2117 doi: 10.1016/j.asr.2010.06.024 [21] FALCONER D, BARGHOUTY A F, KHAZANOV I, et al. A tool for empirical forecasting of major flares, coronal mass ejections, and solar particle events from a proxy of active-region free magnetic energy[J]. Space Weather, 2011, 9(4): S04003 doi: 10.1029/2009SW000537 [22] JOLLIFFE I T. Principal Component Analysis[M]. 2 nd ed. New York: Springer, 2002 [23] 林海明, 张文霖. 主成分分析与因子分析的异同和SPSS软件−兼与刘玉玫、卢纹岱等同志商榷[J]. 统计研究, 2005(3): 65-69 doi: 10.3969/j.issn.1002-4565.2005.03.015LIN H M, ZHANG W L. The relationship between principal component analysis and factor analysis and SPSS software—to discuss with comrade Liu Yumei, Lu Wendai etc[J]. Statistical Research, 2005(3): 65-69 doi: 10.3969/j.issn.1002-4565.2005.03.015 [24] 林海明. 主成分分析与初始因子分析的异同−兼与卢纹岱《SPSS for Windows统计分析》商榷[J]. 统计与决策, 2006(8): 33-34 doi: 10.3969/j.issn.1002-6487.2006.08.013LIN Haiming. The similarities and differences between the principal component analysis and initial factor analysis[J]. Statistics and Decision, 2006(8): 33-34 doi: 10.3969/j.issn.1002-6487.2006.08.013 [25] MCINTOSH P S, DRYER M. Solar Activity Observations and Predictions[M]. Cambridge: MIT Press, 1972: 371 [26] 方成, 丁明德, 陈鹏飞. 太阳活动区物理[M]. 南京: 南京大学出版社, 2008FANG Cheng, DING Mingde, CHEN Pengfei. Physics of Solar Active Regions[M]. Nanjing: Nanjing University Press, 2008 [27] WANG H M, SONG H, JING J, et al. The relationship between magnetic gradient and magnetic shear in five super active regions producing great flares[J]. Chinese Journal of Astronomy and Astrophysics, 2006, 6(4): 477-488 doi: 10.1088/1009-9271/6/4/11 [28] JING J, SONG H, ABRAMENKO V, et al. The statistical relationship between the photospheric magnetic parameters and the flare productivity of active regions[J]. The Astrophysical Journal, 2006, 644(2): 1273-1277 doi: 10.1086/503895 -
-

 下载:
下载:

计量
- 文章访问数: 1478
- HTML全文浏览量: 637
- PDF下载量: 31
-
被引次数:
0(来源:Crossref)
0(来源:其他)

