


Effects of Solar Extreme Ultraviolet Radiation on Thermospheric Neutral Density
-
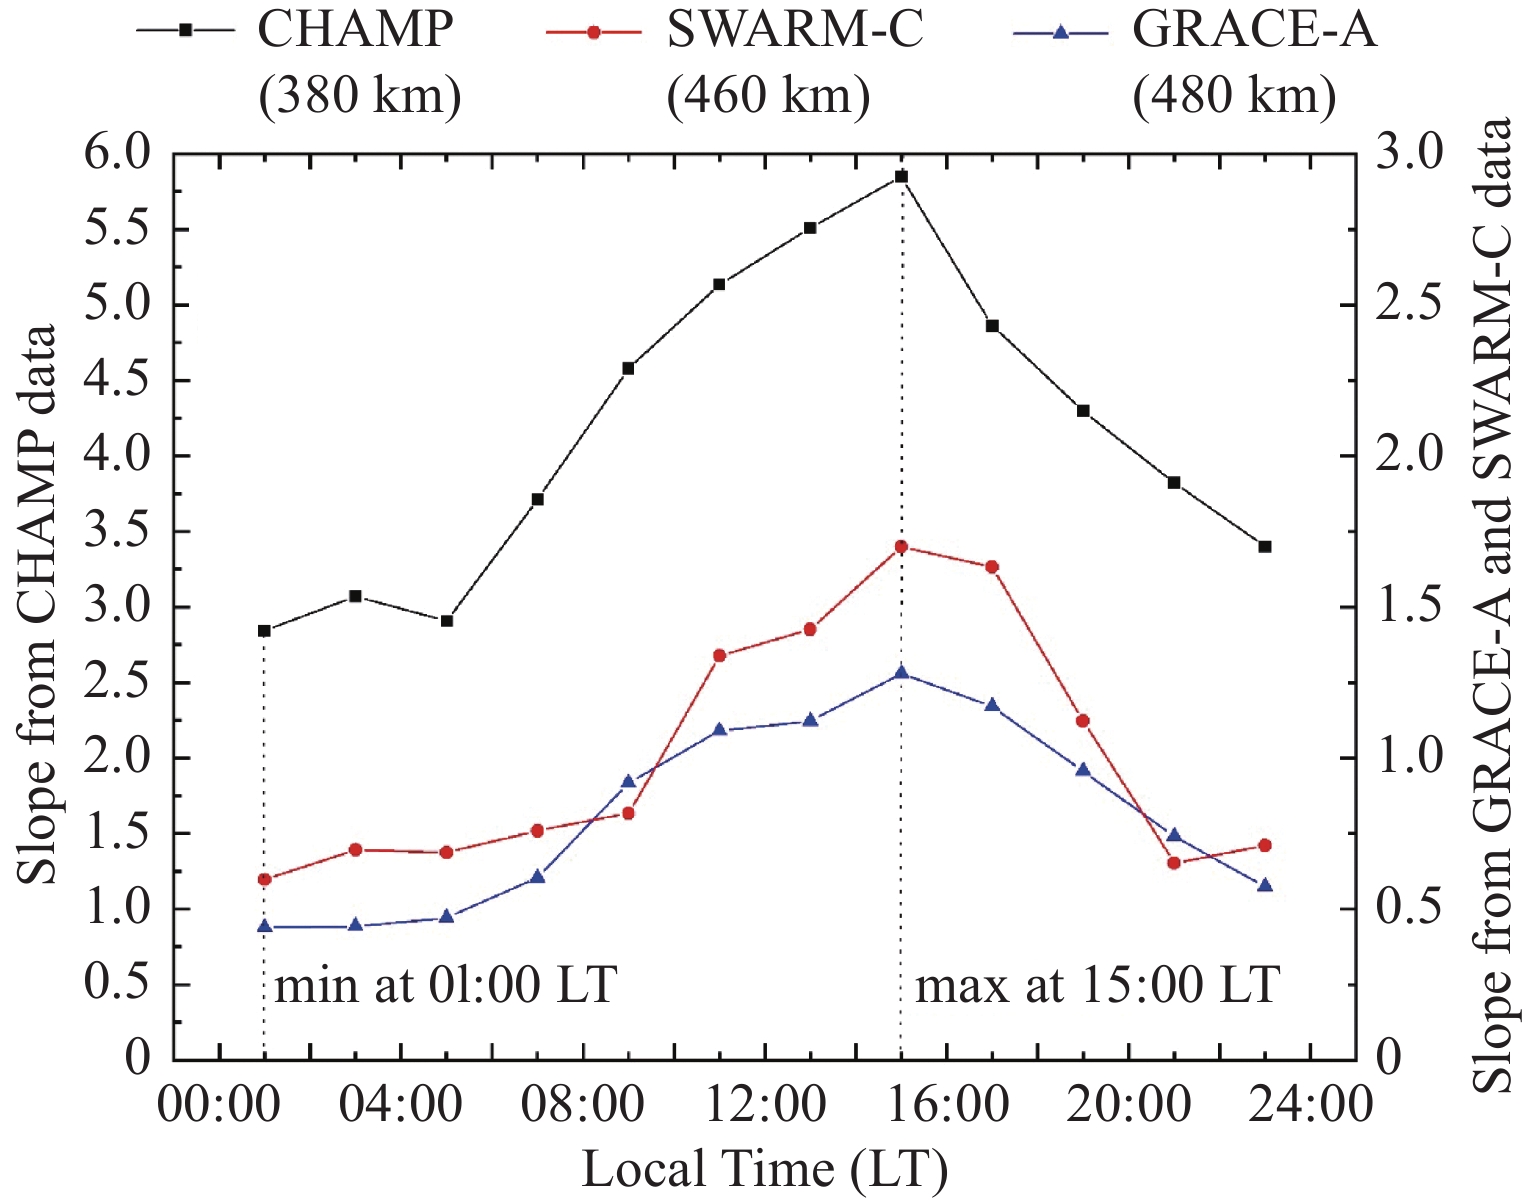
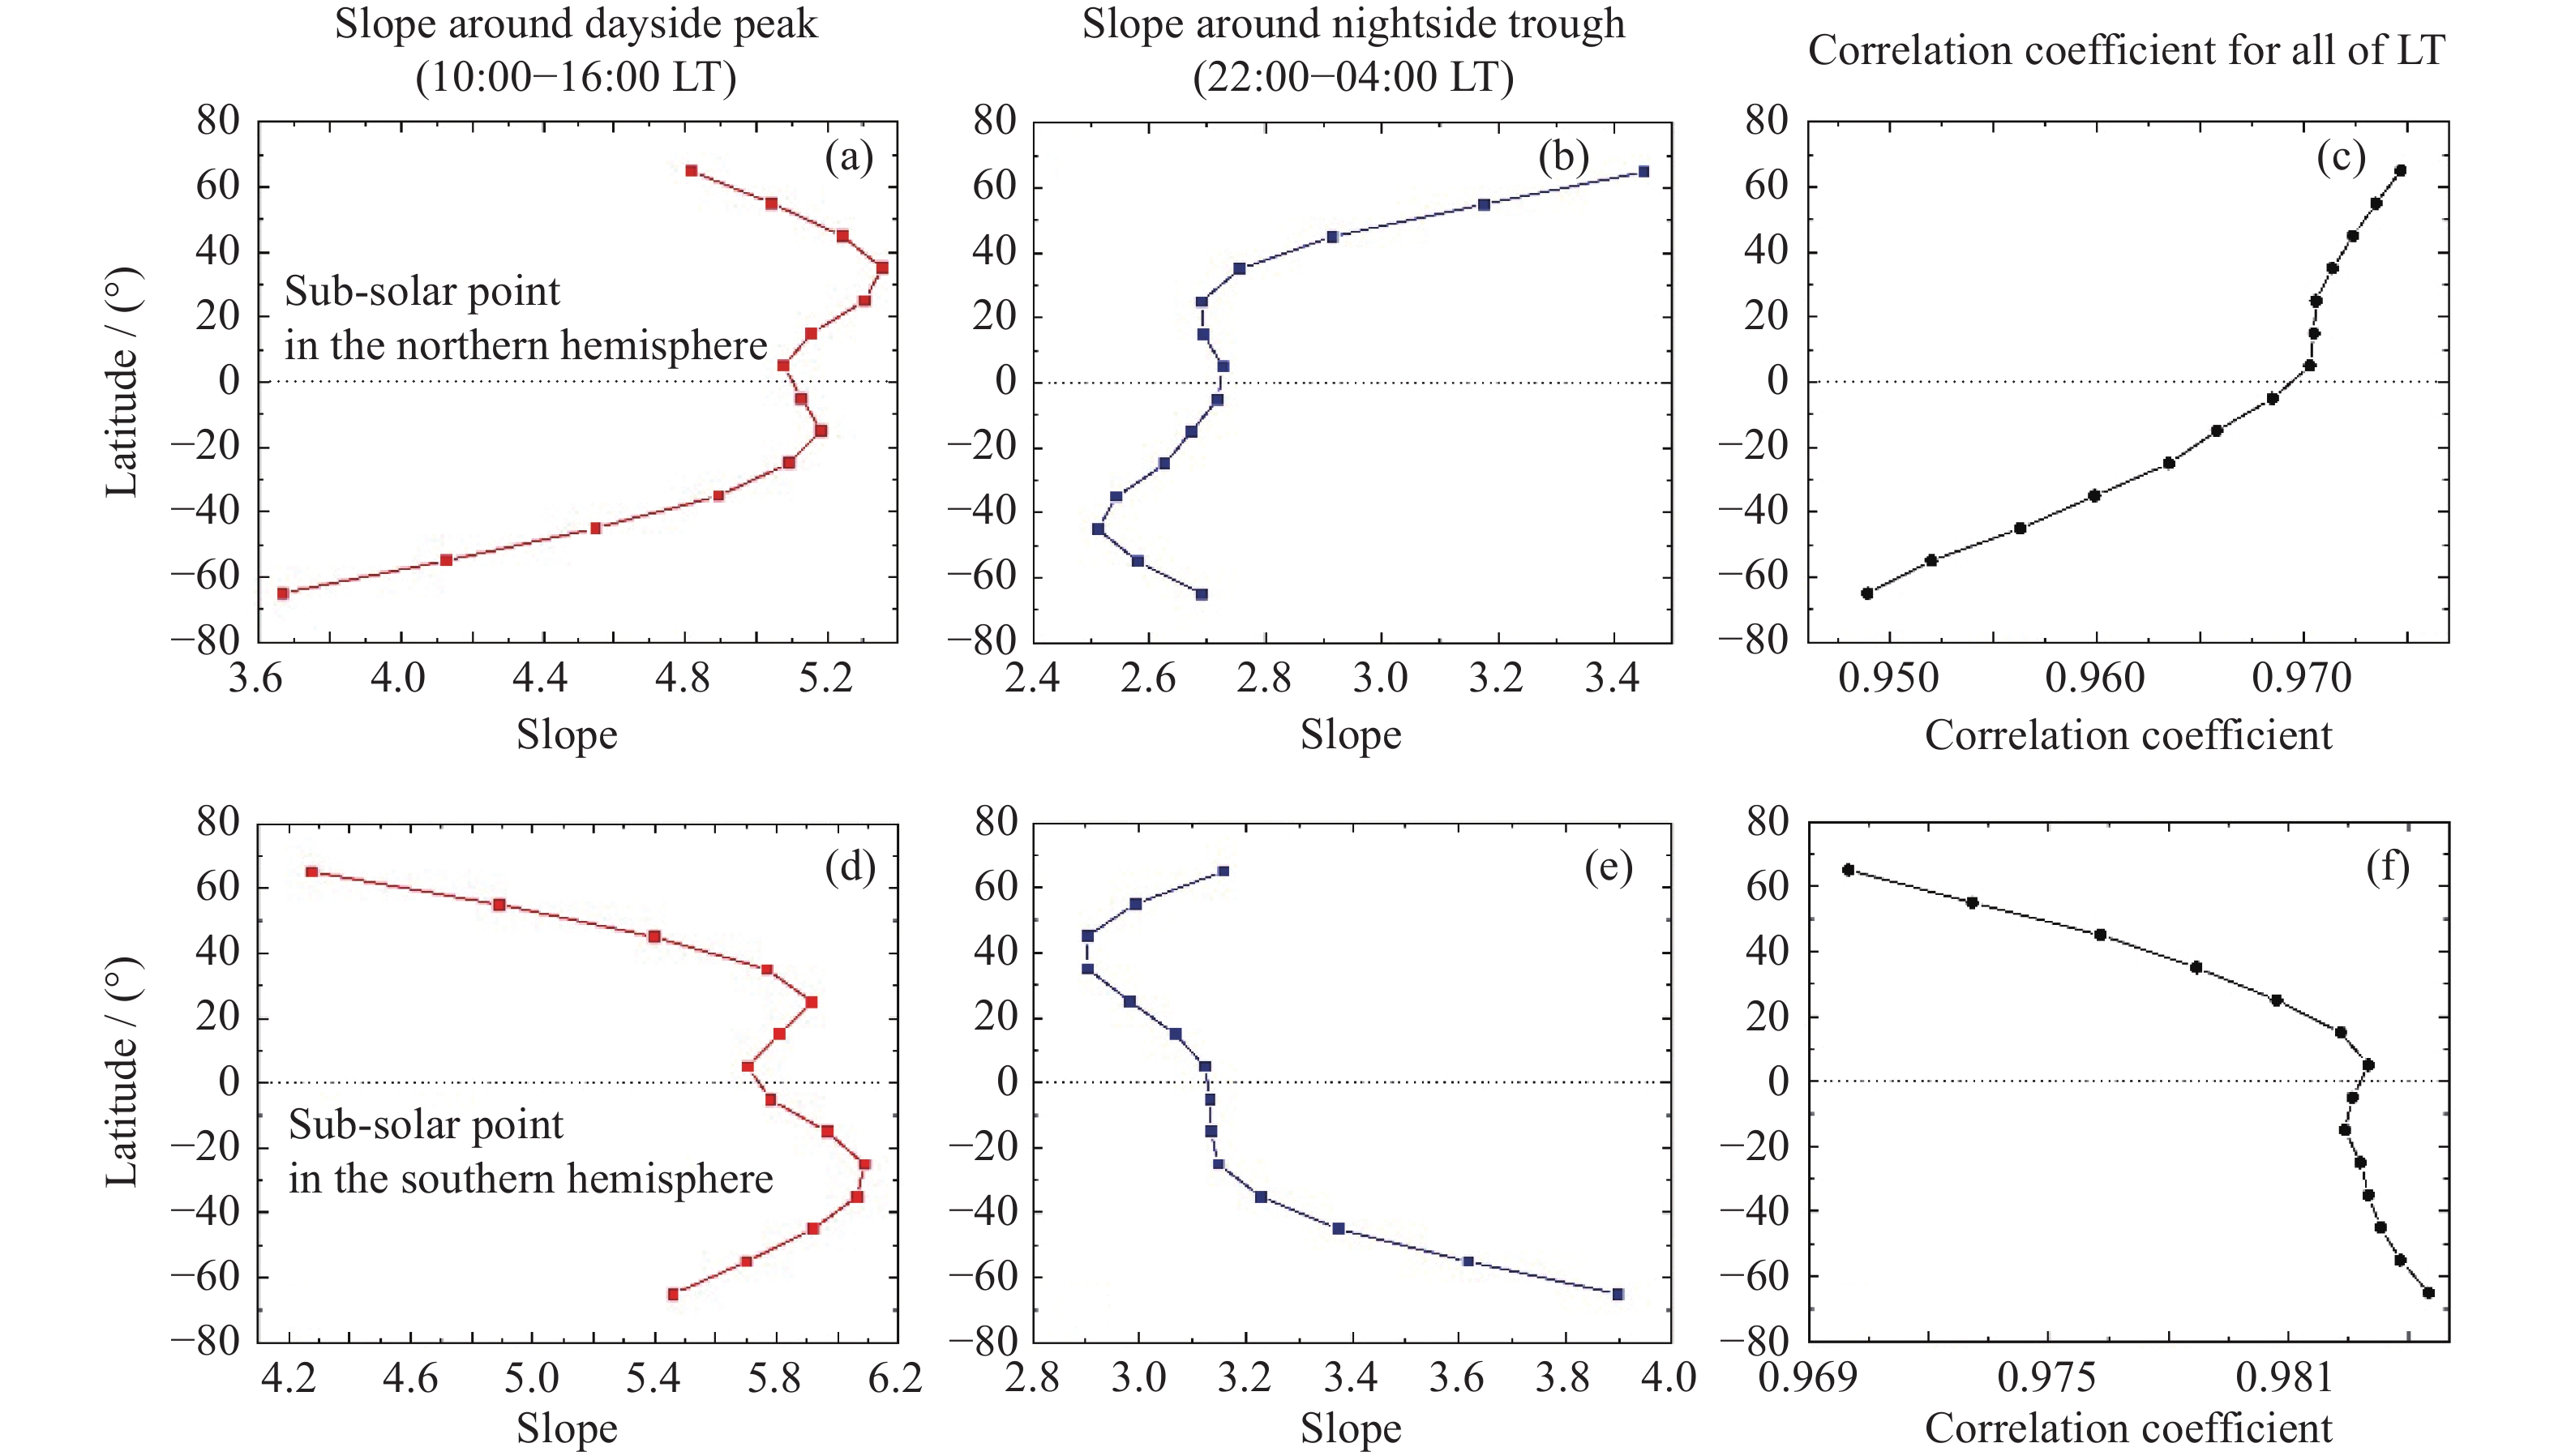
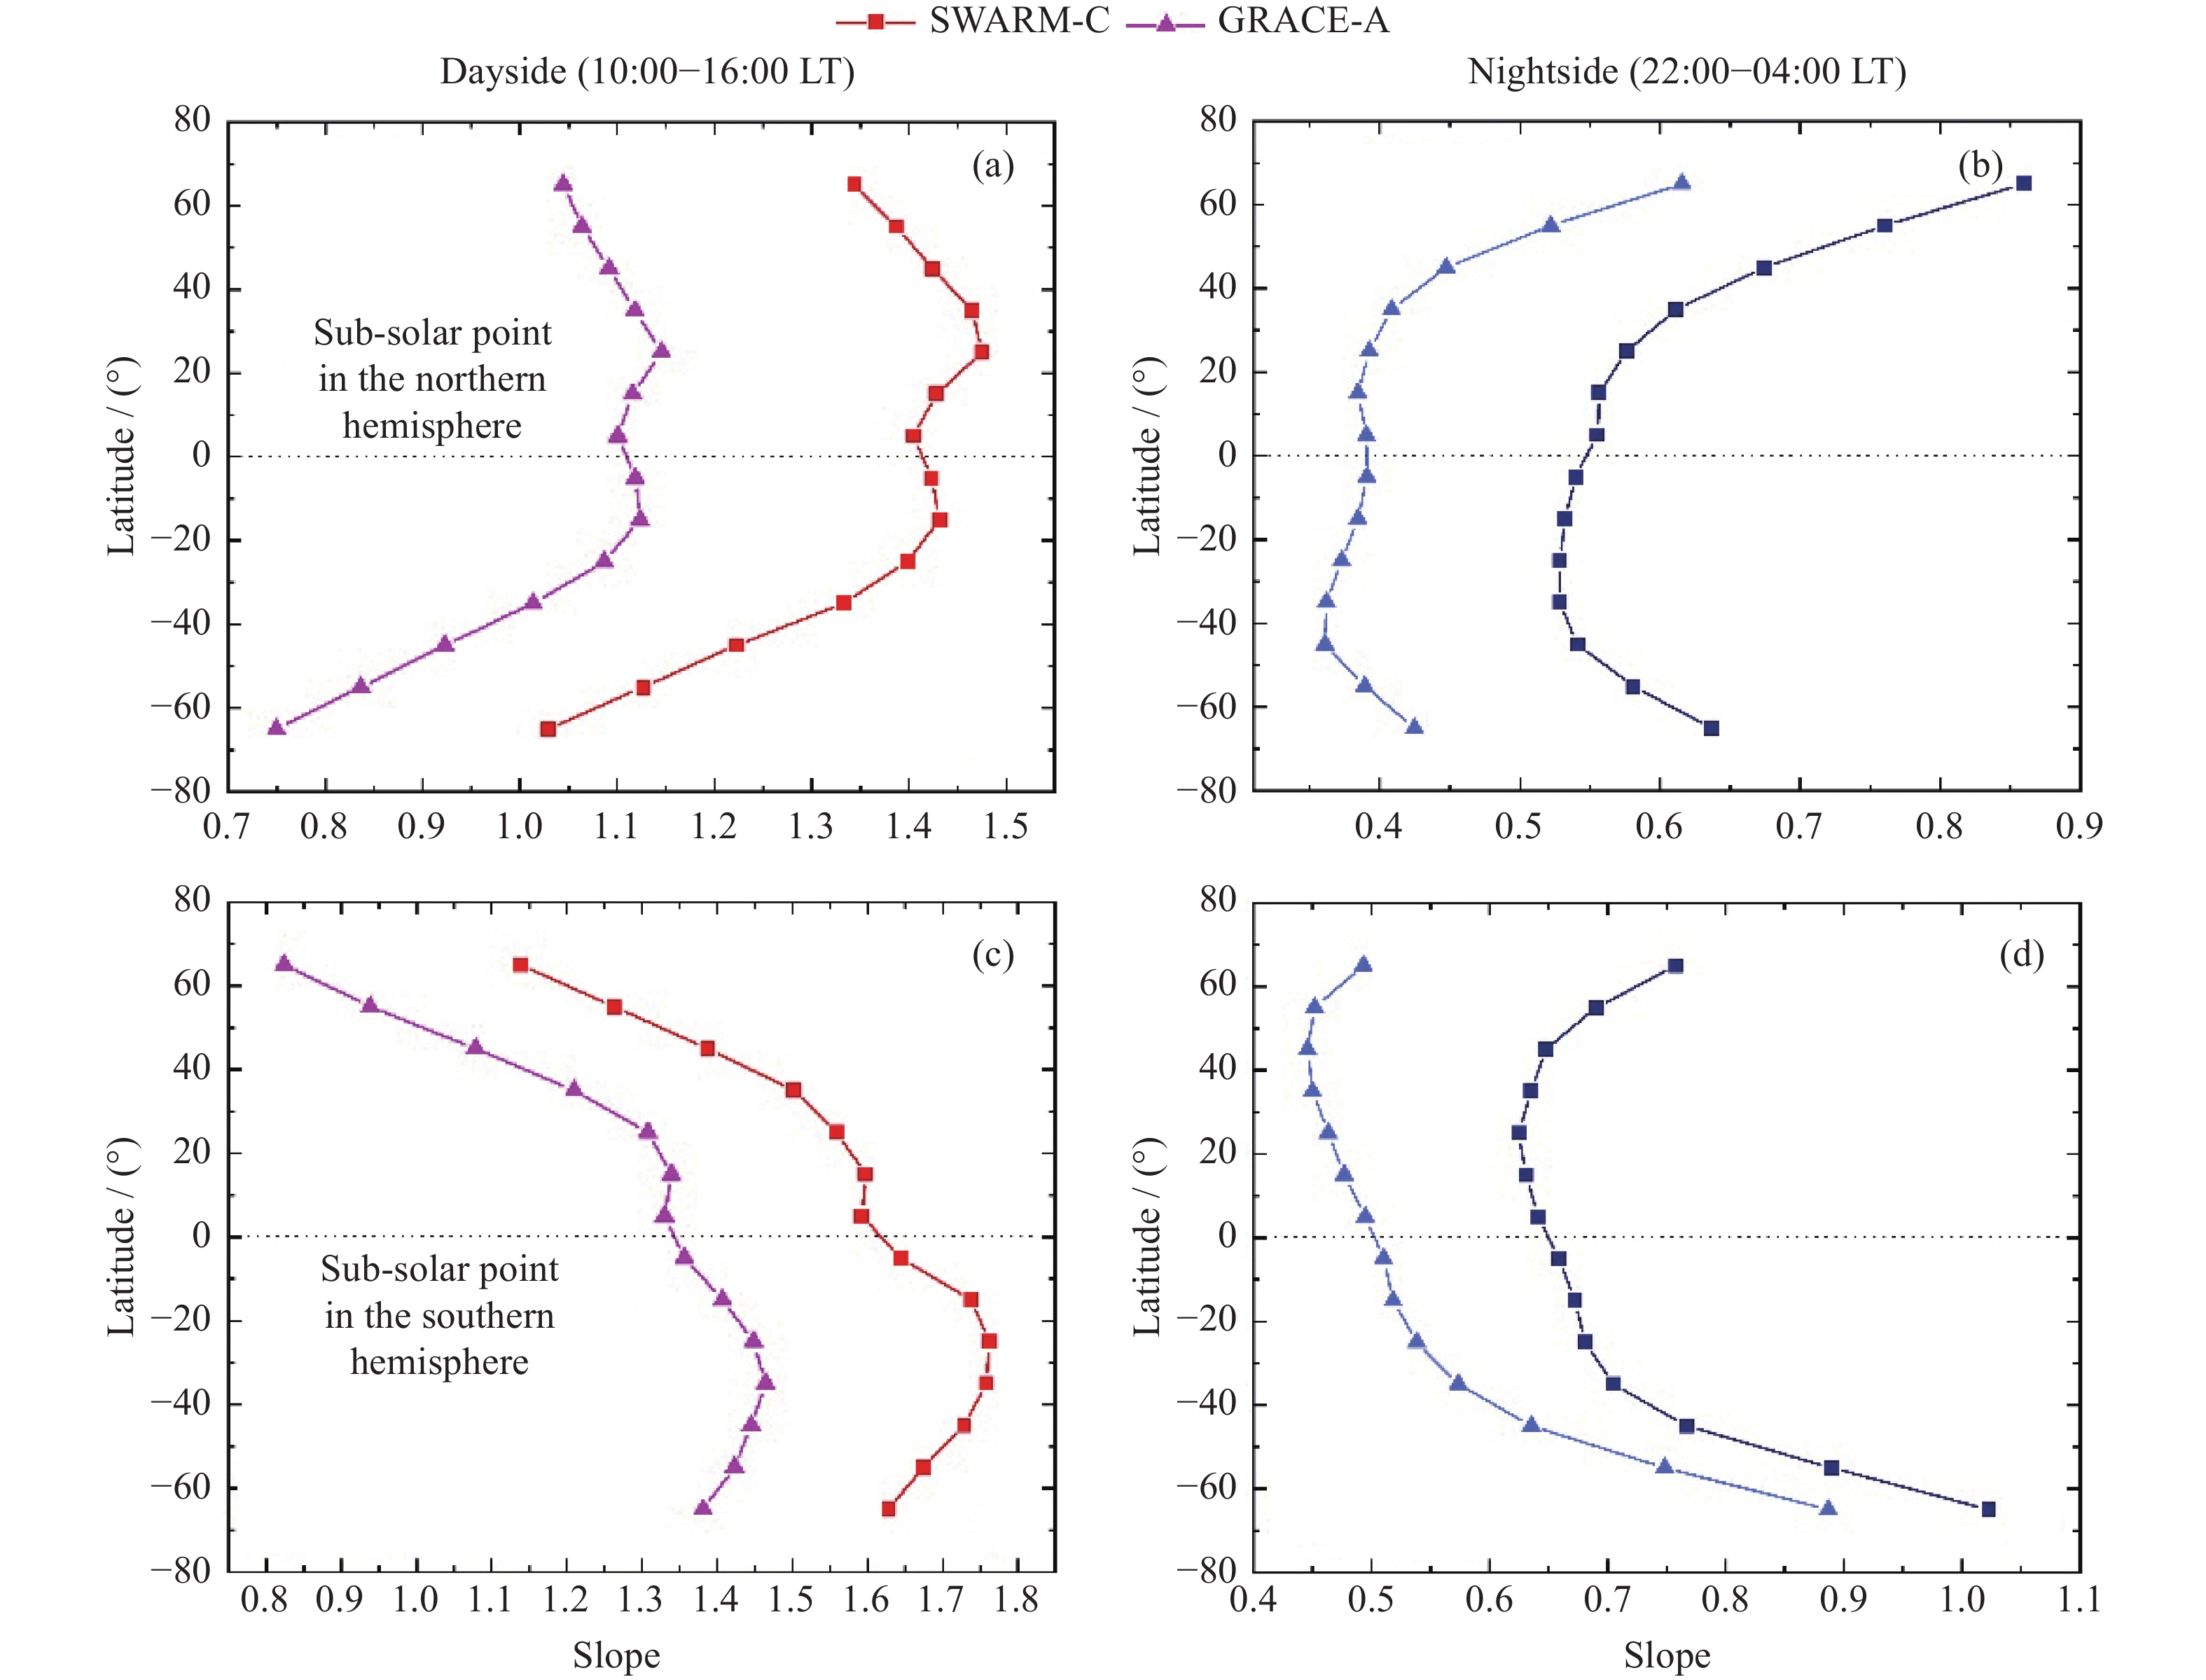
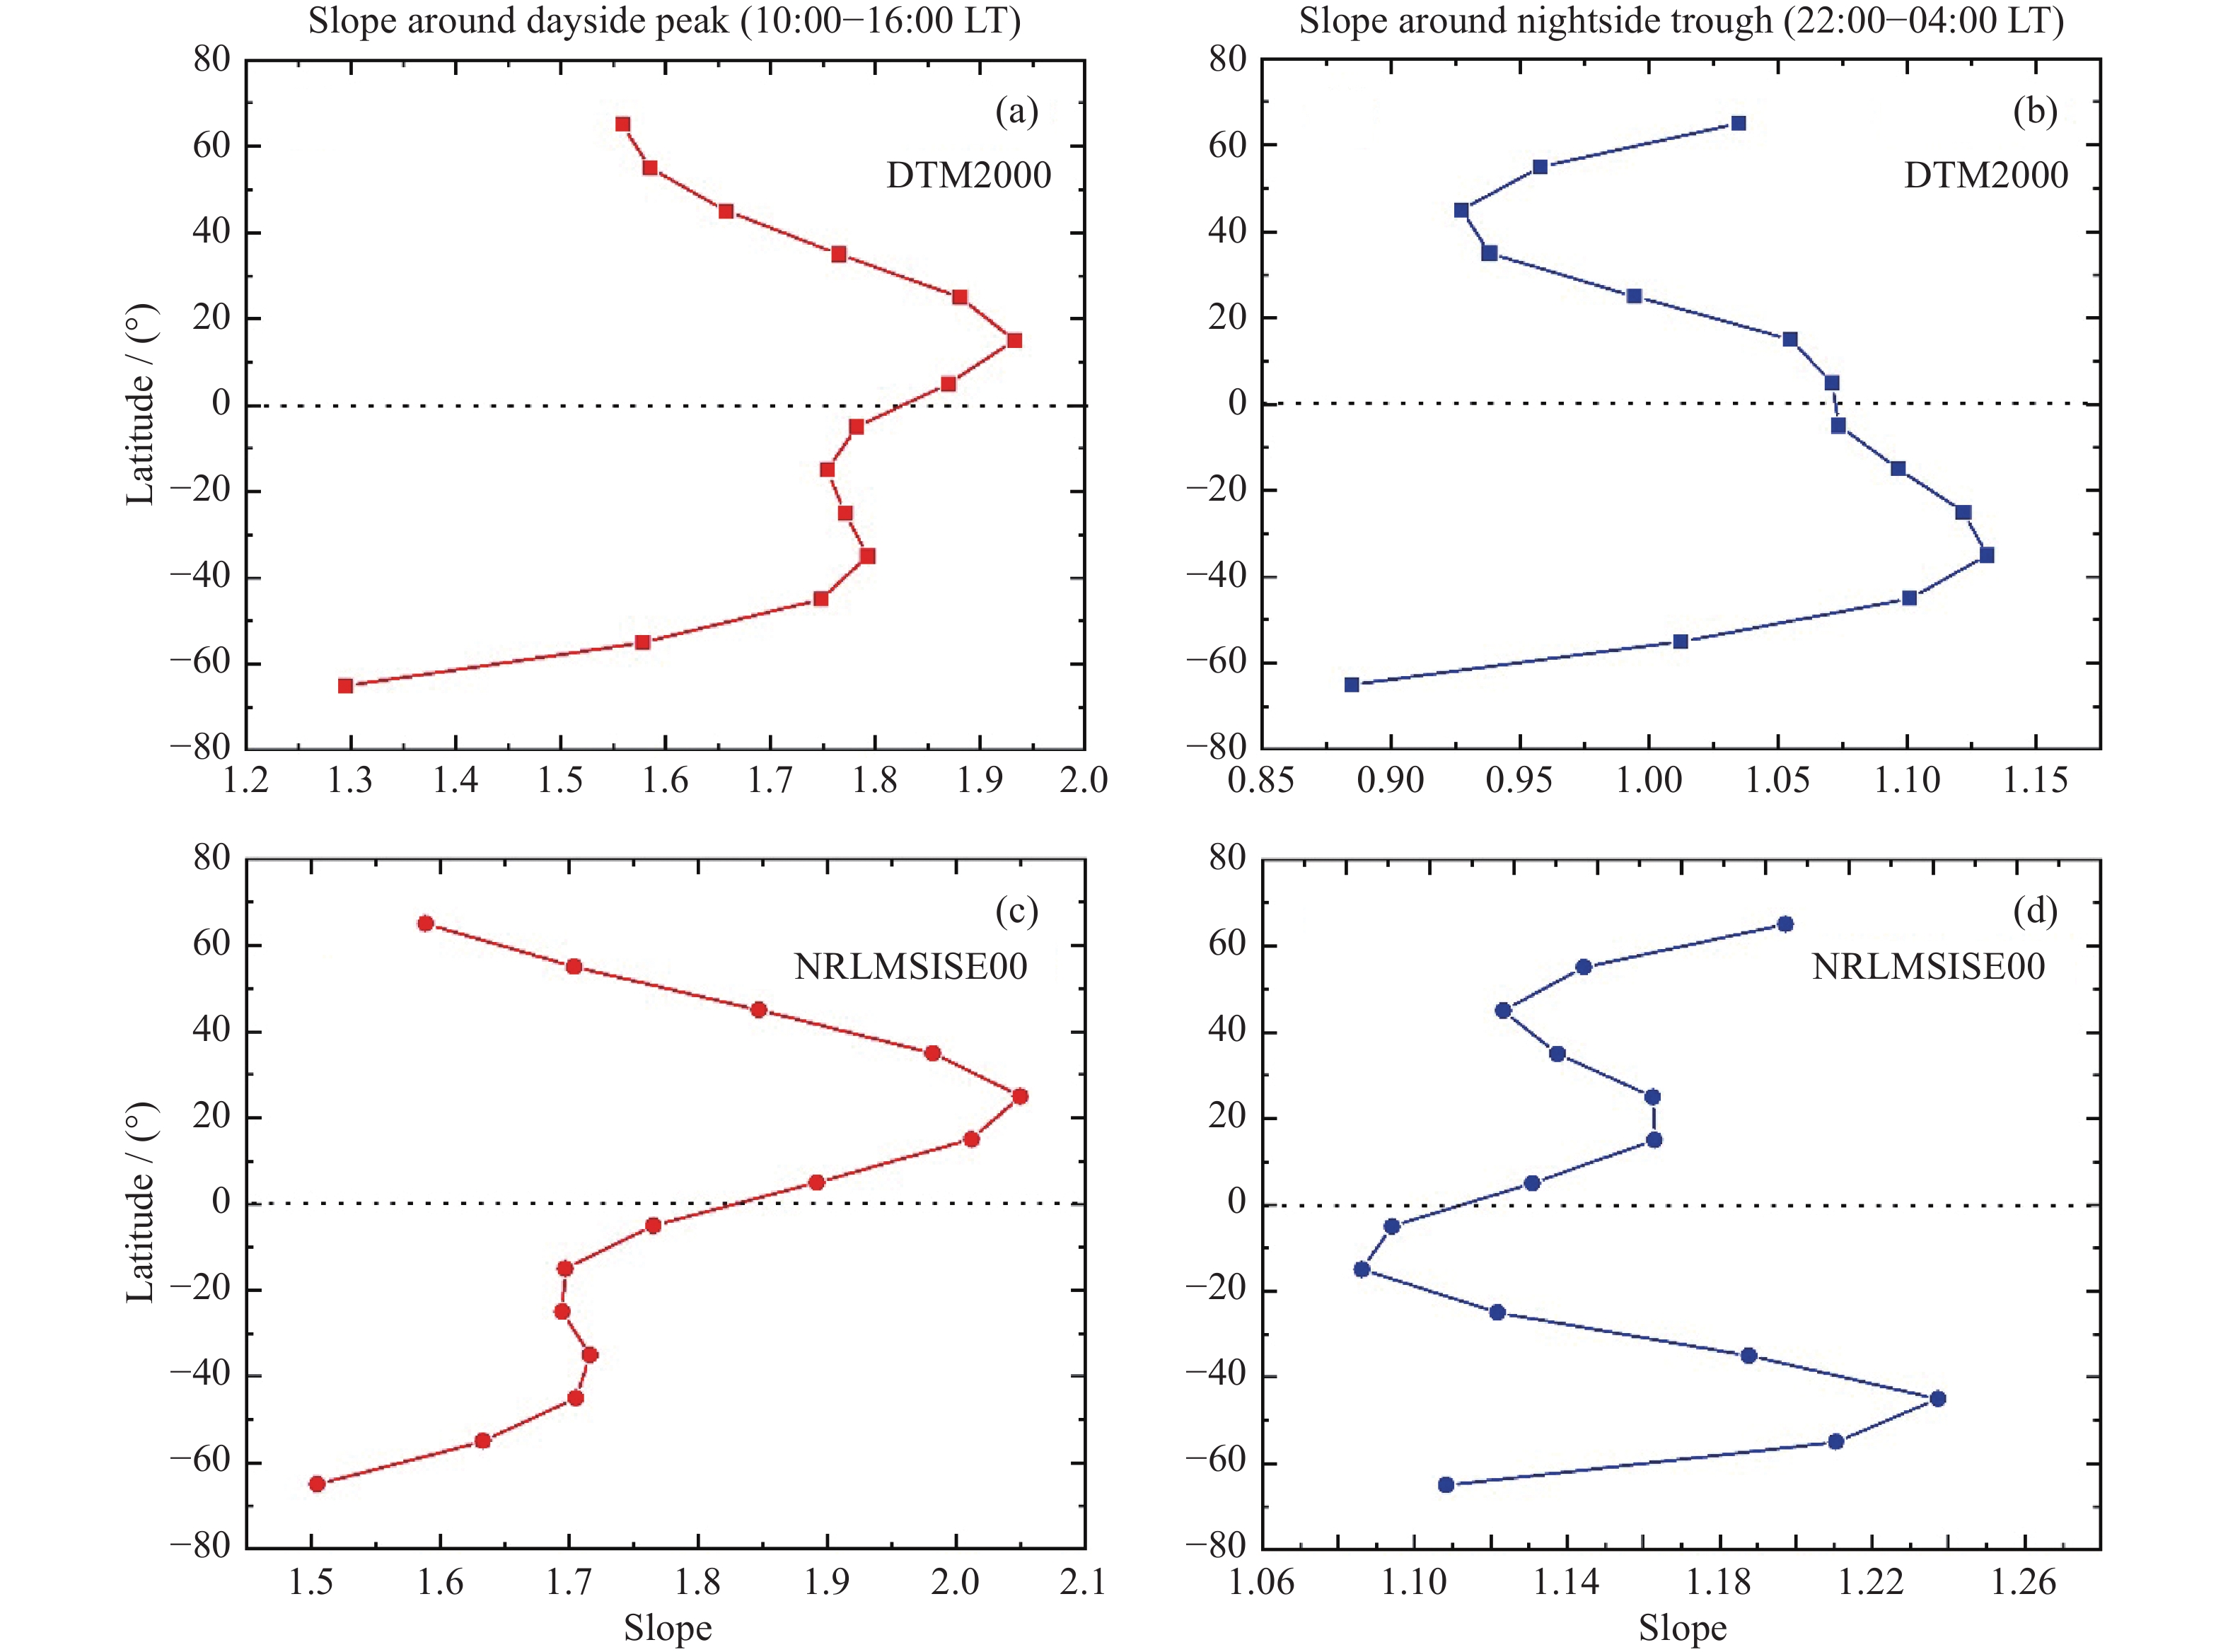
摘要: 对2001-2021年SOHO卫星的极紫外辐射测量数据,以及CHAMP,GRACE-A和SWARM-C卫星资料推导出的高分辨率大气密度数据进行统计分析,发现大气密度与极紫外测量值的相关系数大于密度与F10.7指数的相关系数,证实极紫外辐射在不同地方时的影响程度存在显著差异,从而驱动大气密度的周日变化。利用三颗卫星的高度差异揭示极紫外辐射对大气密度的加热效应在350~500 km范围随着高度增加而减弱。统计得到极紫外辐射影响在地方时和纬度上的空间差异:对夏季半球的影响大于冬季半球;在白天,对中纬度地区的影响高于赤道和高纬度地区;在夜间,密度对辐射的斜率在夏季半球高纬度地区存在峰值,在冬季半球中纬度存在谷值,模型DTM2000和NRLMSISE00未能准确刻画。为了改进经验模型,提出基于球谐函数的拟合方法,优于主流模型周日效应采用的表达式,对周日效应建模和修正提供有益借鉴。利用昼夜间能量传输和热层大气经向环流机制探讨了统计结果的物理机制。Abstract: The Solar Extreme Ultraviolet (EUV) radiation is well known as the major source of energy of driving the Earth atmospheric motion and transformation. The 10.7 cm solar radio flux (F10.7) instead of EUV measurement is often used in the thermospheric neutral density models, to calculate the thermosphere density and temperature. In this paper, the continuous measurements of EUV from SEM instruments onboard the SOHO satellite during 2001-2021 are directly compared with the densities derived from accelerometers onboard the CHAMP, GRACE-A and SWARM-C satellites, to reveal the essential relation between the solar EUV radiation and the thermosphere density. It is found that the correlation coefficients between the EUV data and the densities are obviously greater than those between the F10.7 indexes and the densities, which proves that the solar EUV radiation is the dominant energy source of heating the thermosphere rather than the radio radiation. From the liner regression slopes at different local time, it is shown that the maximum value occurs at 15:00 LT (corresponding to 14:00-16:00 LT), while the minimum value at 01:00 LT (00:00-02:00 LT), which confirms that the EUV radiation derives the diurnal variation of the thermosphere. According to the statistical results from three satellites with different orbital altitudes, it is indicated that in the 350~500 km altitude region, the heating effect of the EUV radiation at lower altitude is more intense than that at higher altitude (considering absolute variation). Because of the high spatial resolution of the observation of three satellites, the difference in the effect of the EUV radiation at various local time and geographic latitudes can be concluded: the slope in summer hemisphere is greater than that in winter hemisphere; in the dayside, the slope at the mid-latitudes is greater than that at the equator and high latitudes; in the nightside, the maximum of the slope appears at the high latitude of summer hemisphere, which is not described by the thermosphere models such as DTM2000 and NRLMSISE00 yet. In order to improve the modeling of the effect of the EUV radiation, the fitting method of six-order spherical harmonics is proposed. Compared with the formulas of the present models, the spherical harmonics are more valuable in improving the model construction or correction of the EUV effect and the thermosphere diurnal variation. At last, the physical mechanism of statistical results is discussed by considering the energy transmission and meridional circulation in the thermosphere.
-

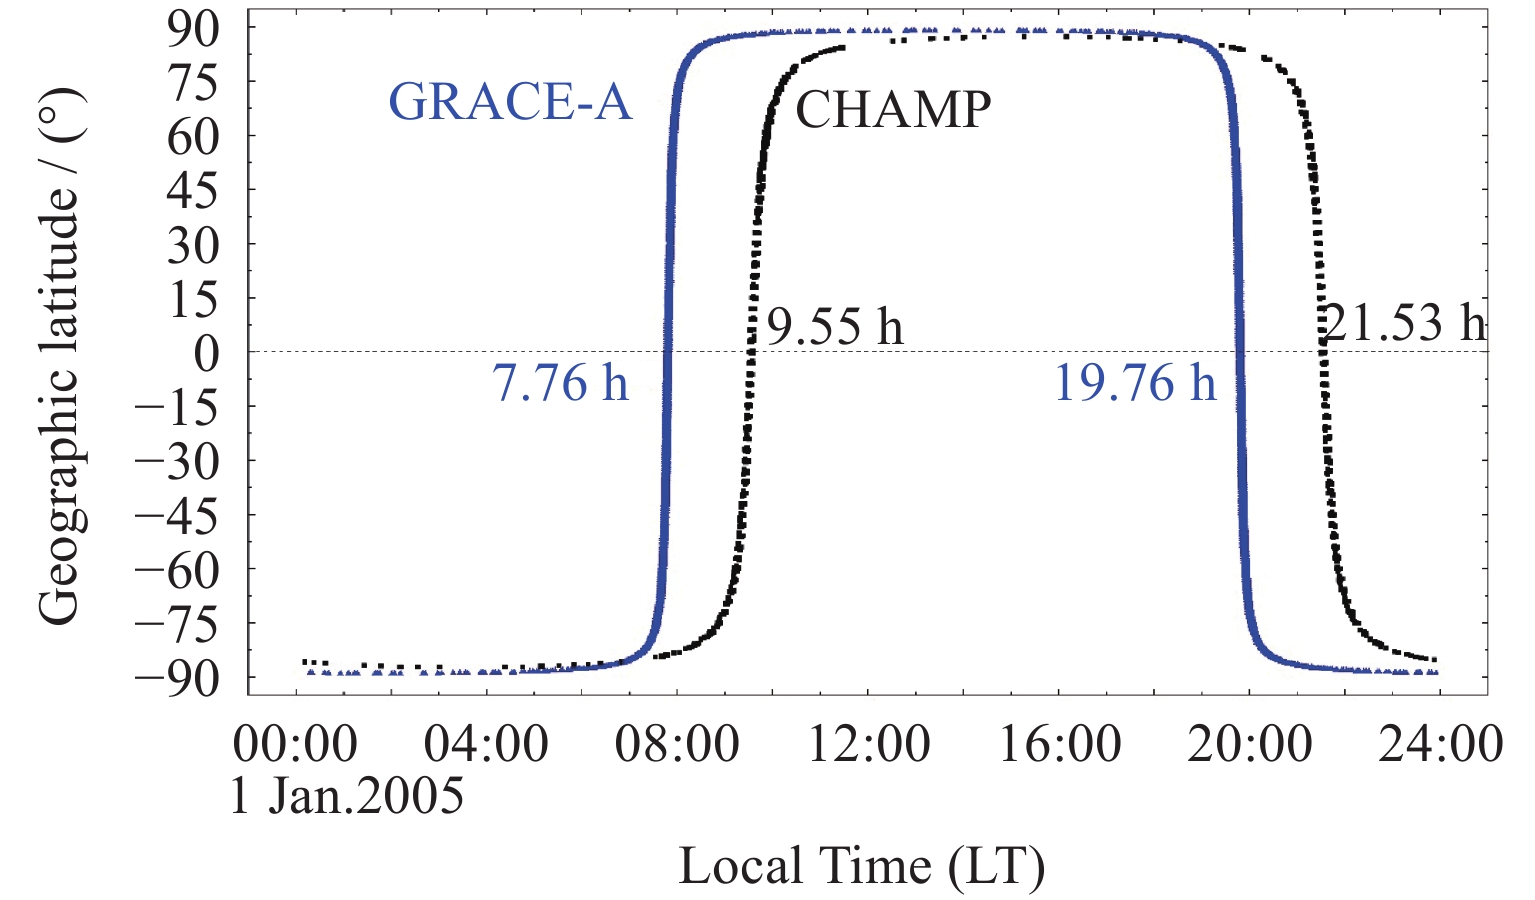
图 1 CHAMP和GRACE-A星下点地方时轨迹分布
Figure 1. Sub-satellite point trajectory of CHAMP and GRACE-A
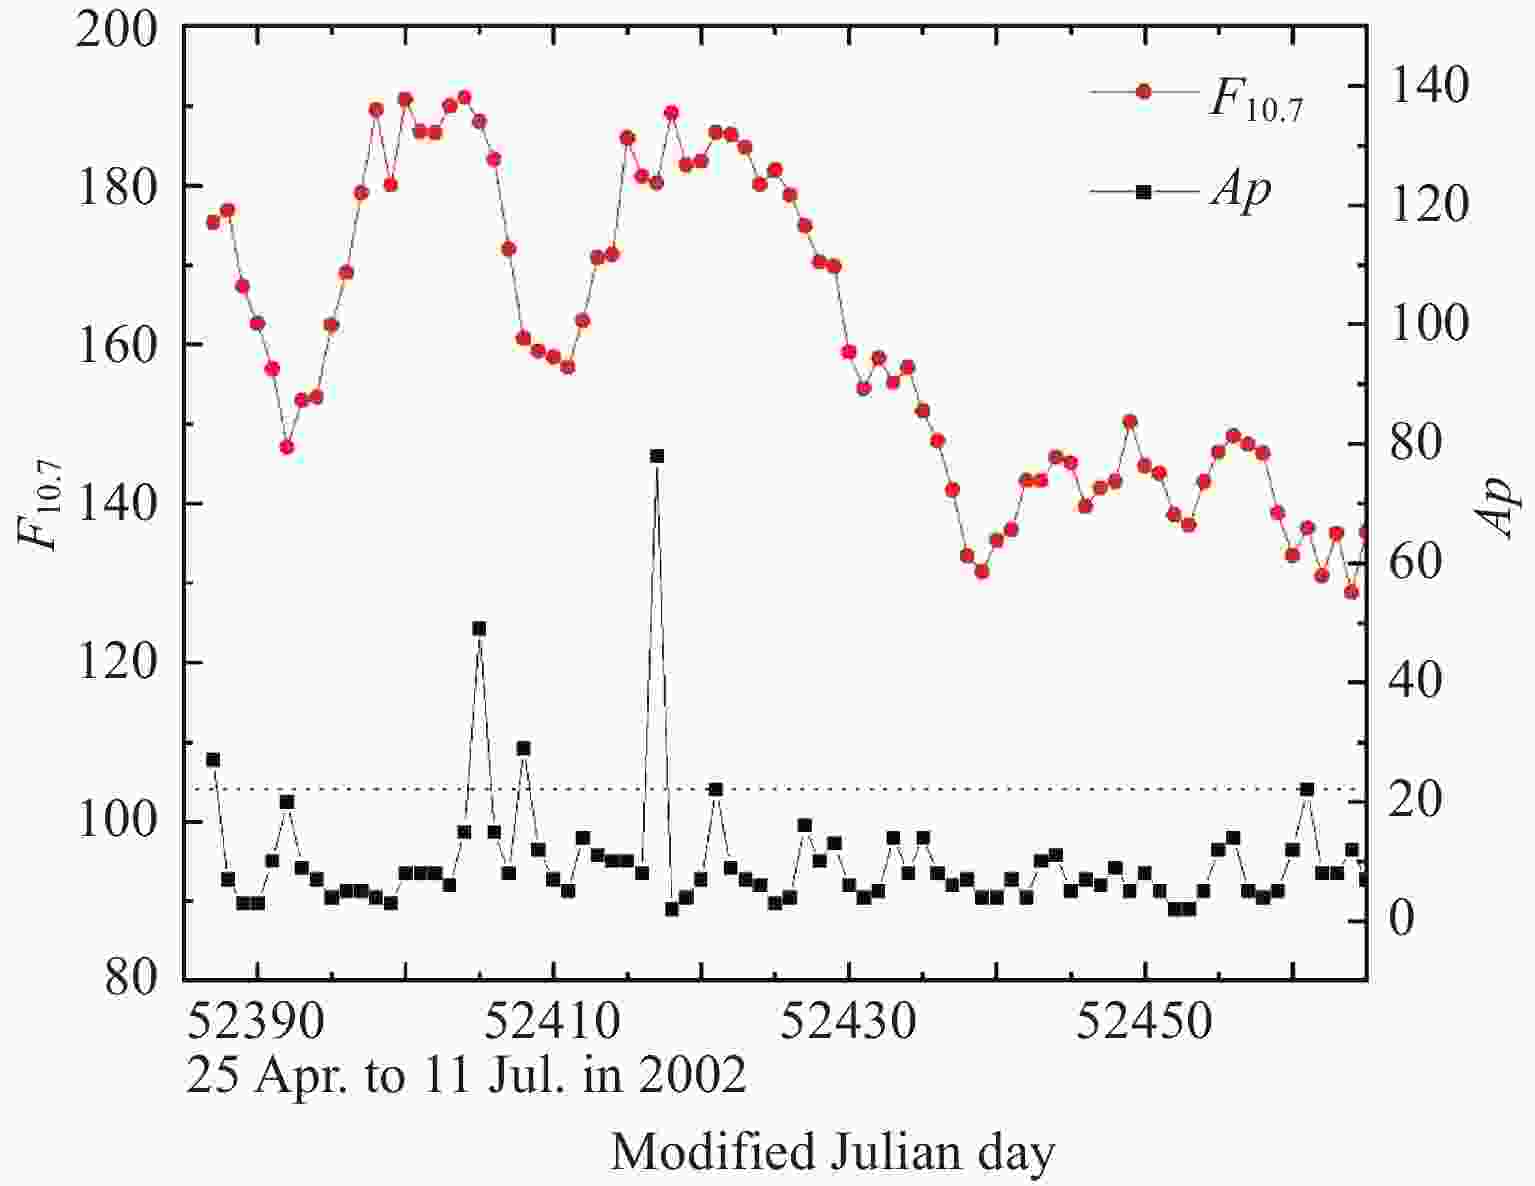
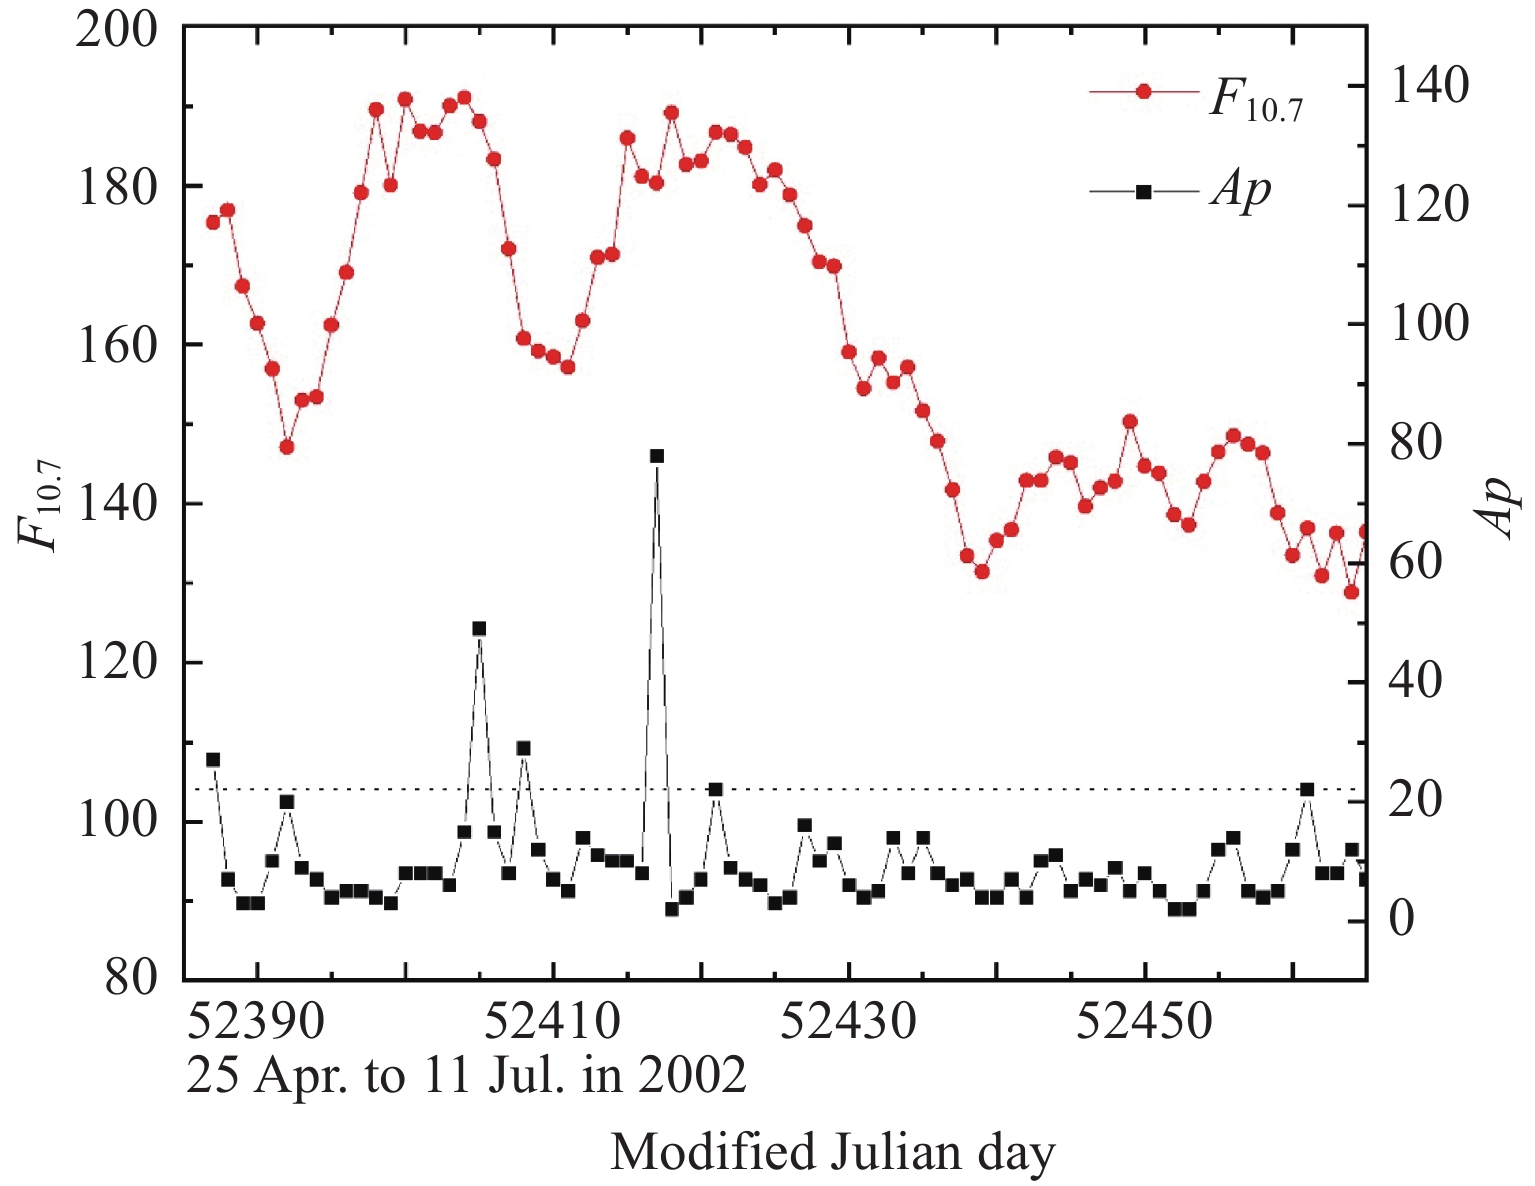
图 2 太阳射电辐射F10.7与日平均地磁Ap指数的变化
Figure 2. Solar radio index F10.7 and geomagnetic index daily Ap
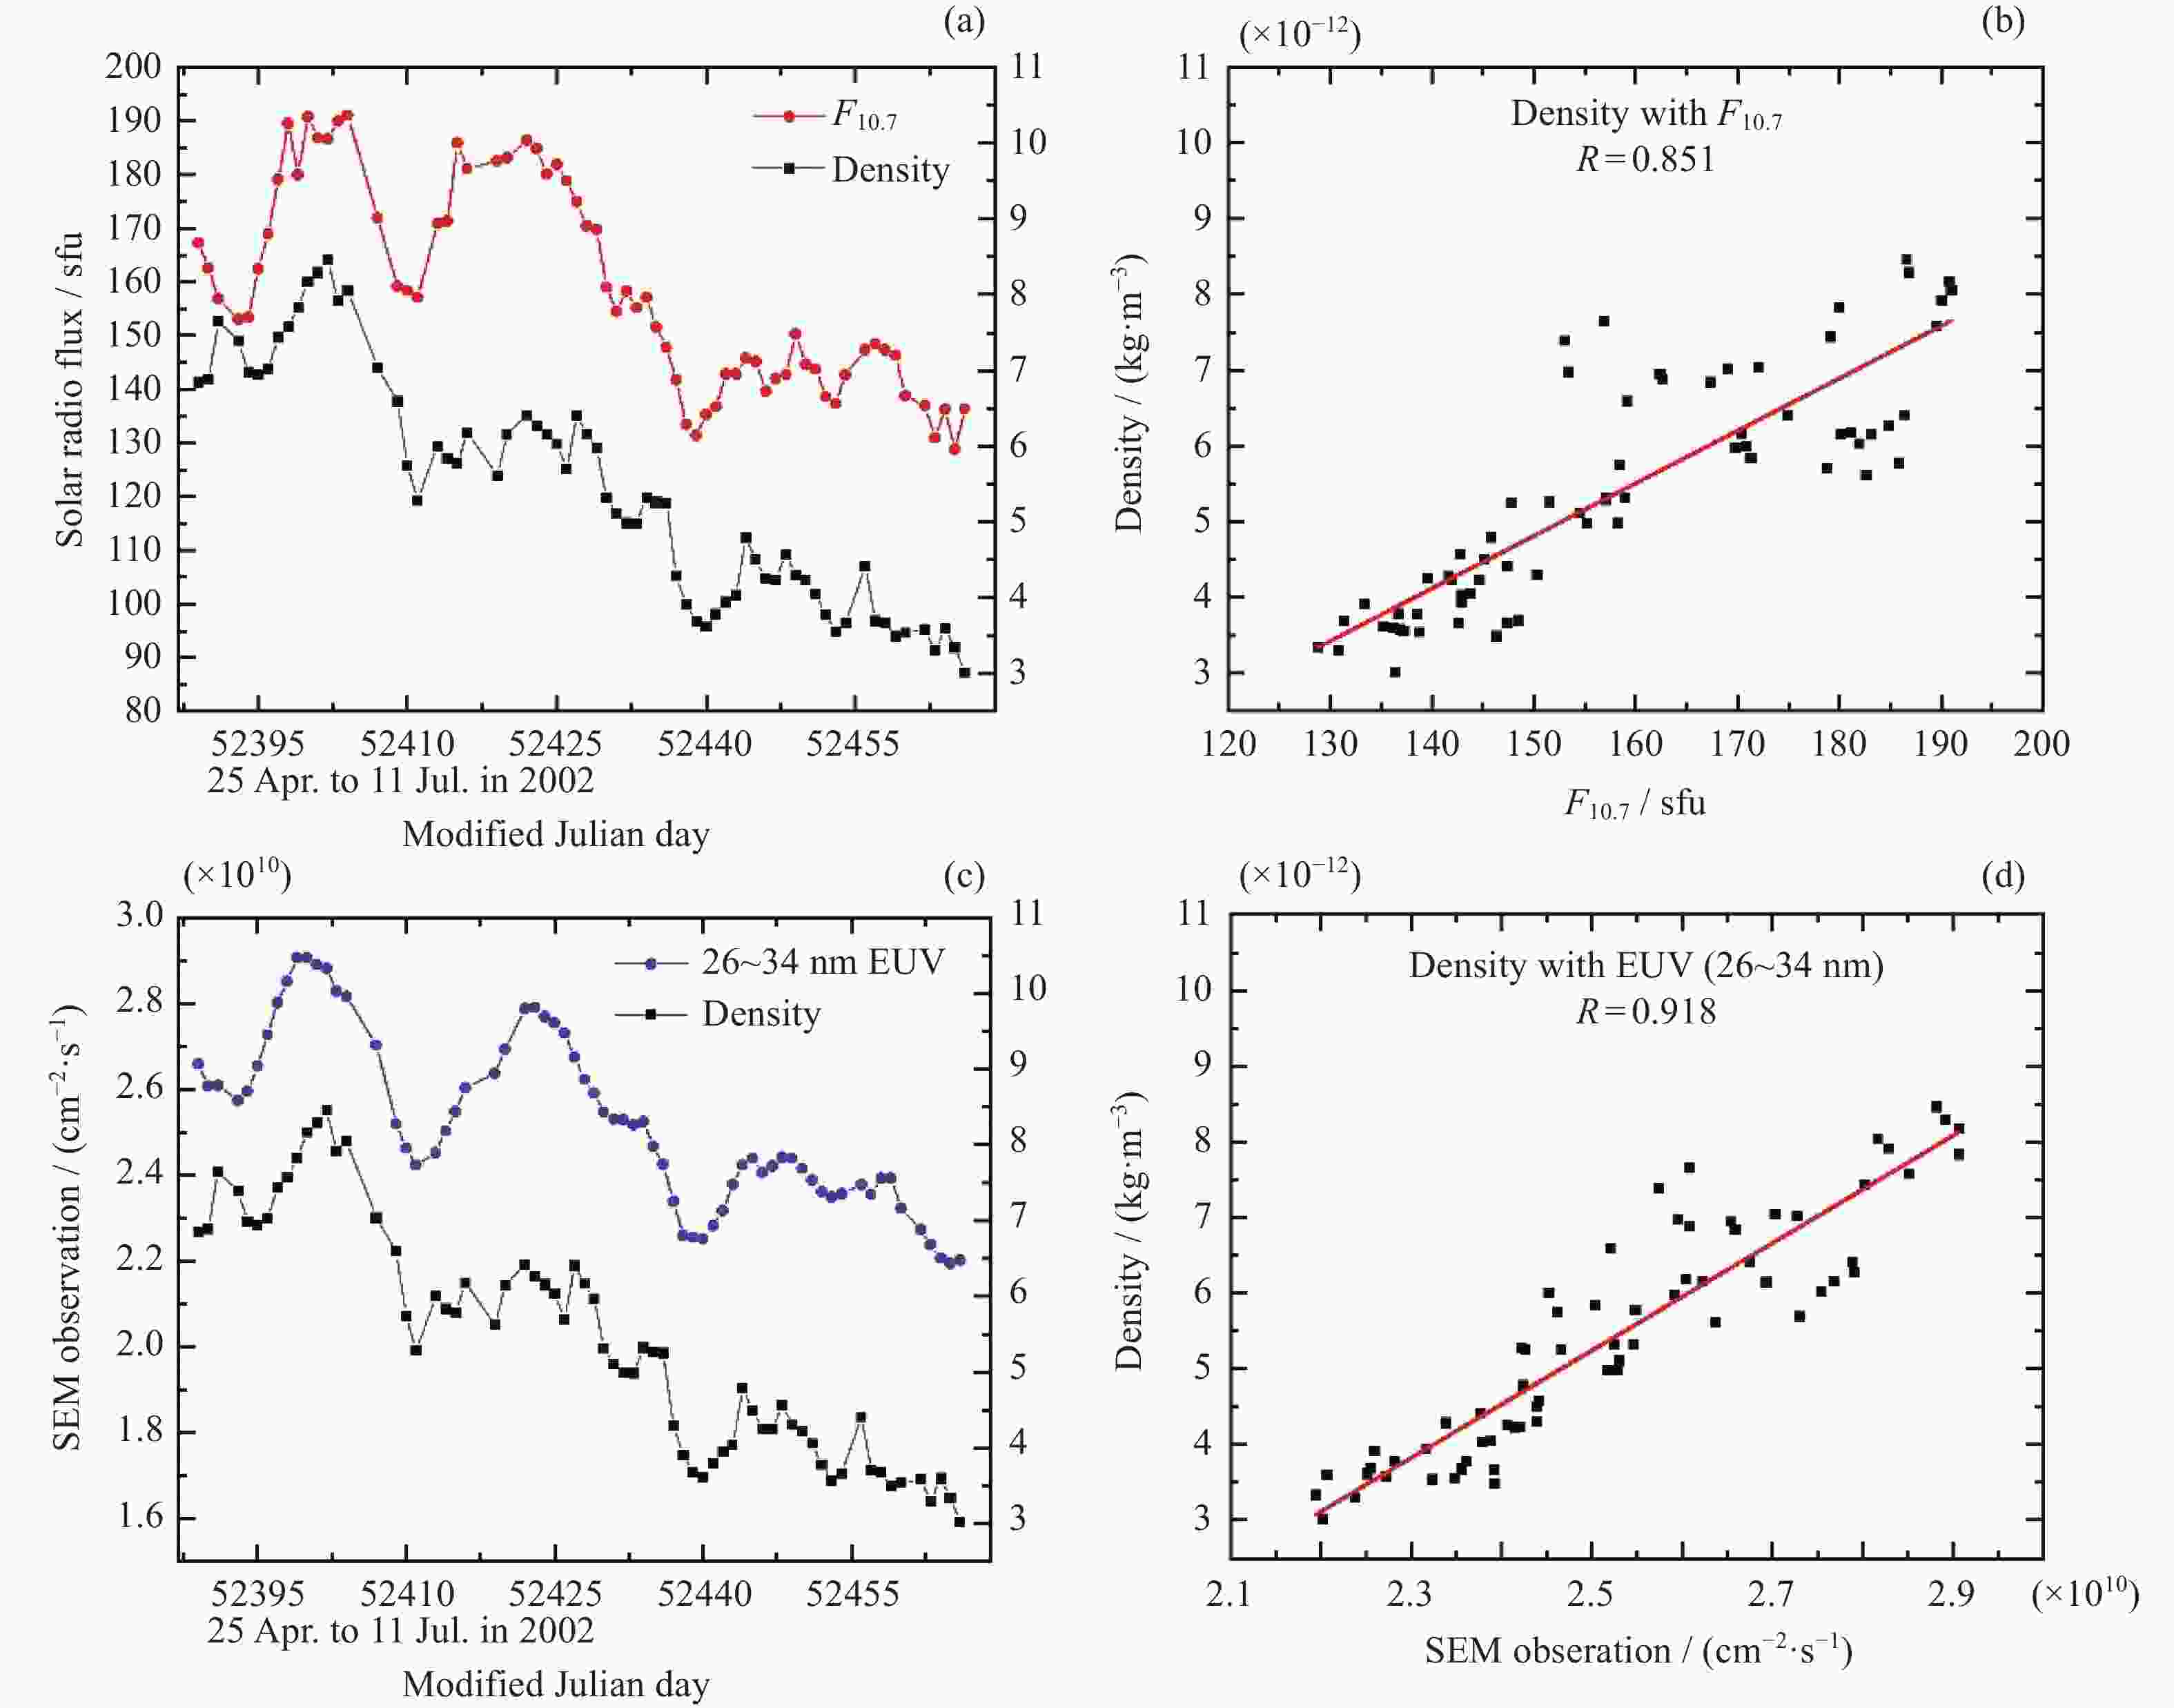
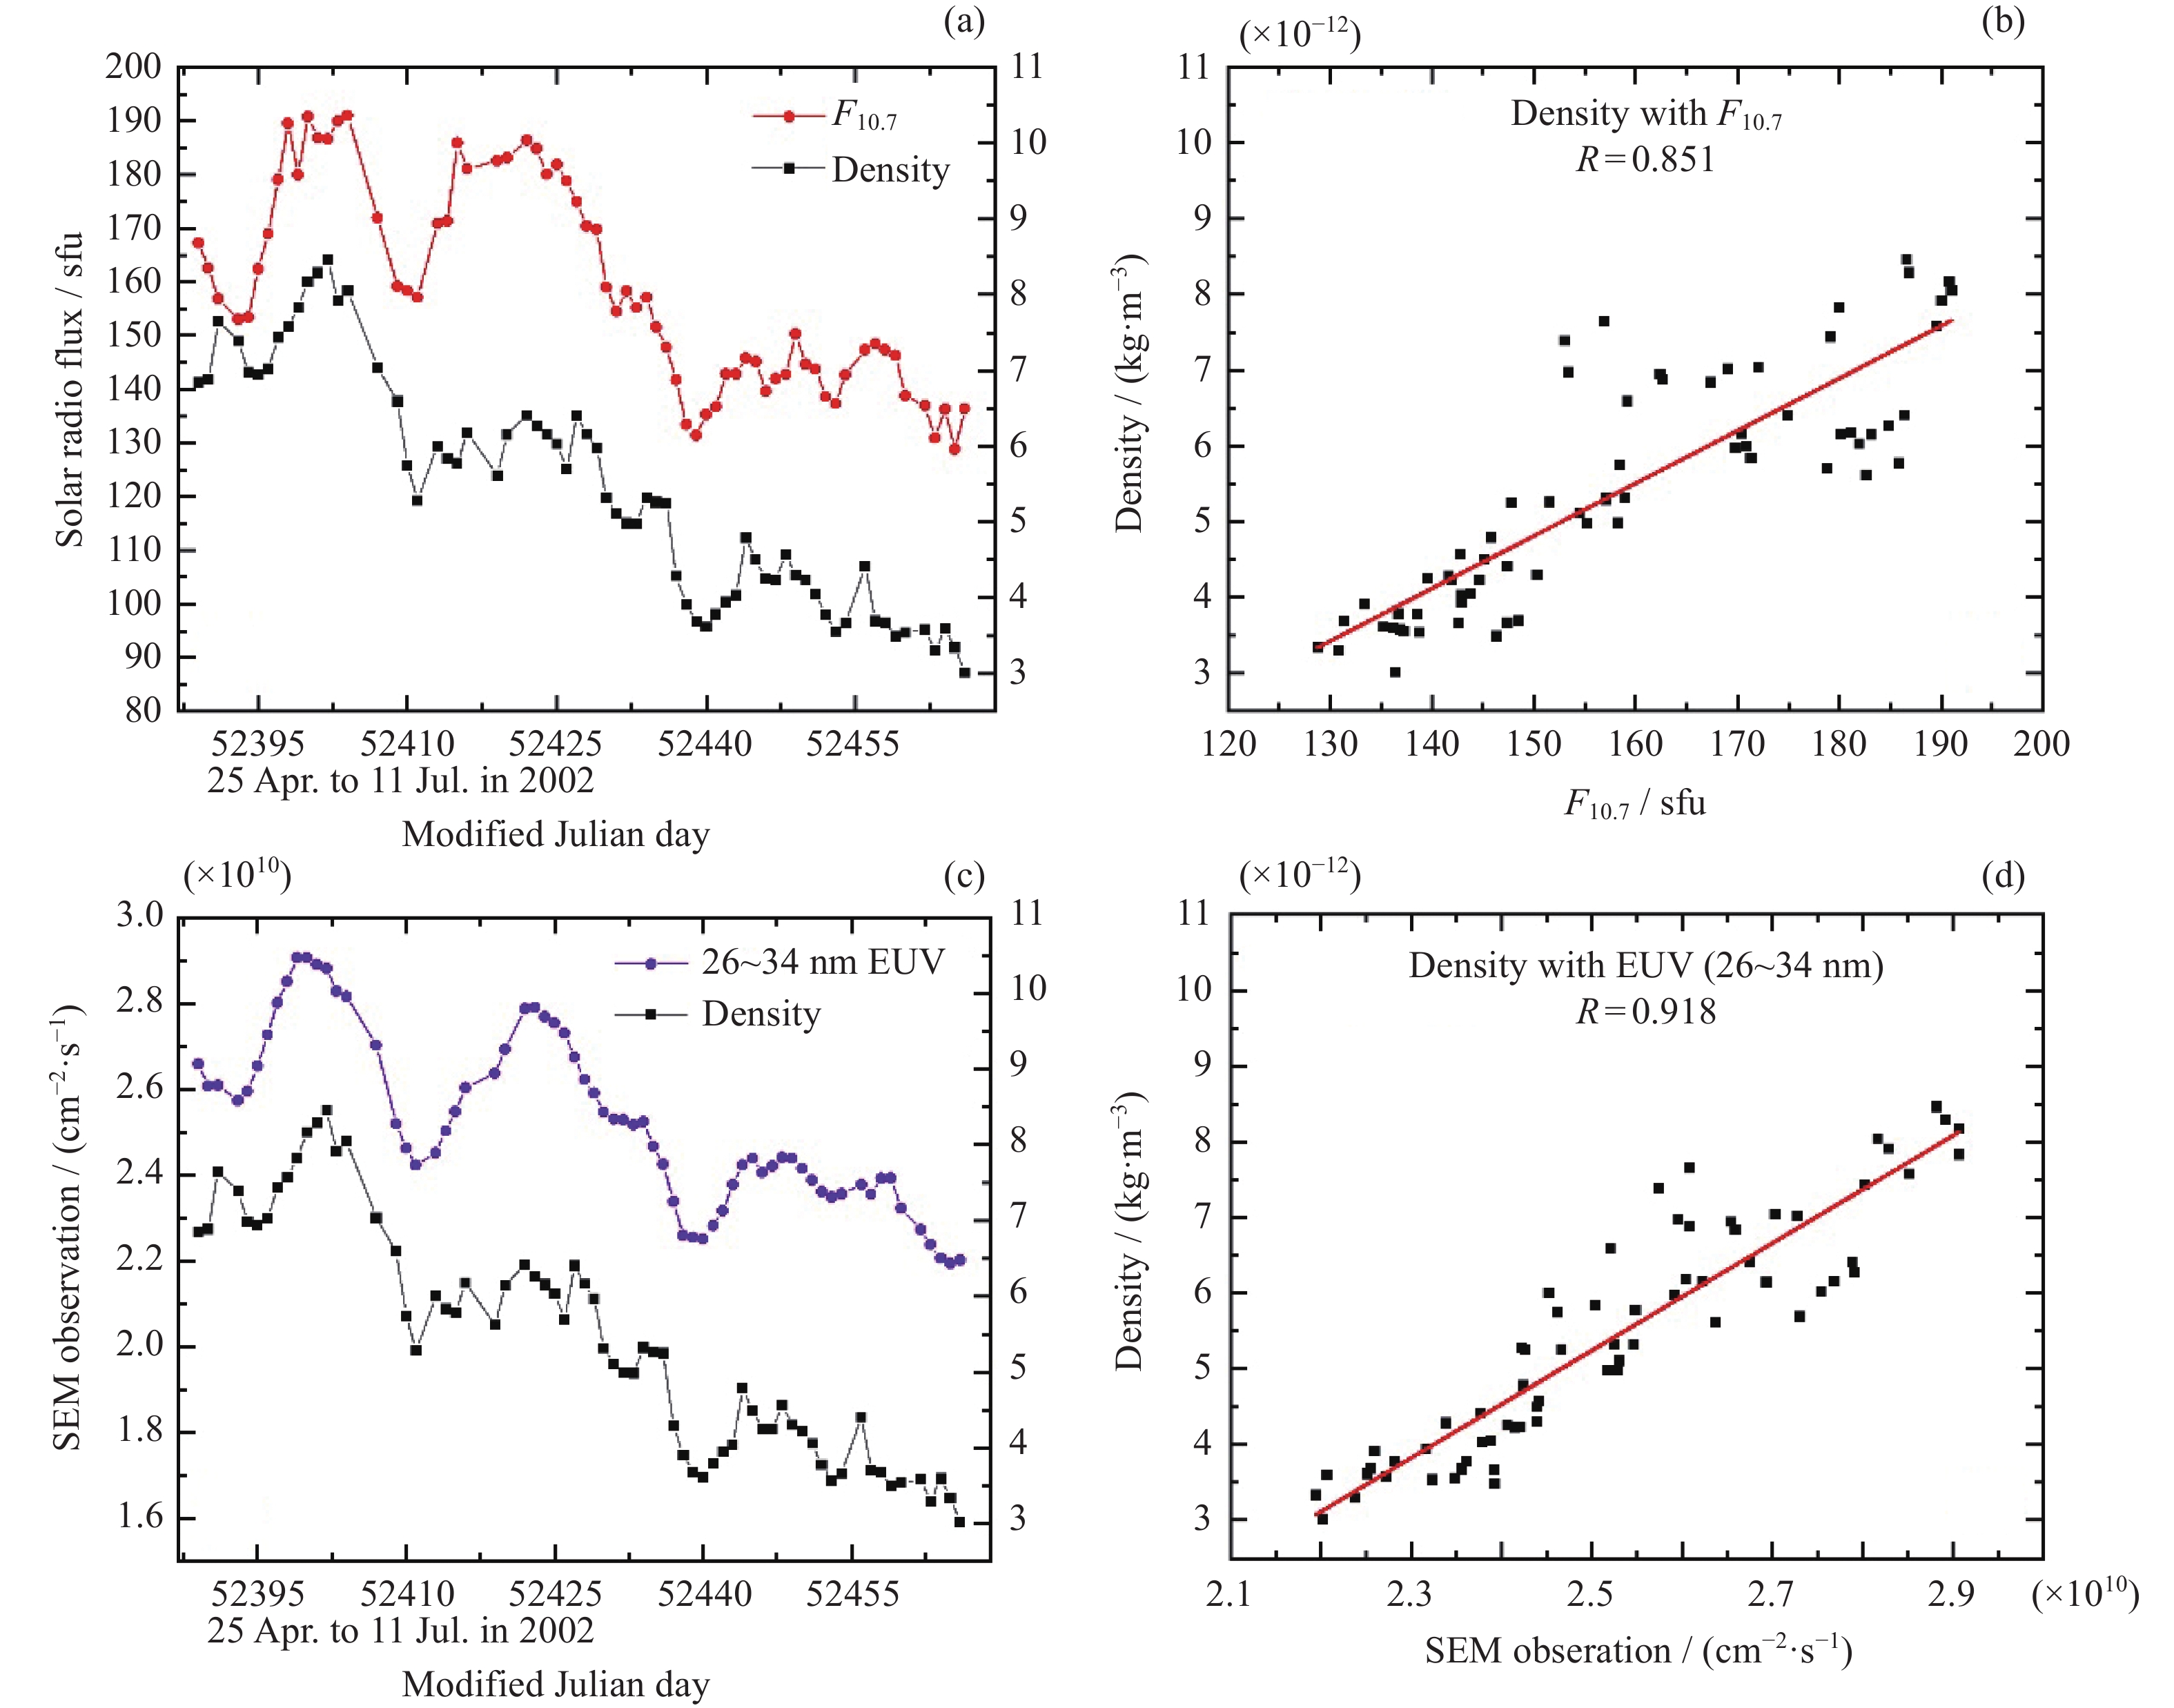
图 3 CHAMP卫星记录大气密度变化与射电辐射指数F10.7和26~34 nm极紫外辐射测量值的相关性分析
Figure 3. Correlation analysis by comparing densities variation observed by CHAMP with the solar radio index F10.7 and EUV measurements at 26~34 nm wavelength

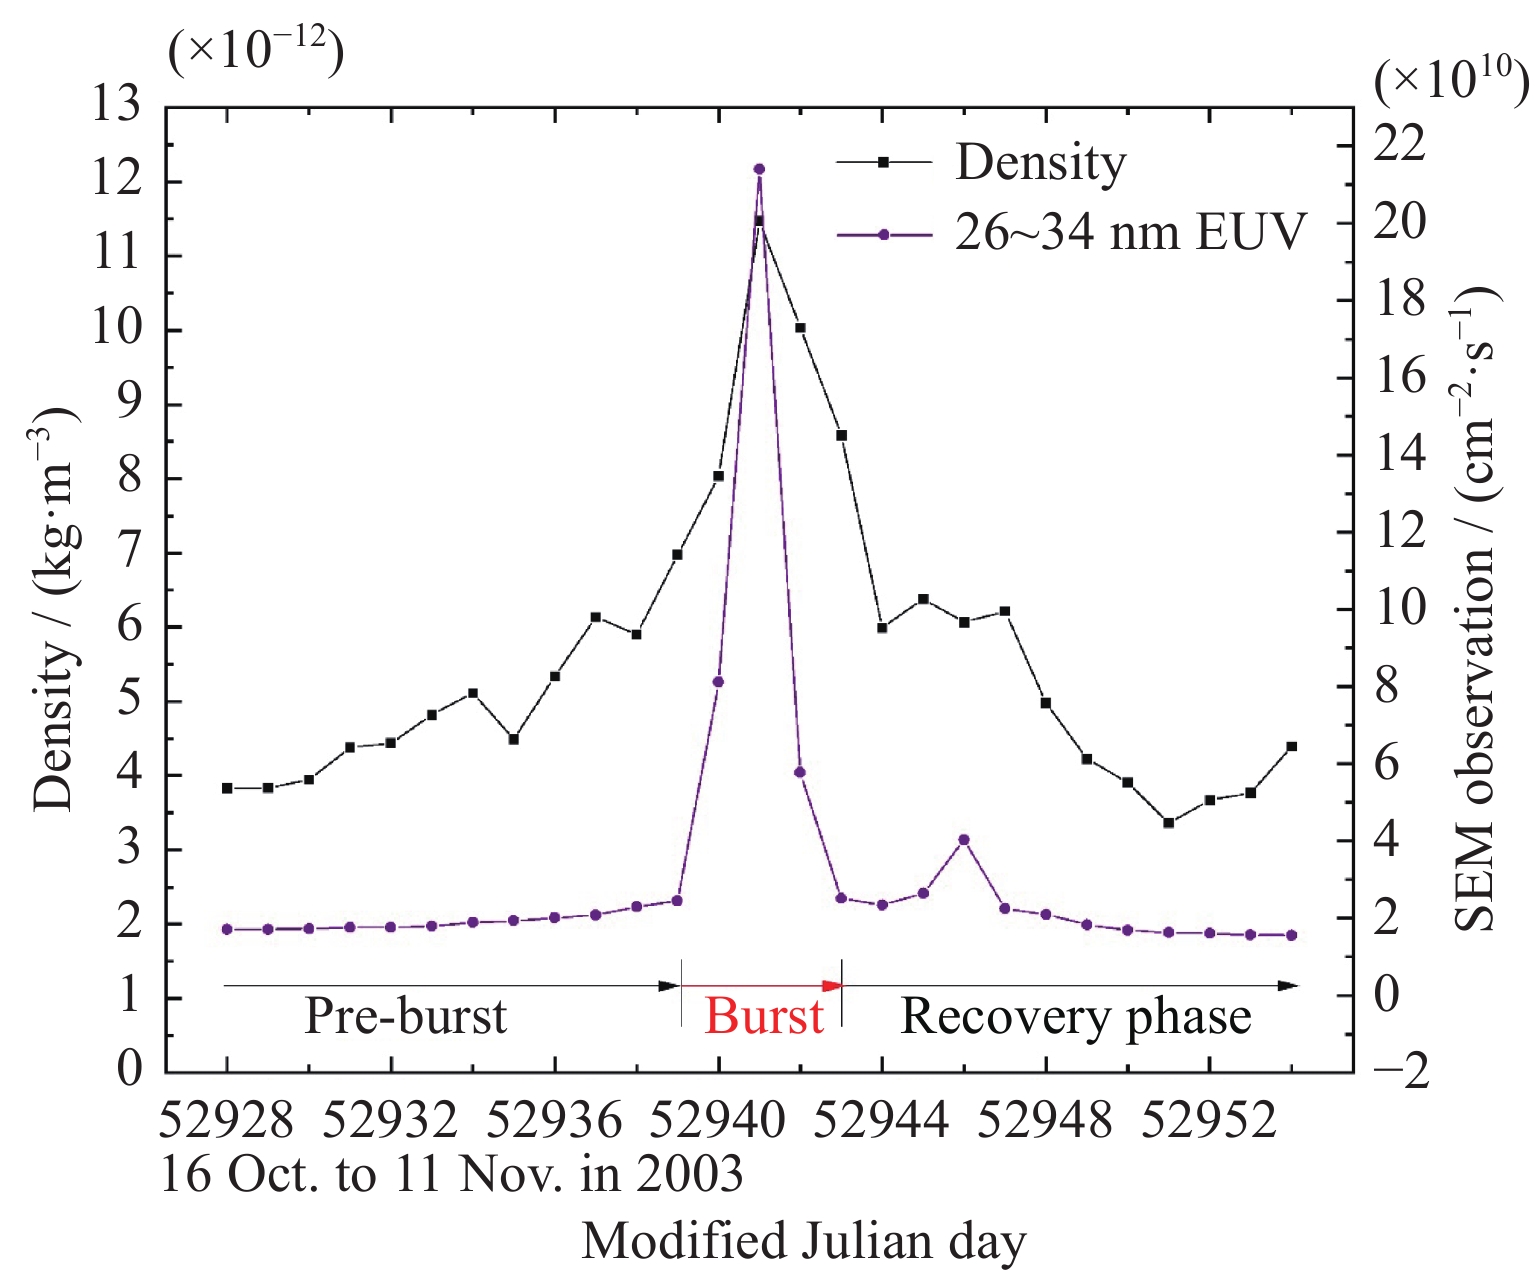
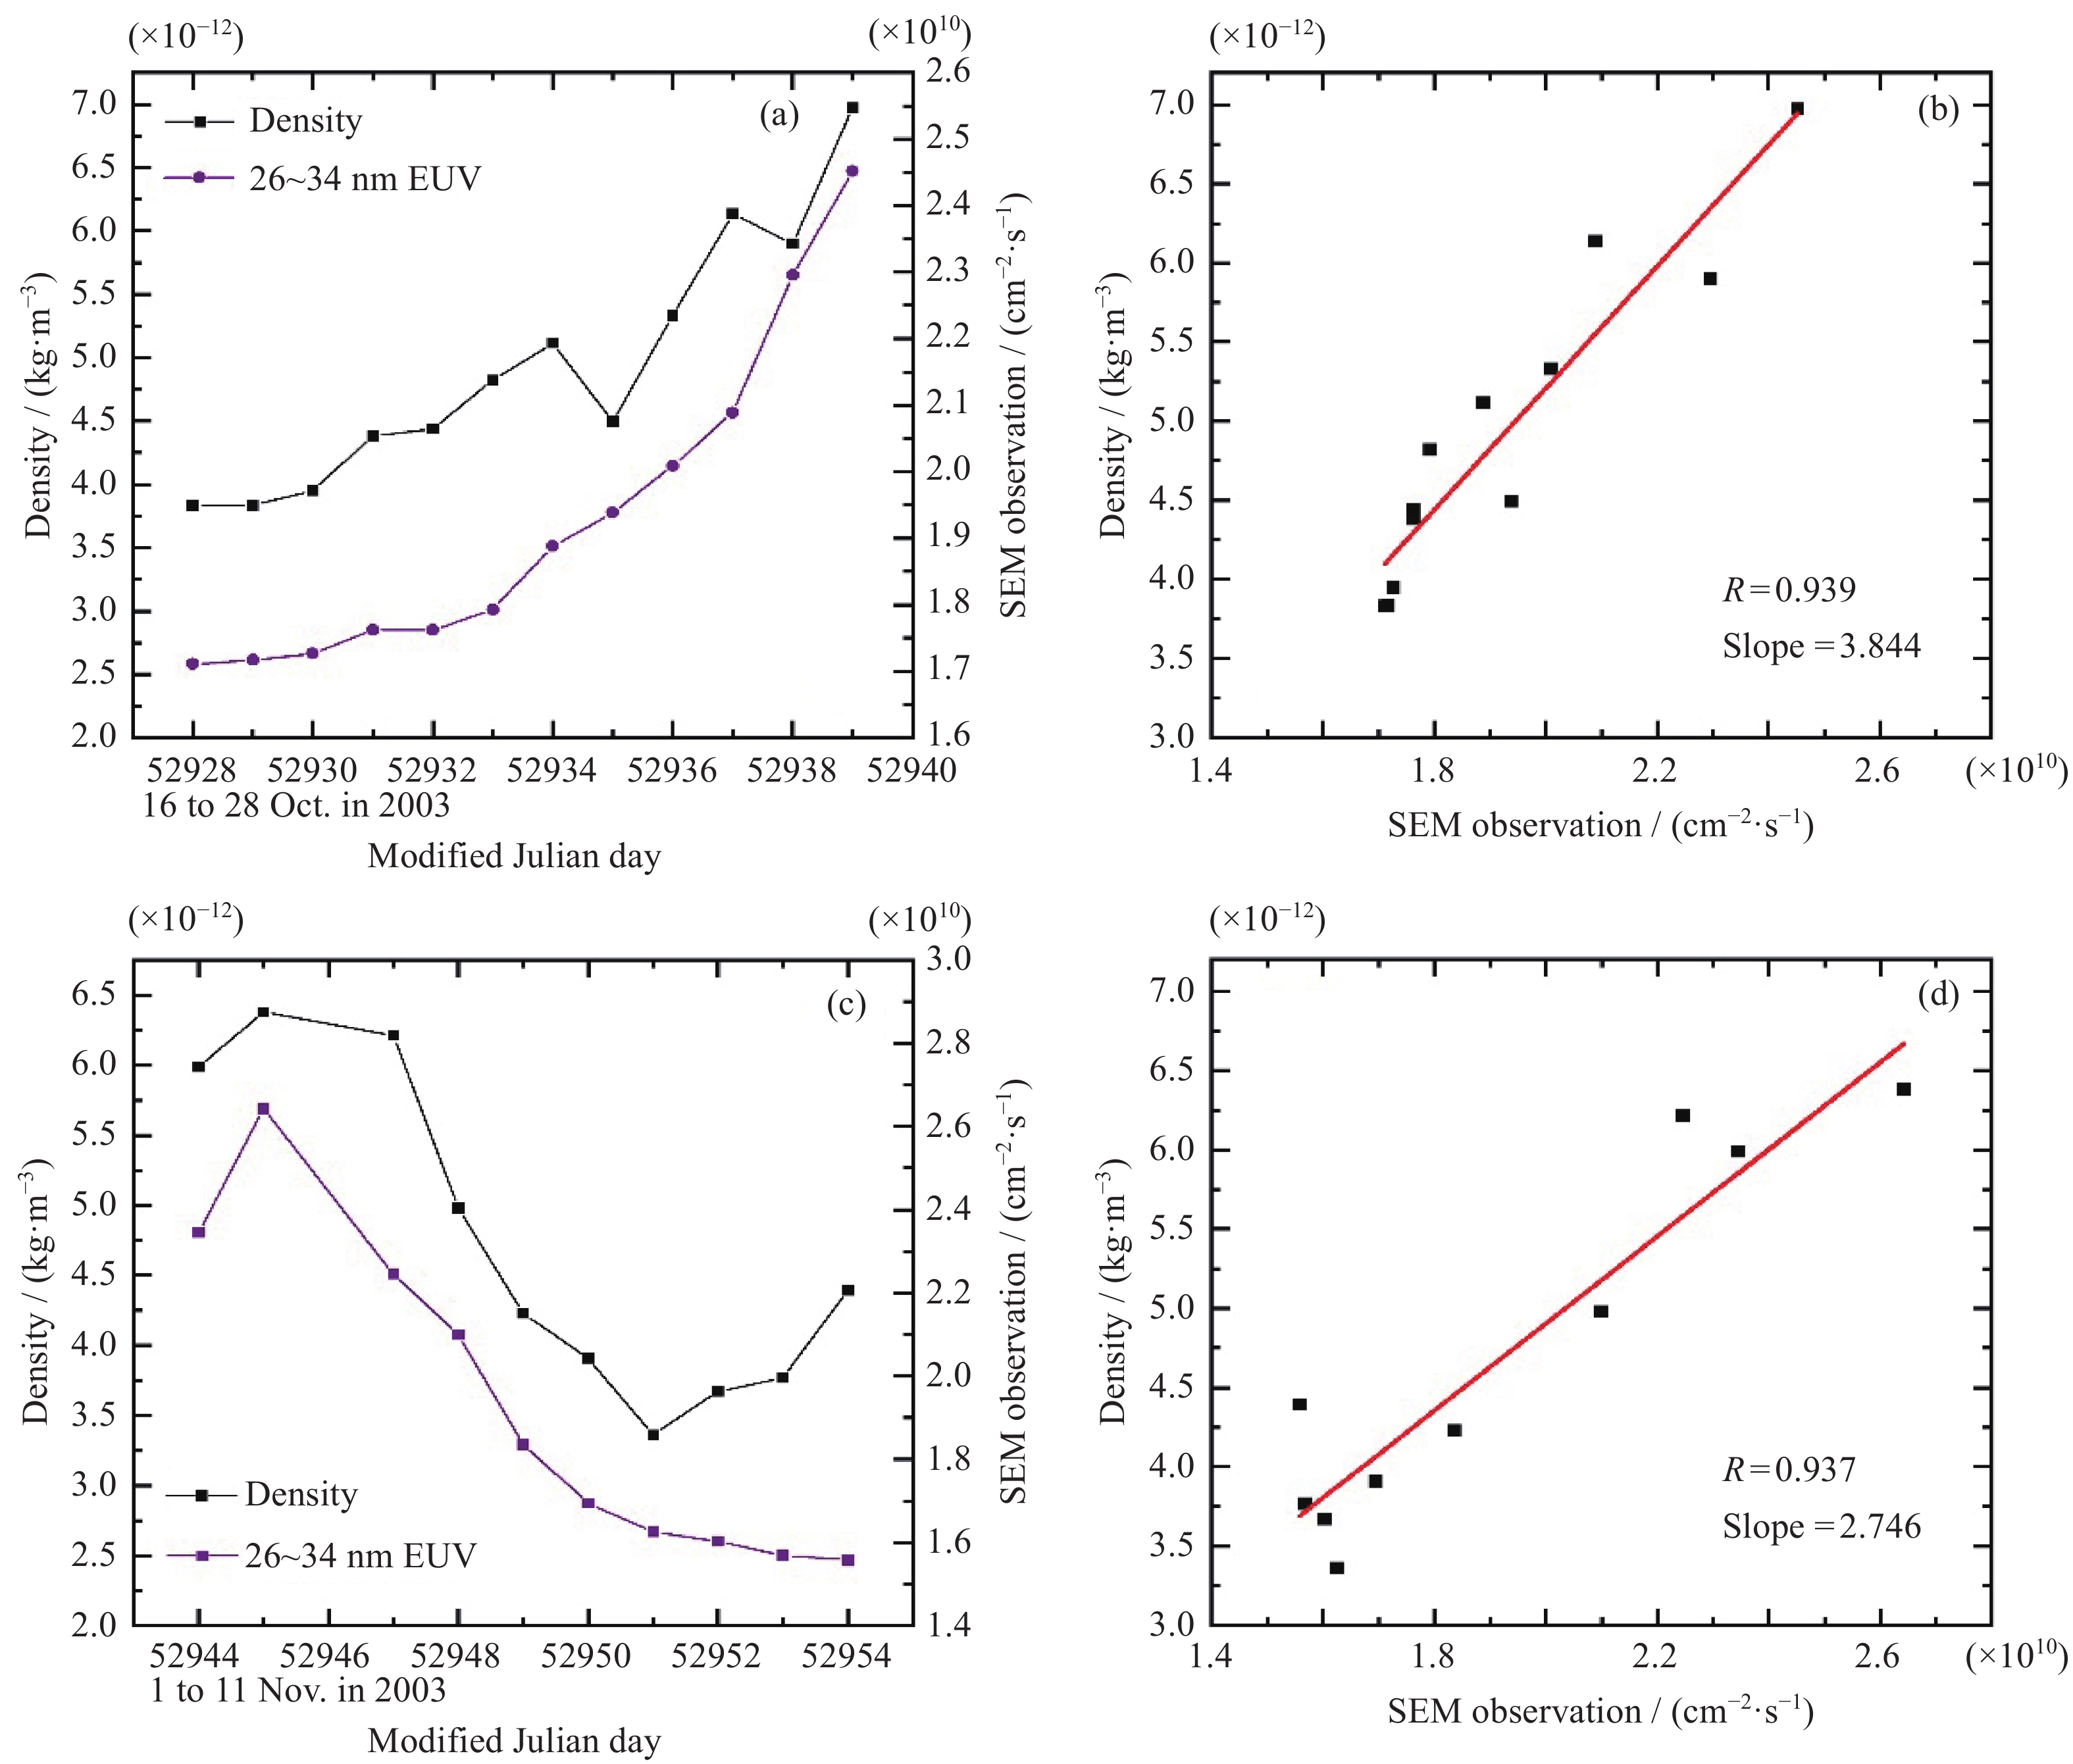
图 4 一个太阳自转周一次剧烈太阳爆发事件中CHAMP记录到的大气密度随极紫外辐射的变化
Figure 4. Comparison of the densities observed by CHAMP with EUV measurement at 26~34 nm wavelength during a solar burst in the rotation cycle
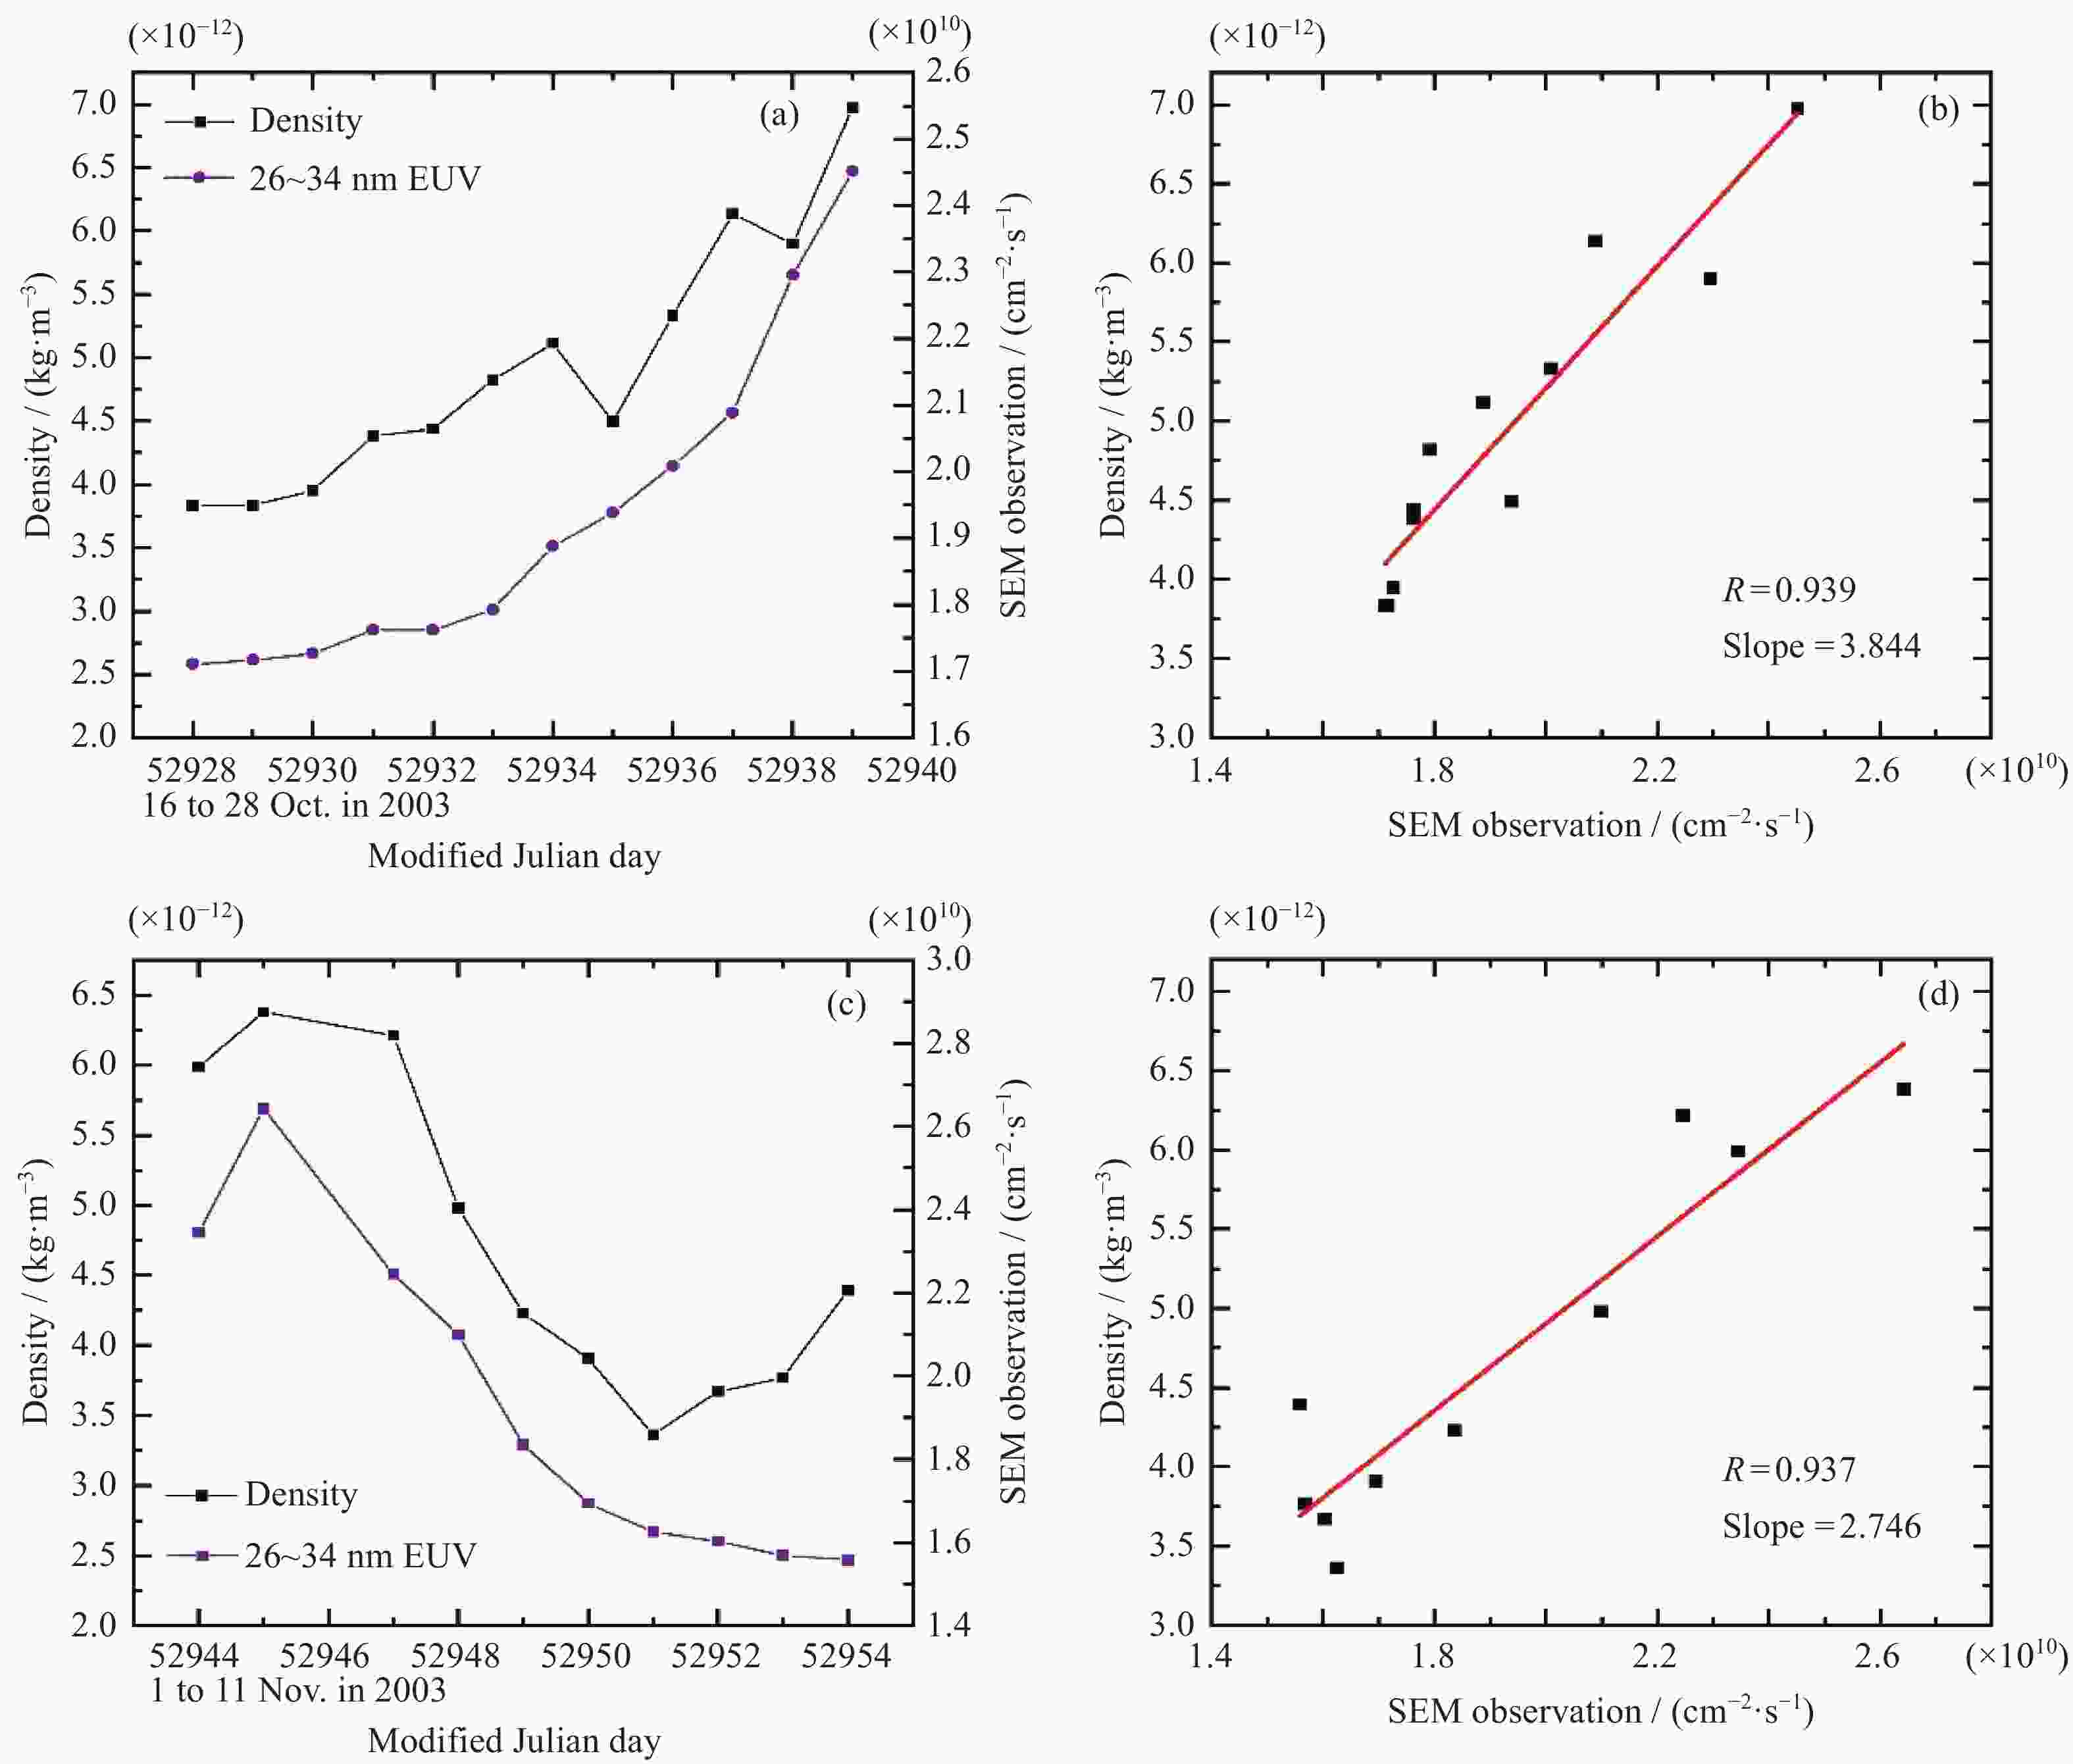
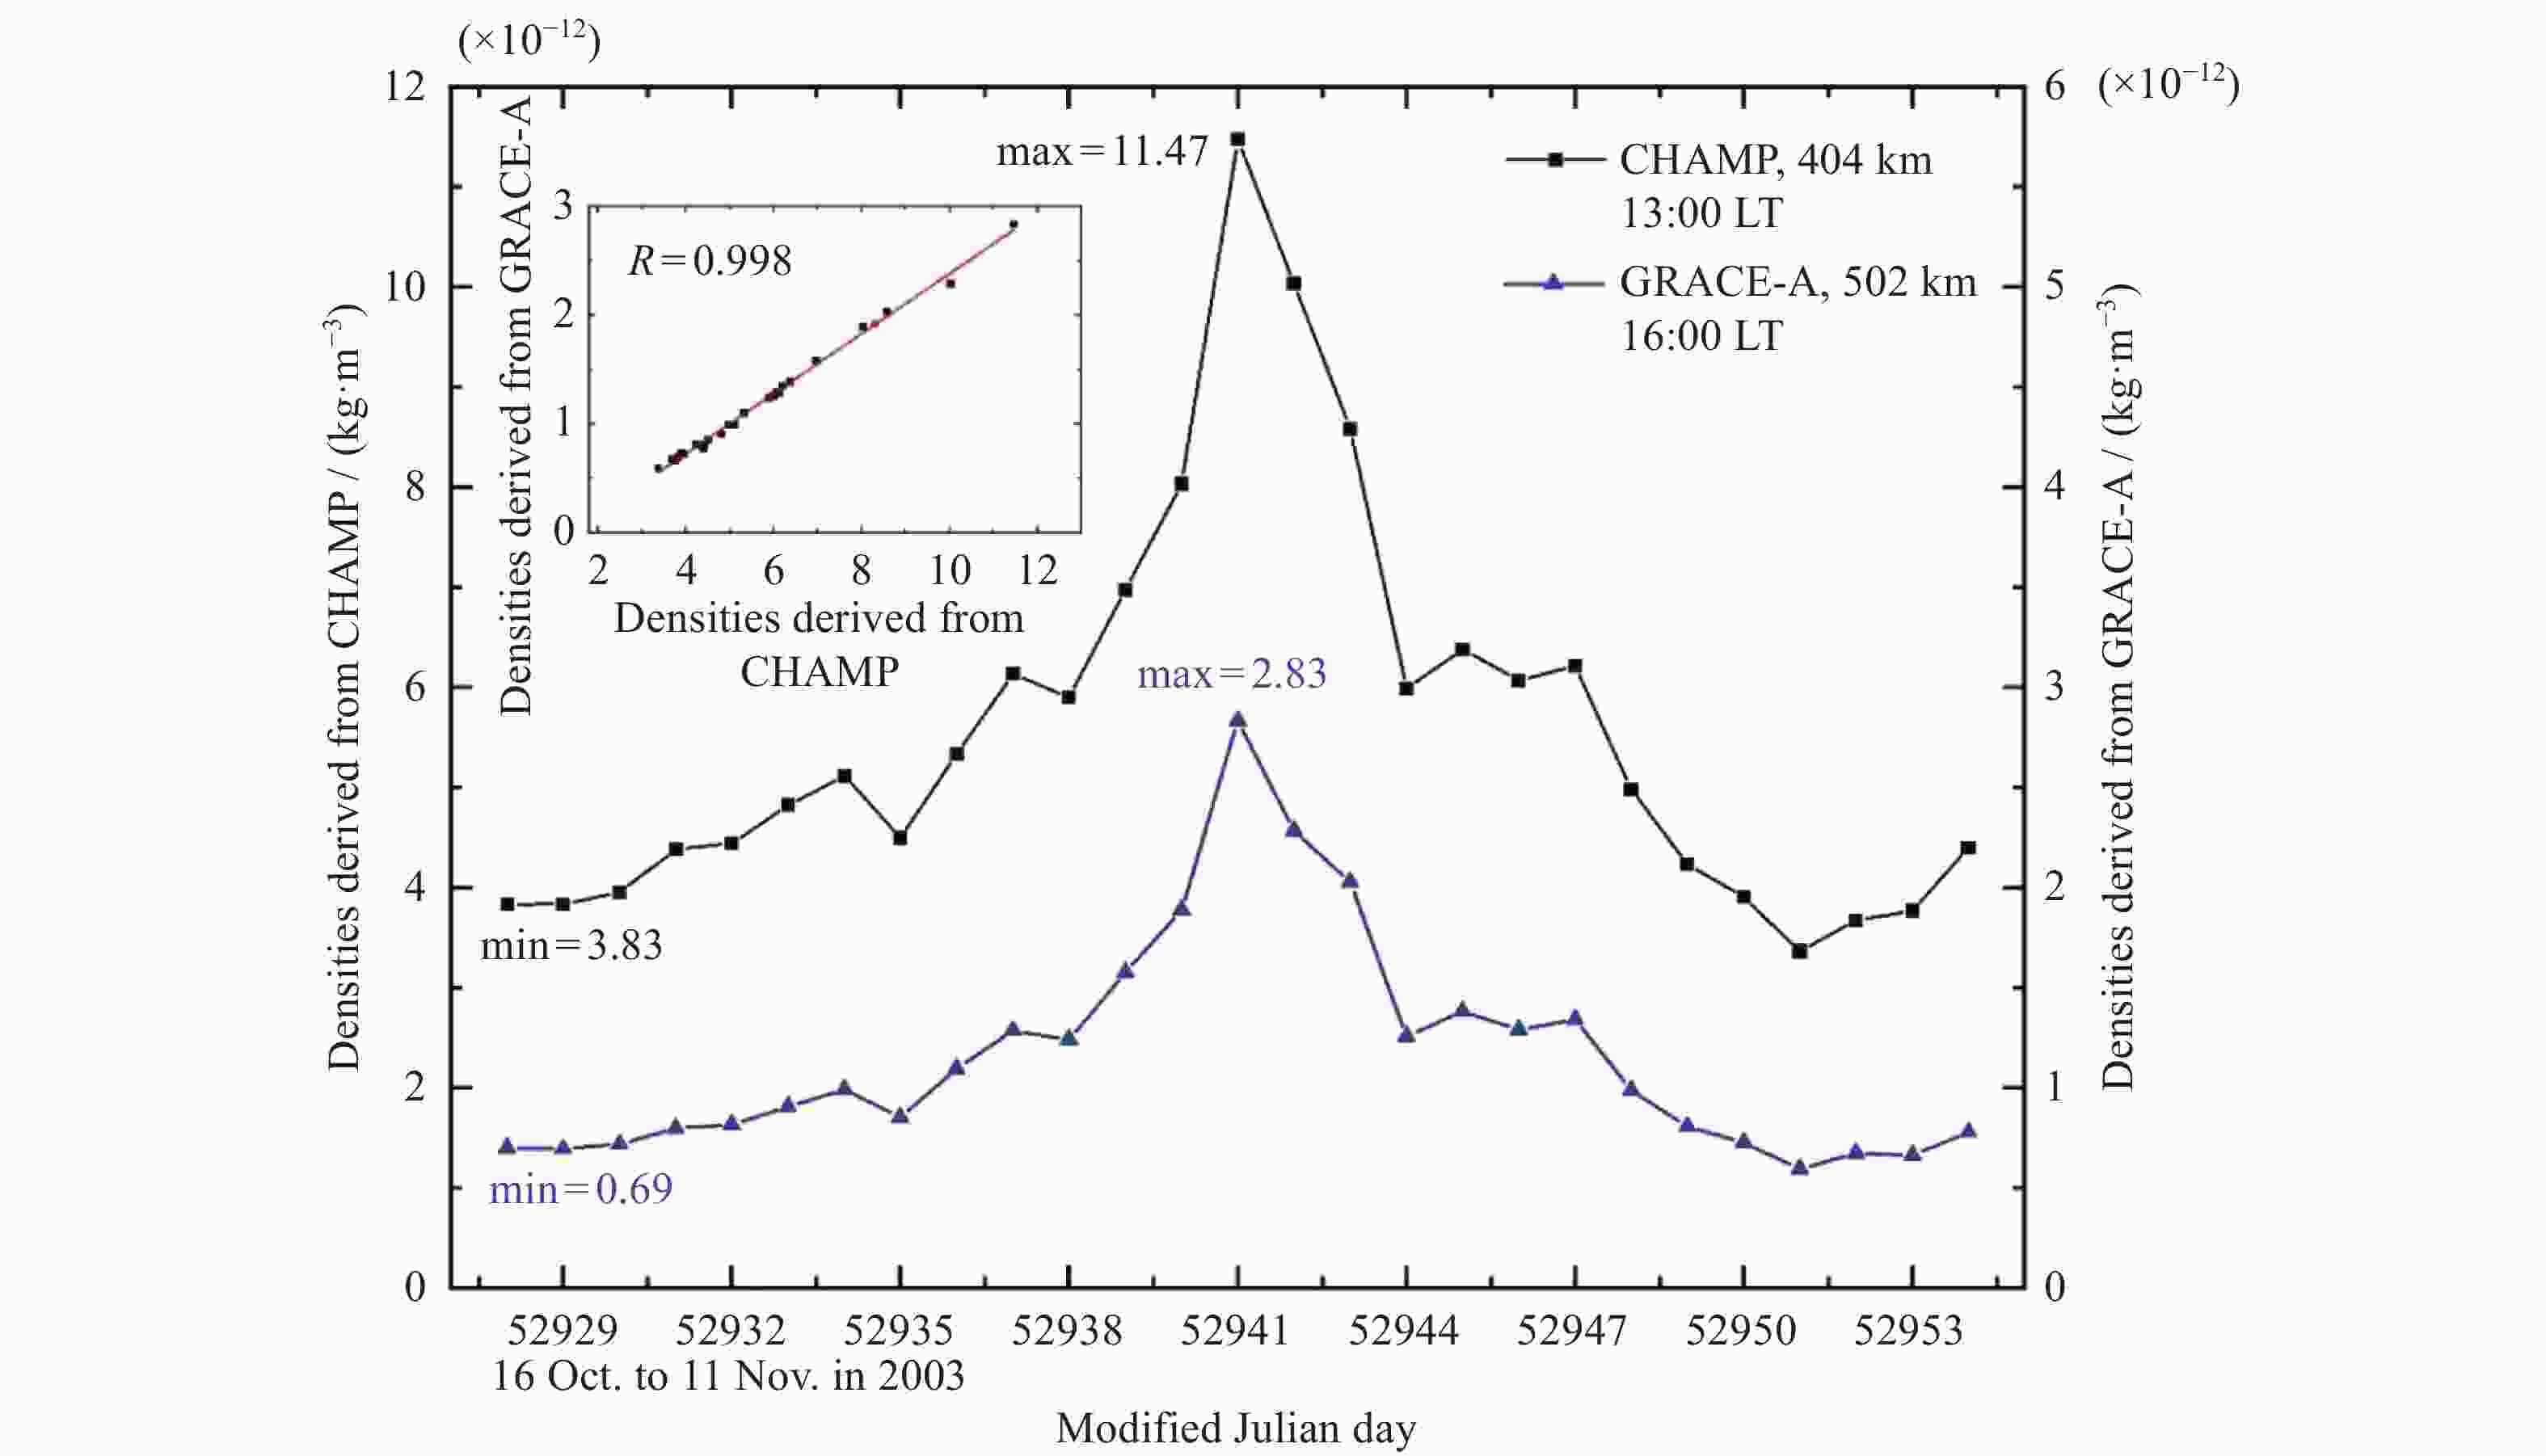
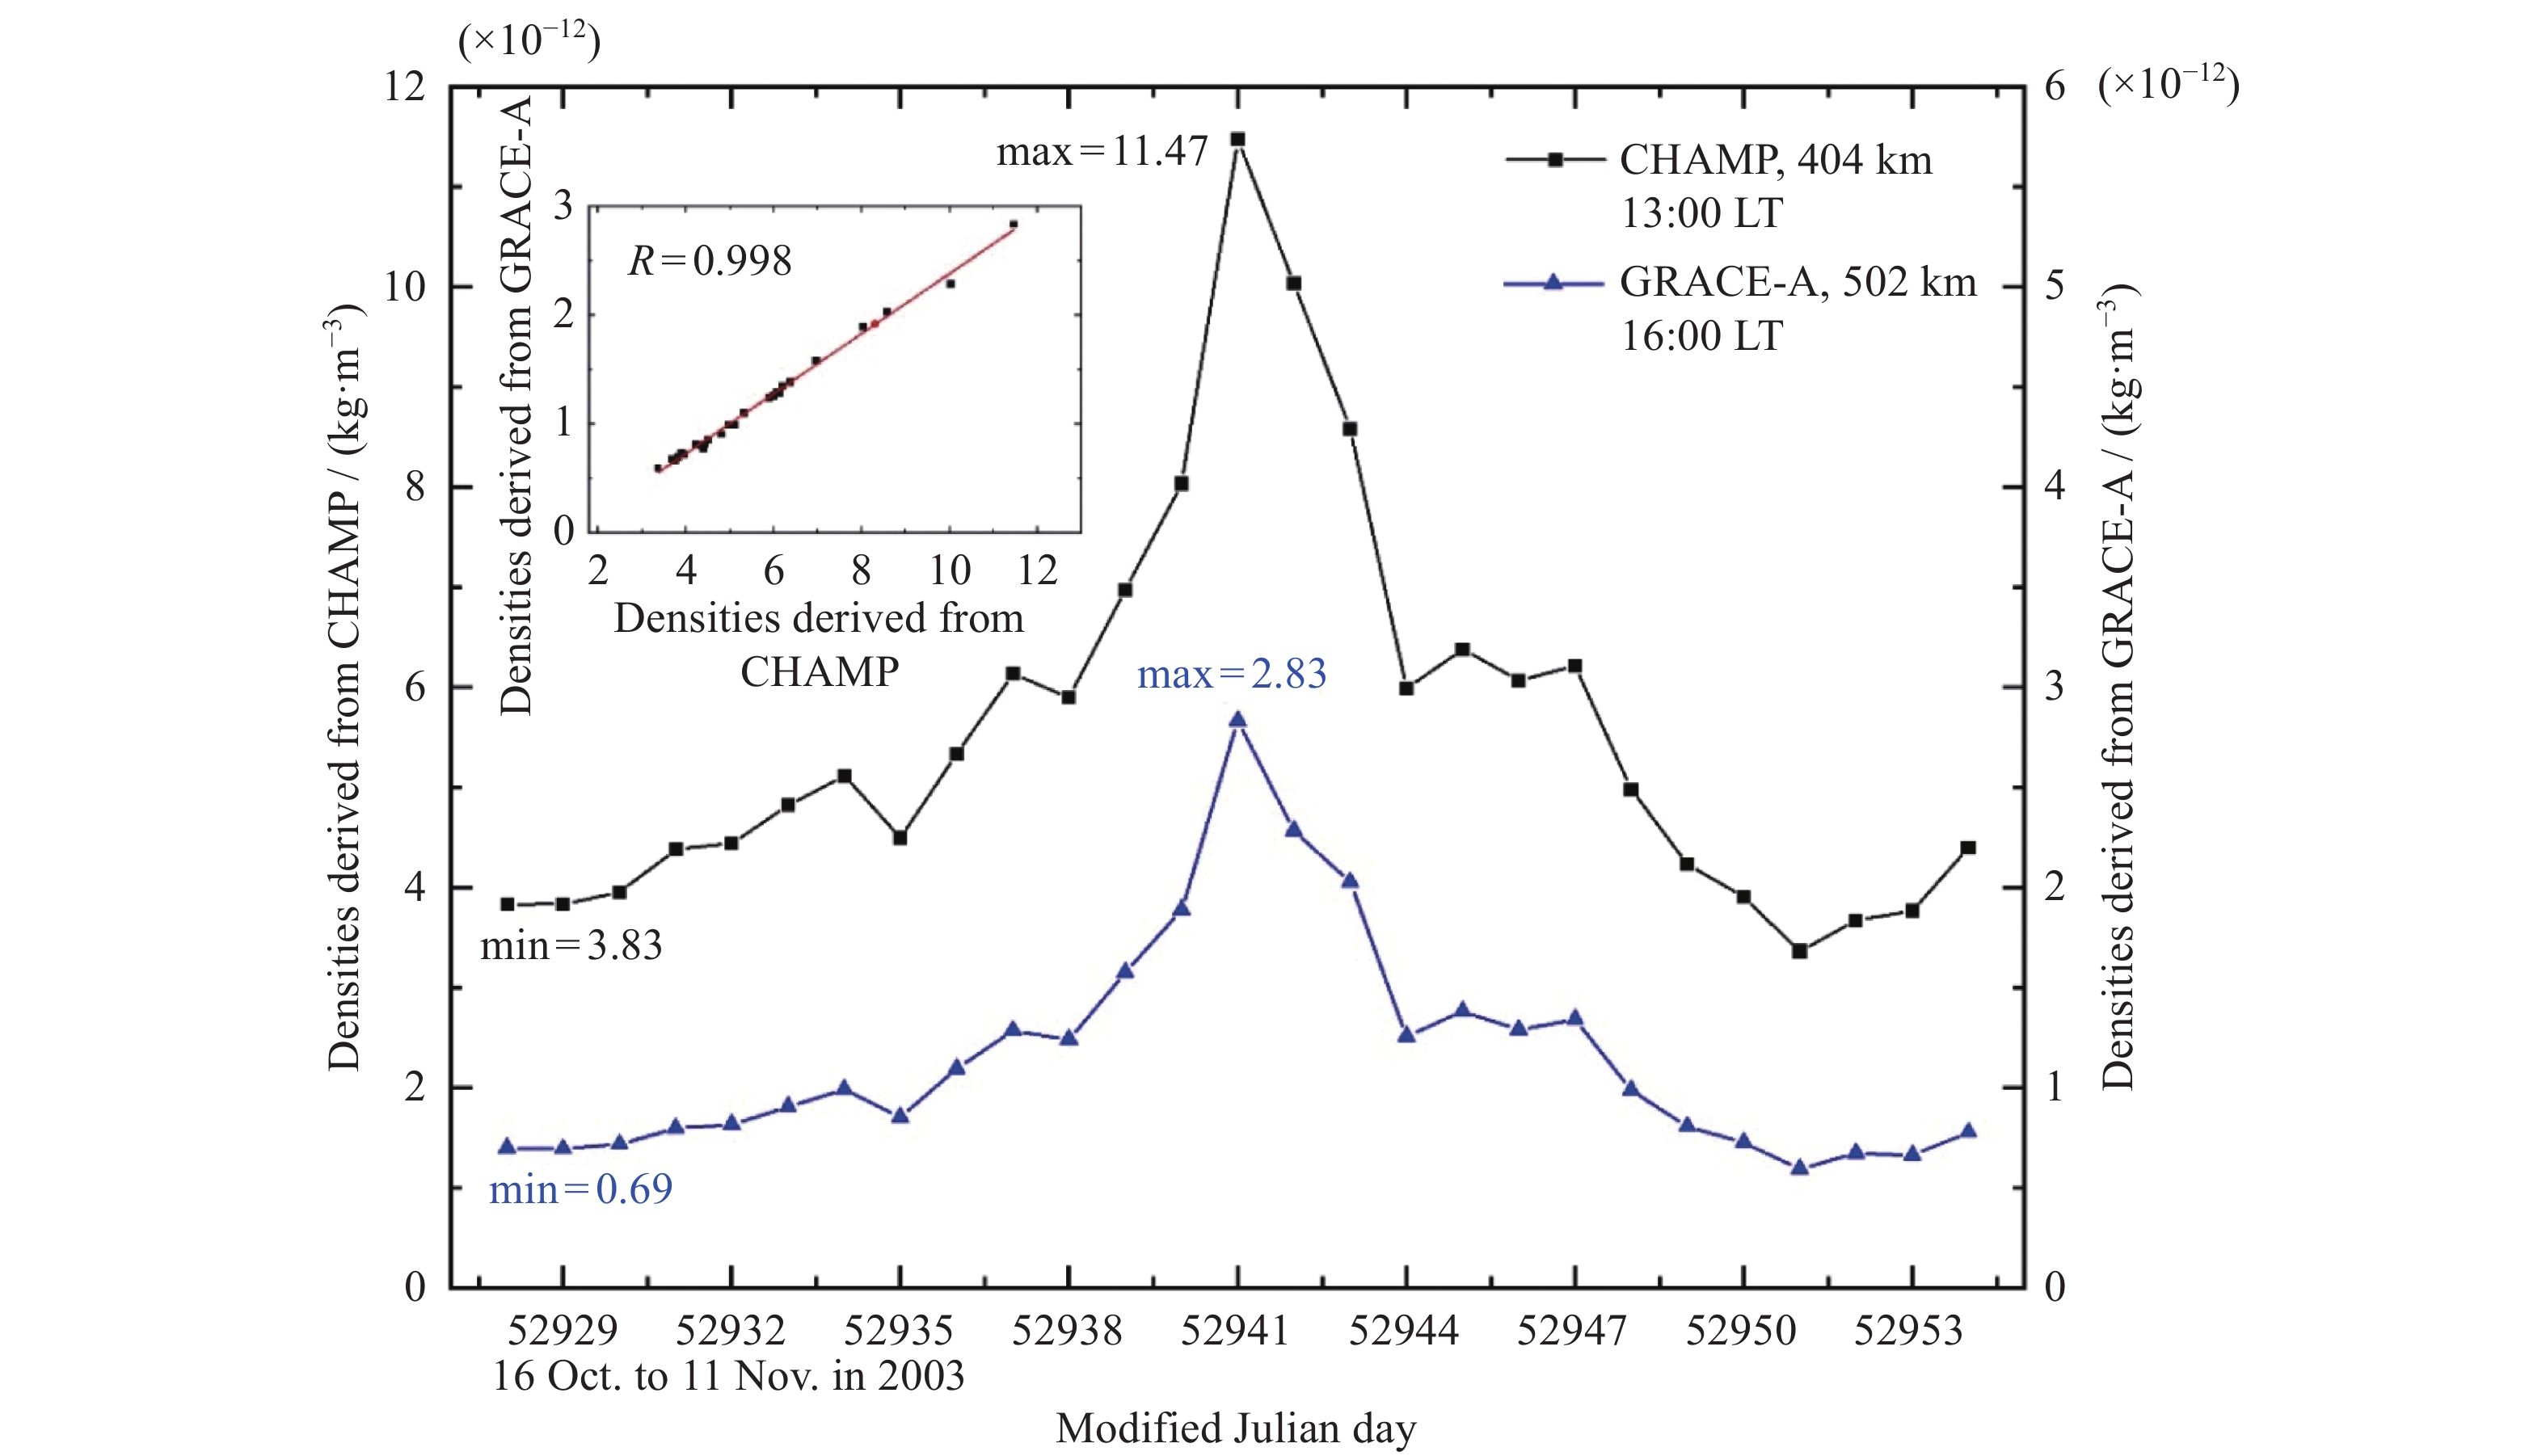
图 6 同一次太阳爆发事件中CHAMP与GRACE-A测量大气密度的涨落对比(分处在不同高度和地方时)
Figure 6. Comparison of densities observed by CHAMP and GRACE-A during the same solar burst event and their correlation analysis (at different altitude and local time)
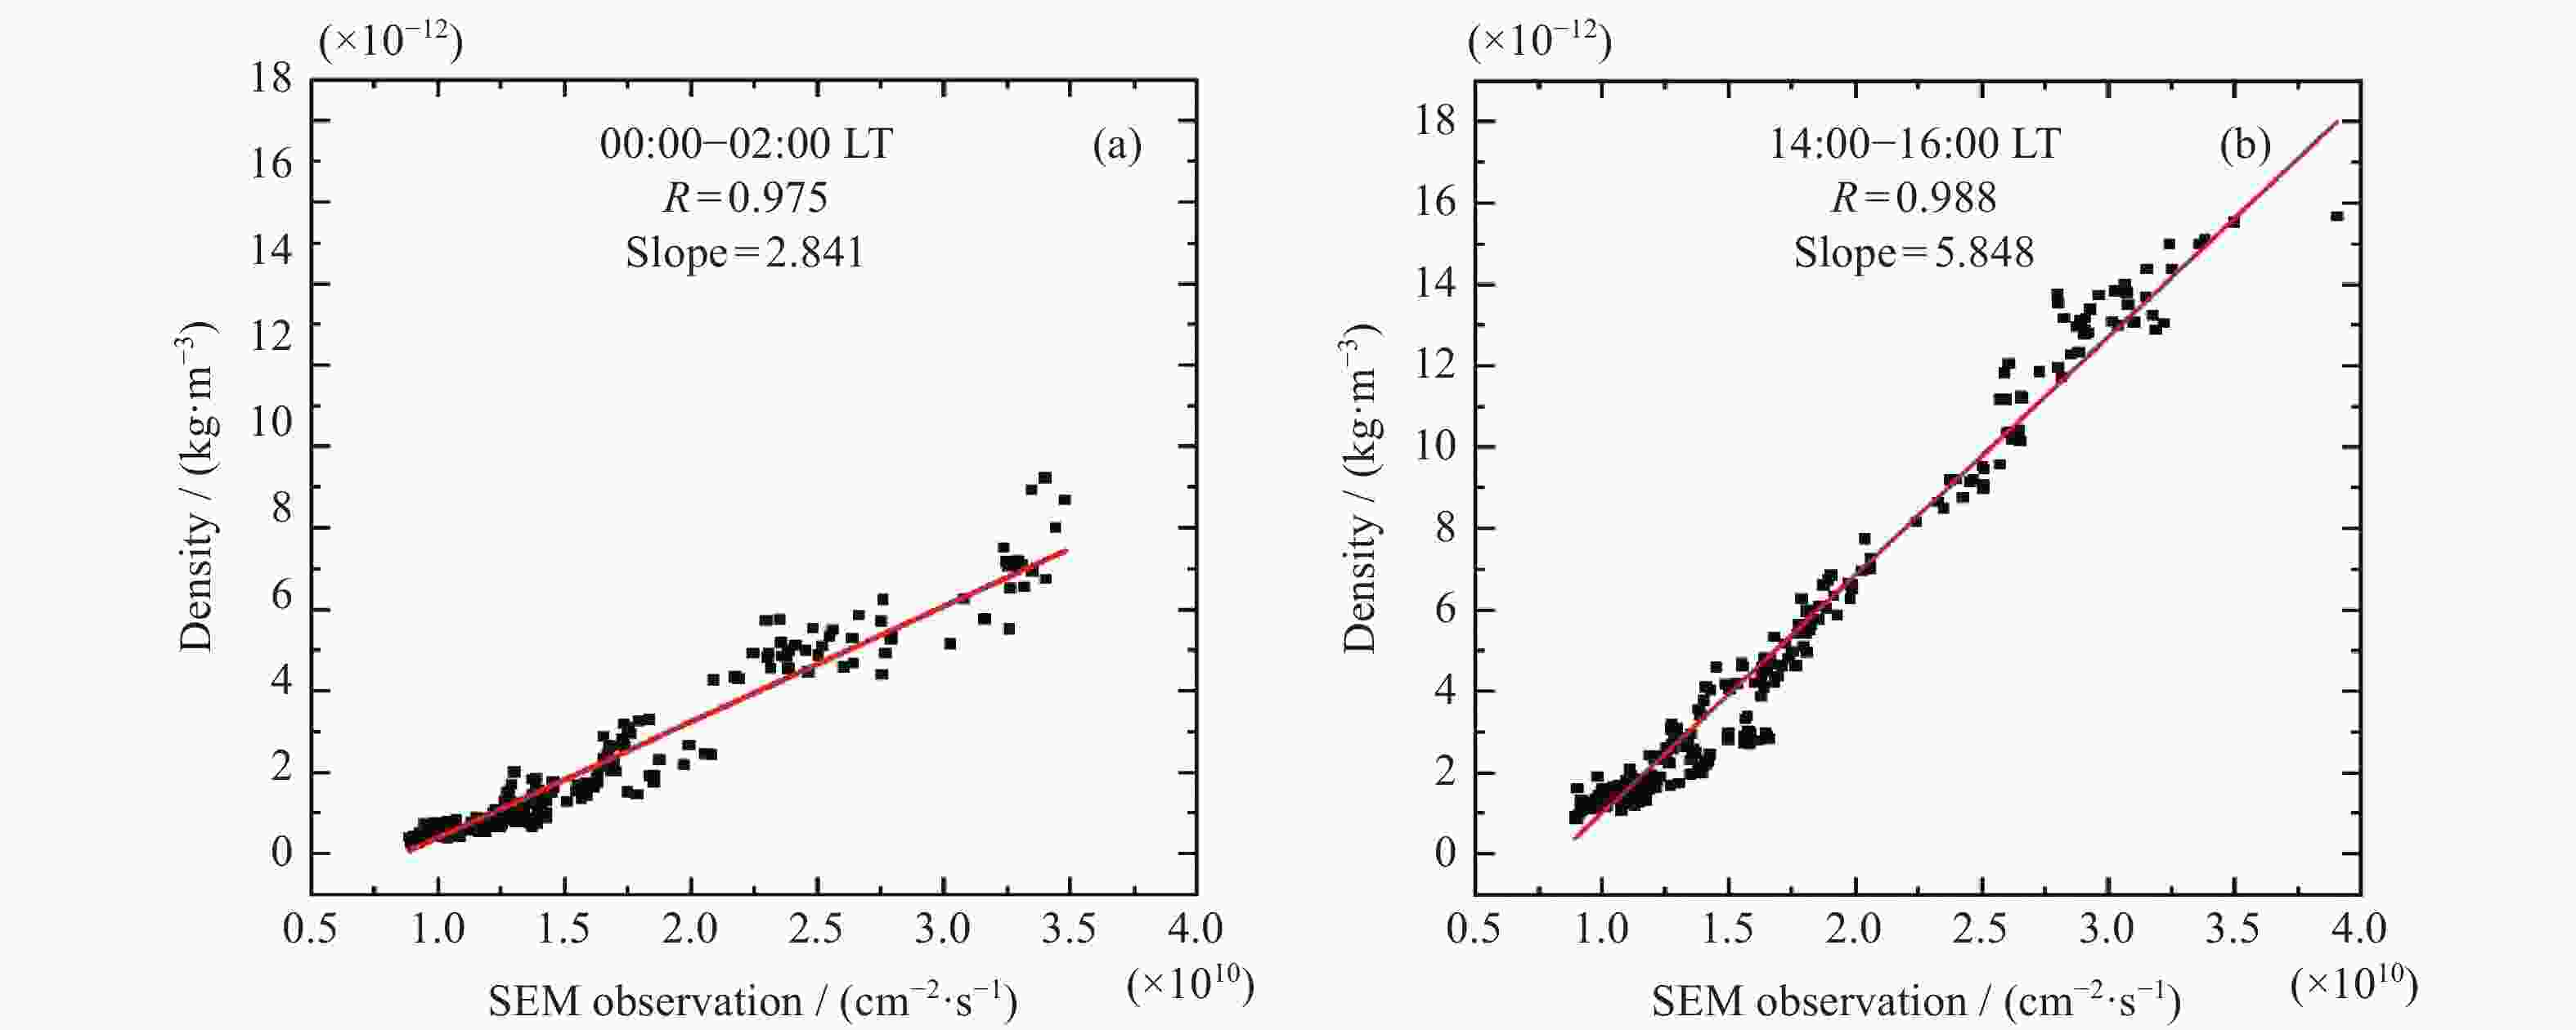
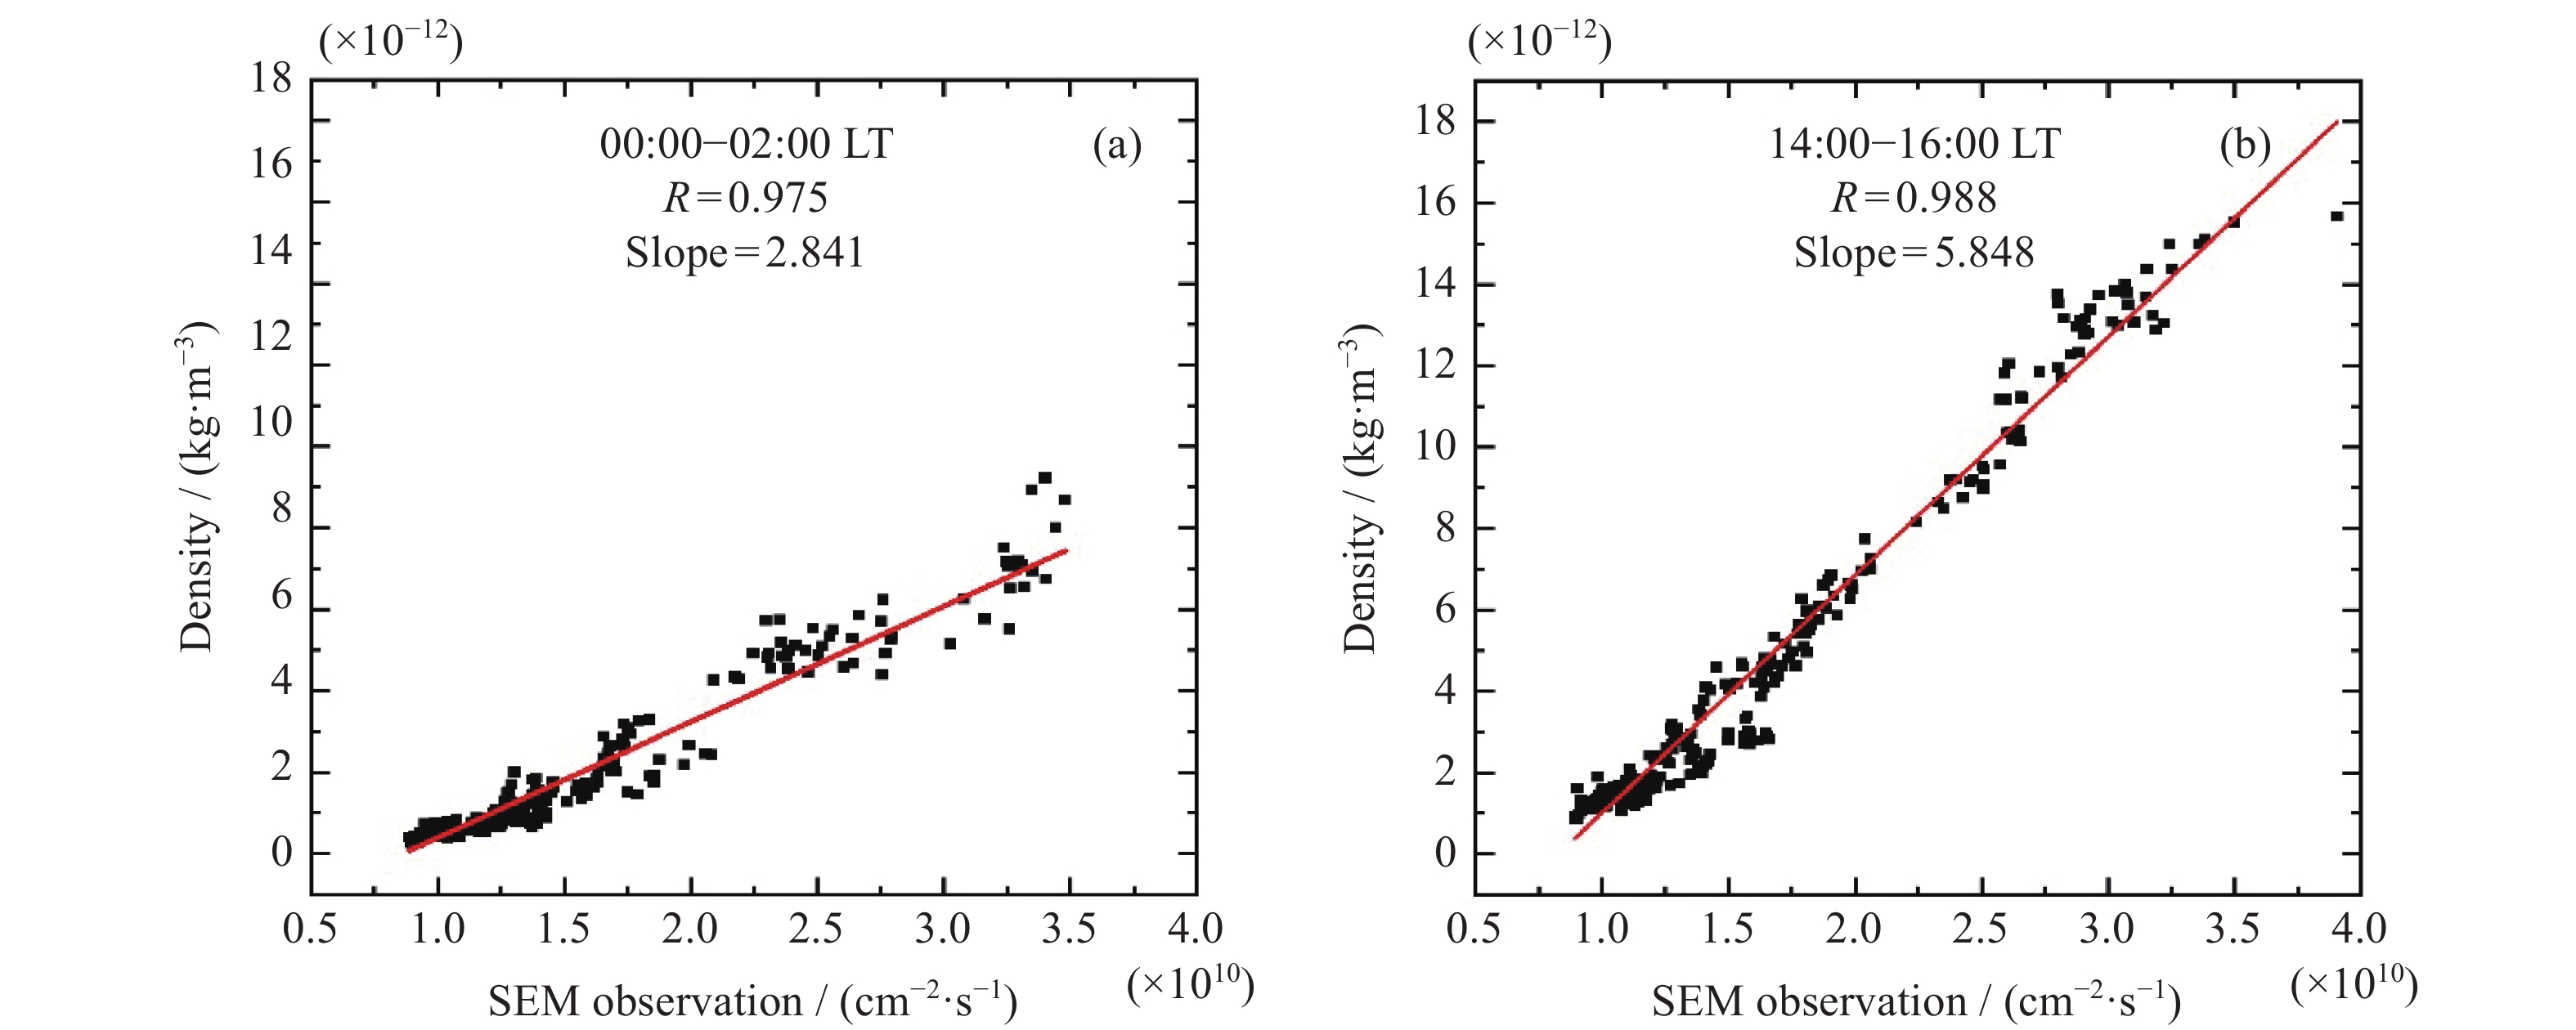
图 7 CHAMP在两个不同地方时区间记录的大气密度与极紫外辐射的相关性分析
Figure 7. Long-term correlation analysis between densities observed by CHAMP and EUV measurement at two bins of local time
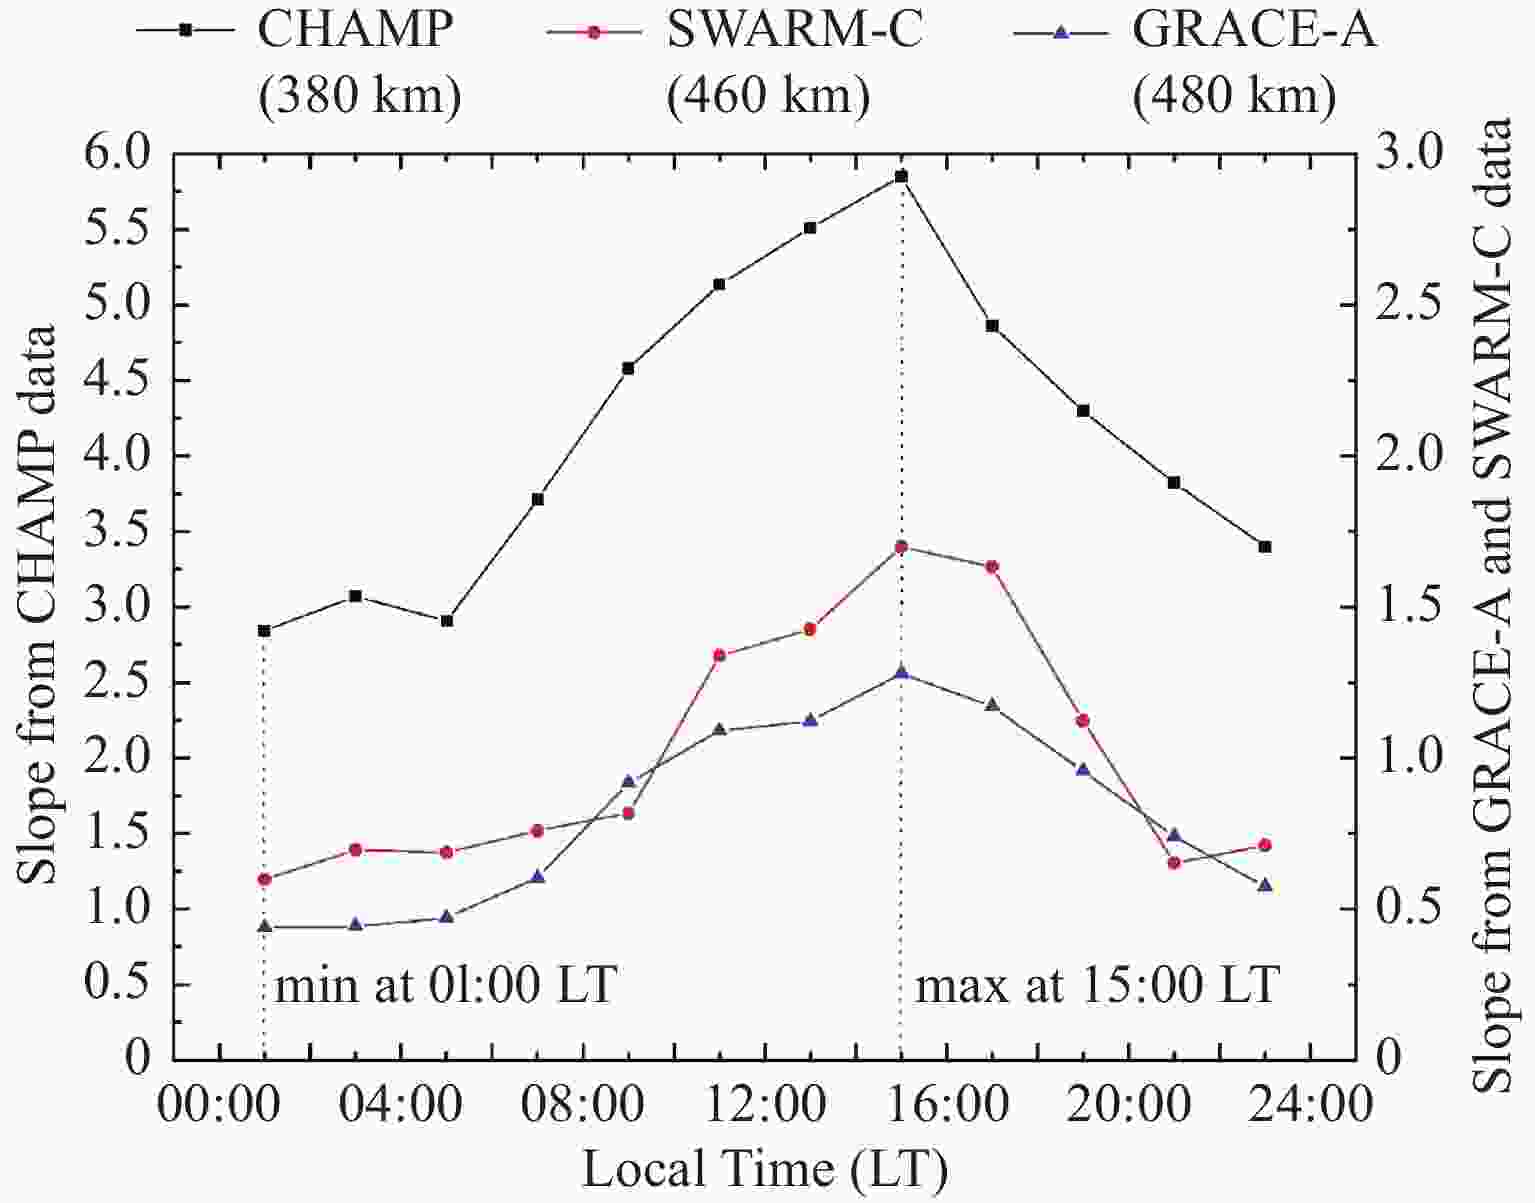
图 8 大气密度与极紫外辐射的线性相关斜率变化与所在地方时的关系
Figure 8. Variation of slope derived by correlation analysis between densities and EUV measurement at different local time
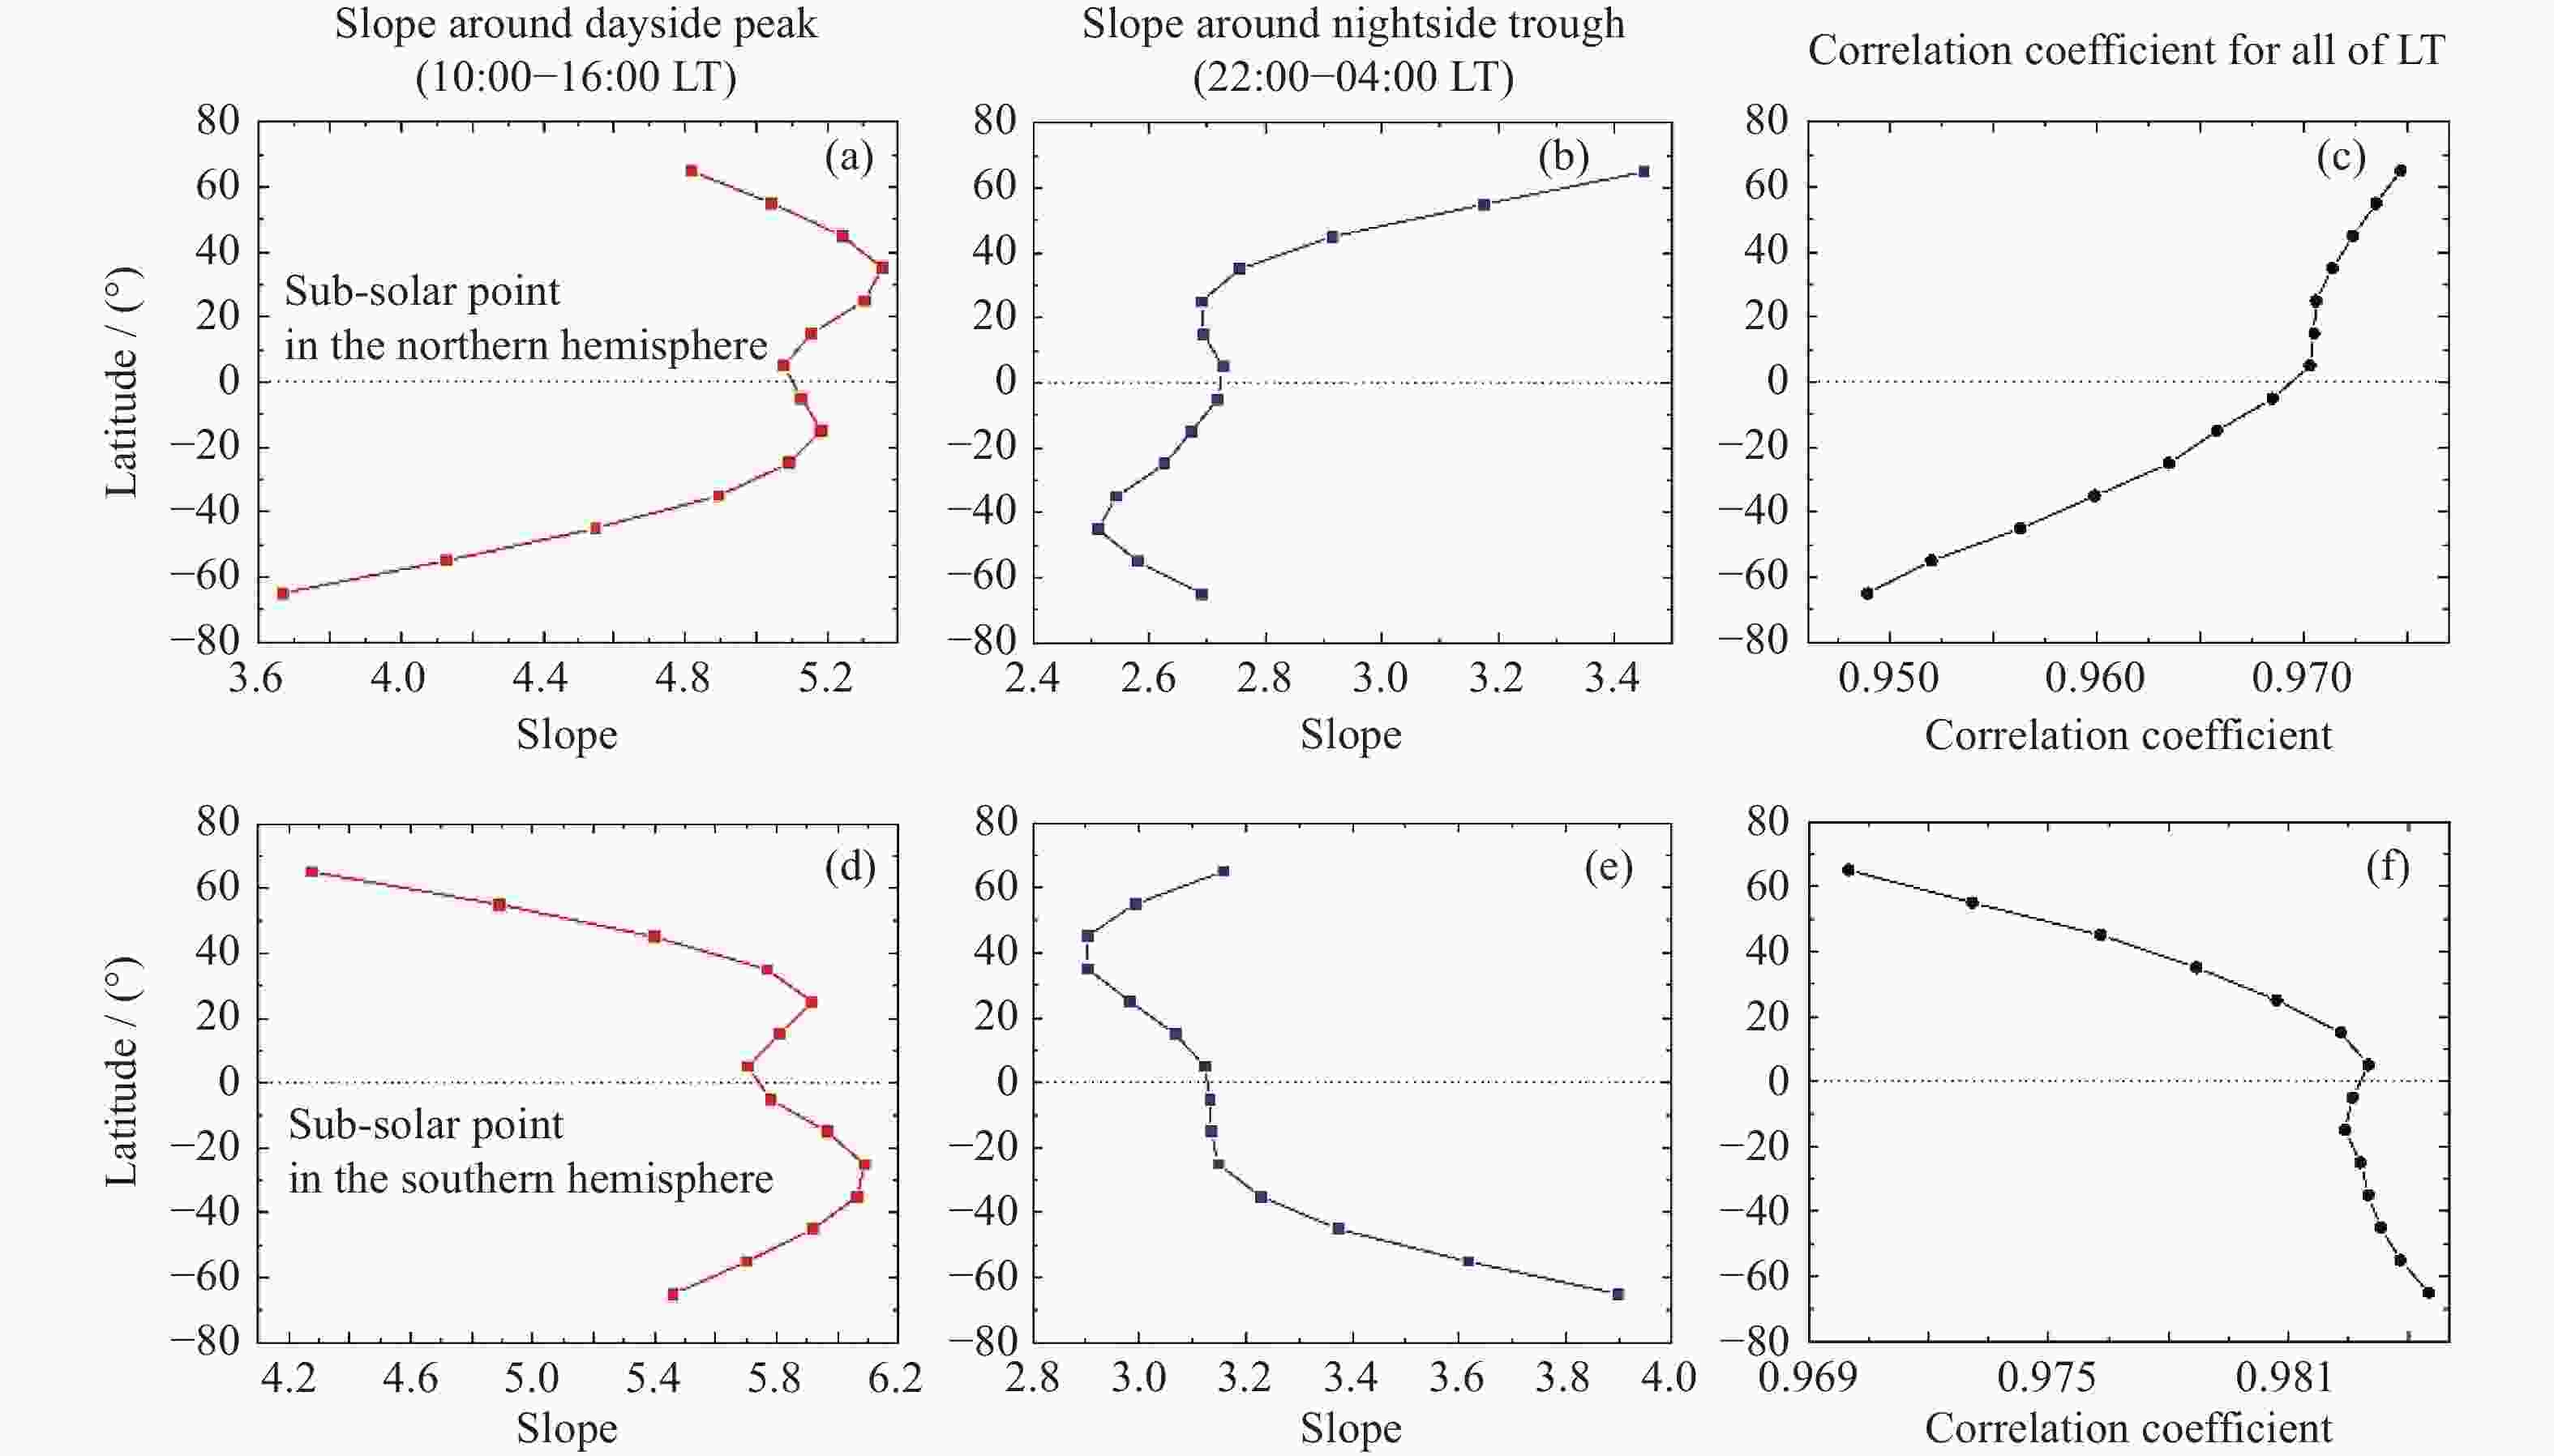
图 9 大气密度对极紫外辐射的线性斜率随地方时和地理纬度的变化(CHAMP)
Figure 9. Slope of linear correlation between densities and EUV measurements at different Local Time (LT) and geomagnetic latitude (CHAMP)
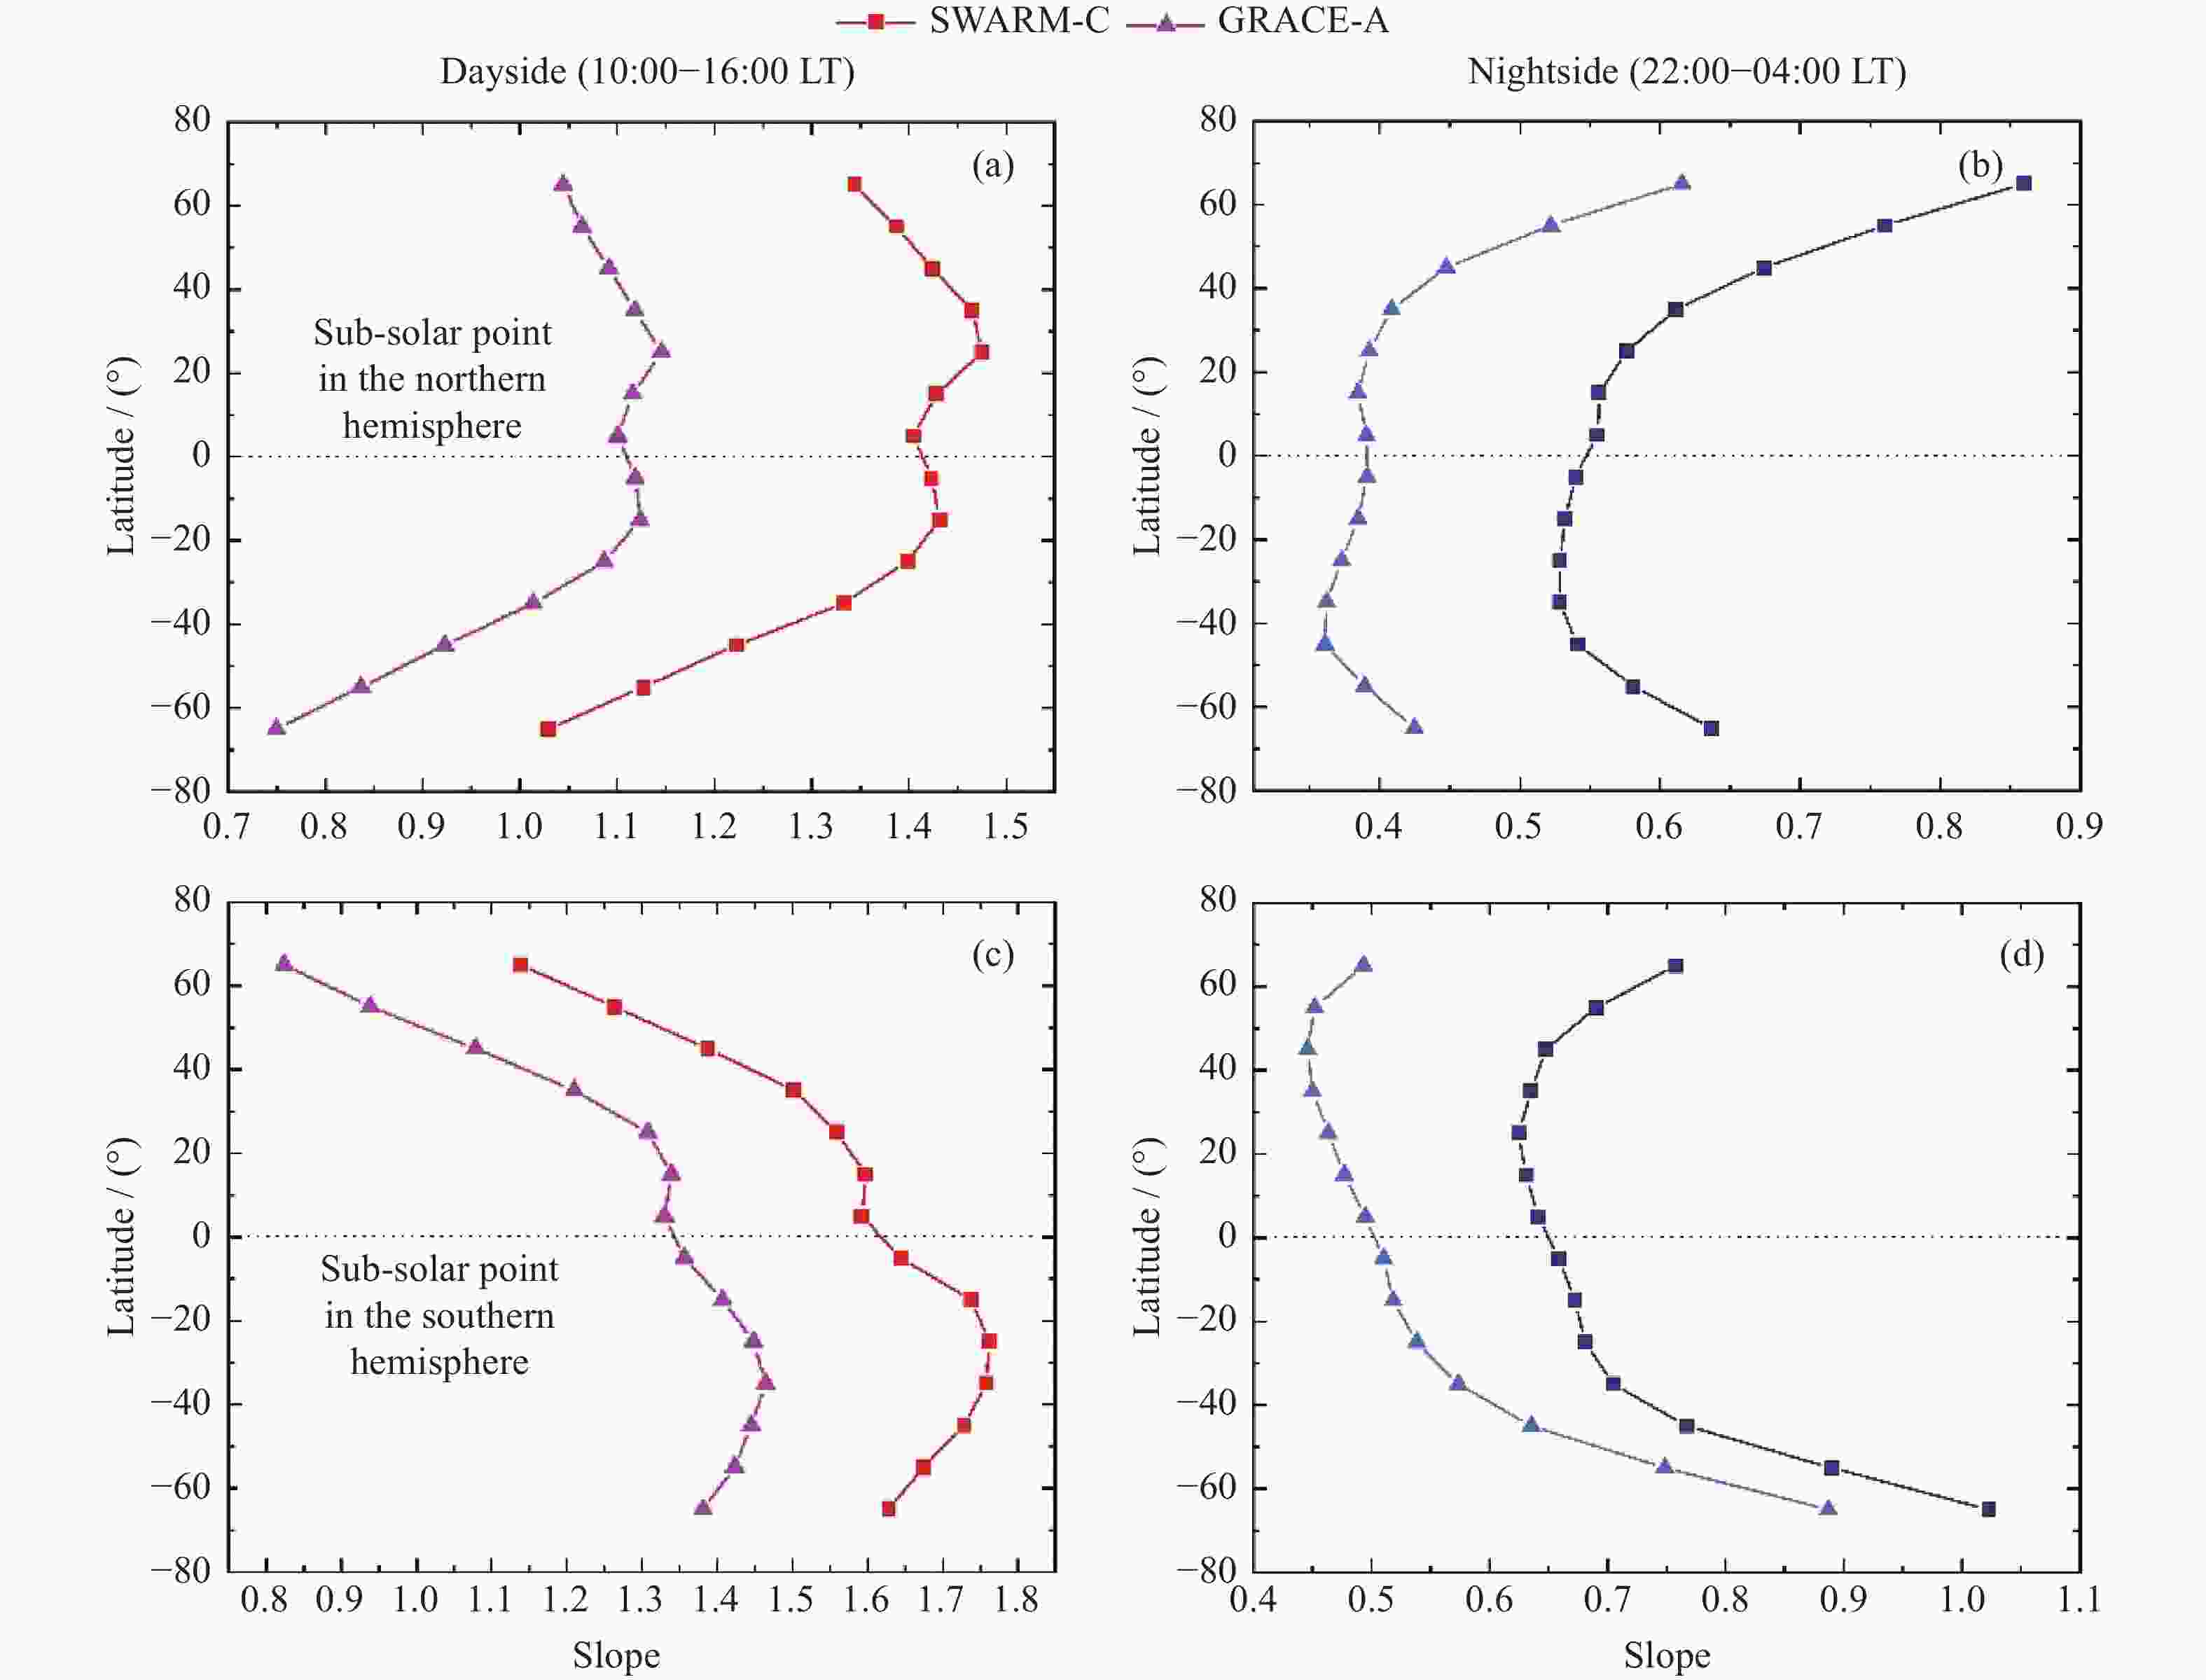
图 10 大气密度对极紫外辐射的线性斜率随地方时和地理纬度的变化(GRACE-A,SWARM-C)
Figure 10. Slope of linear correlation between densities and EUV measurements at different Local Time (LT) and geomagnetic latitude (GRACE-A, SWARM-C)
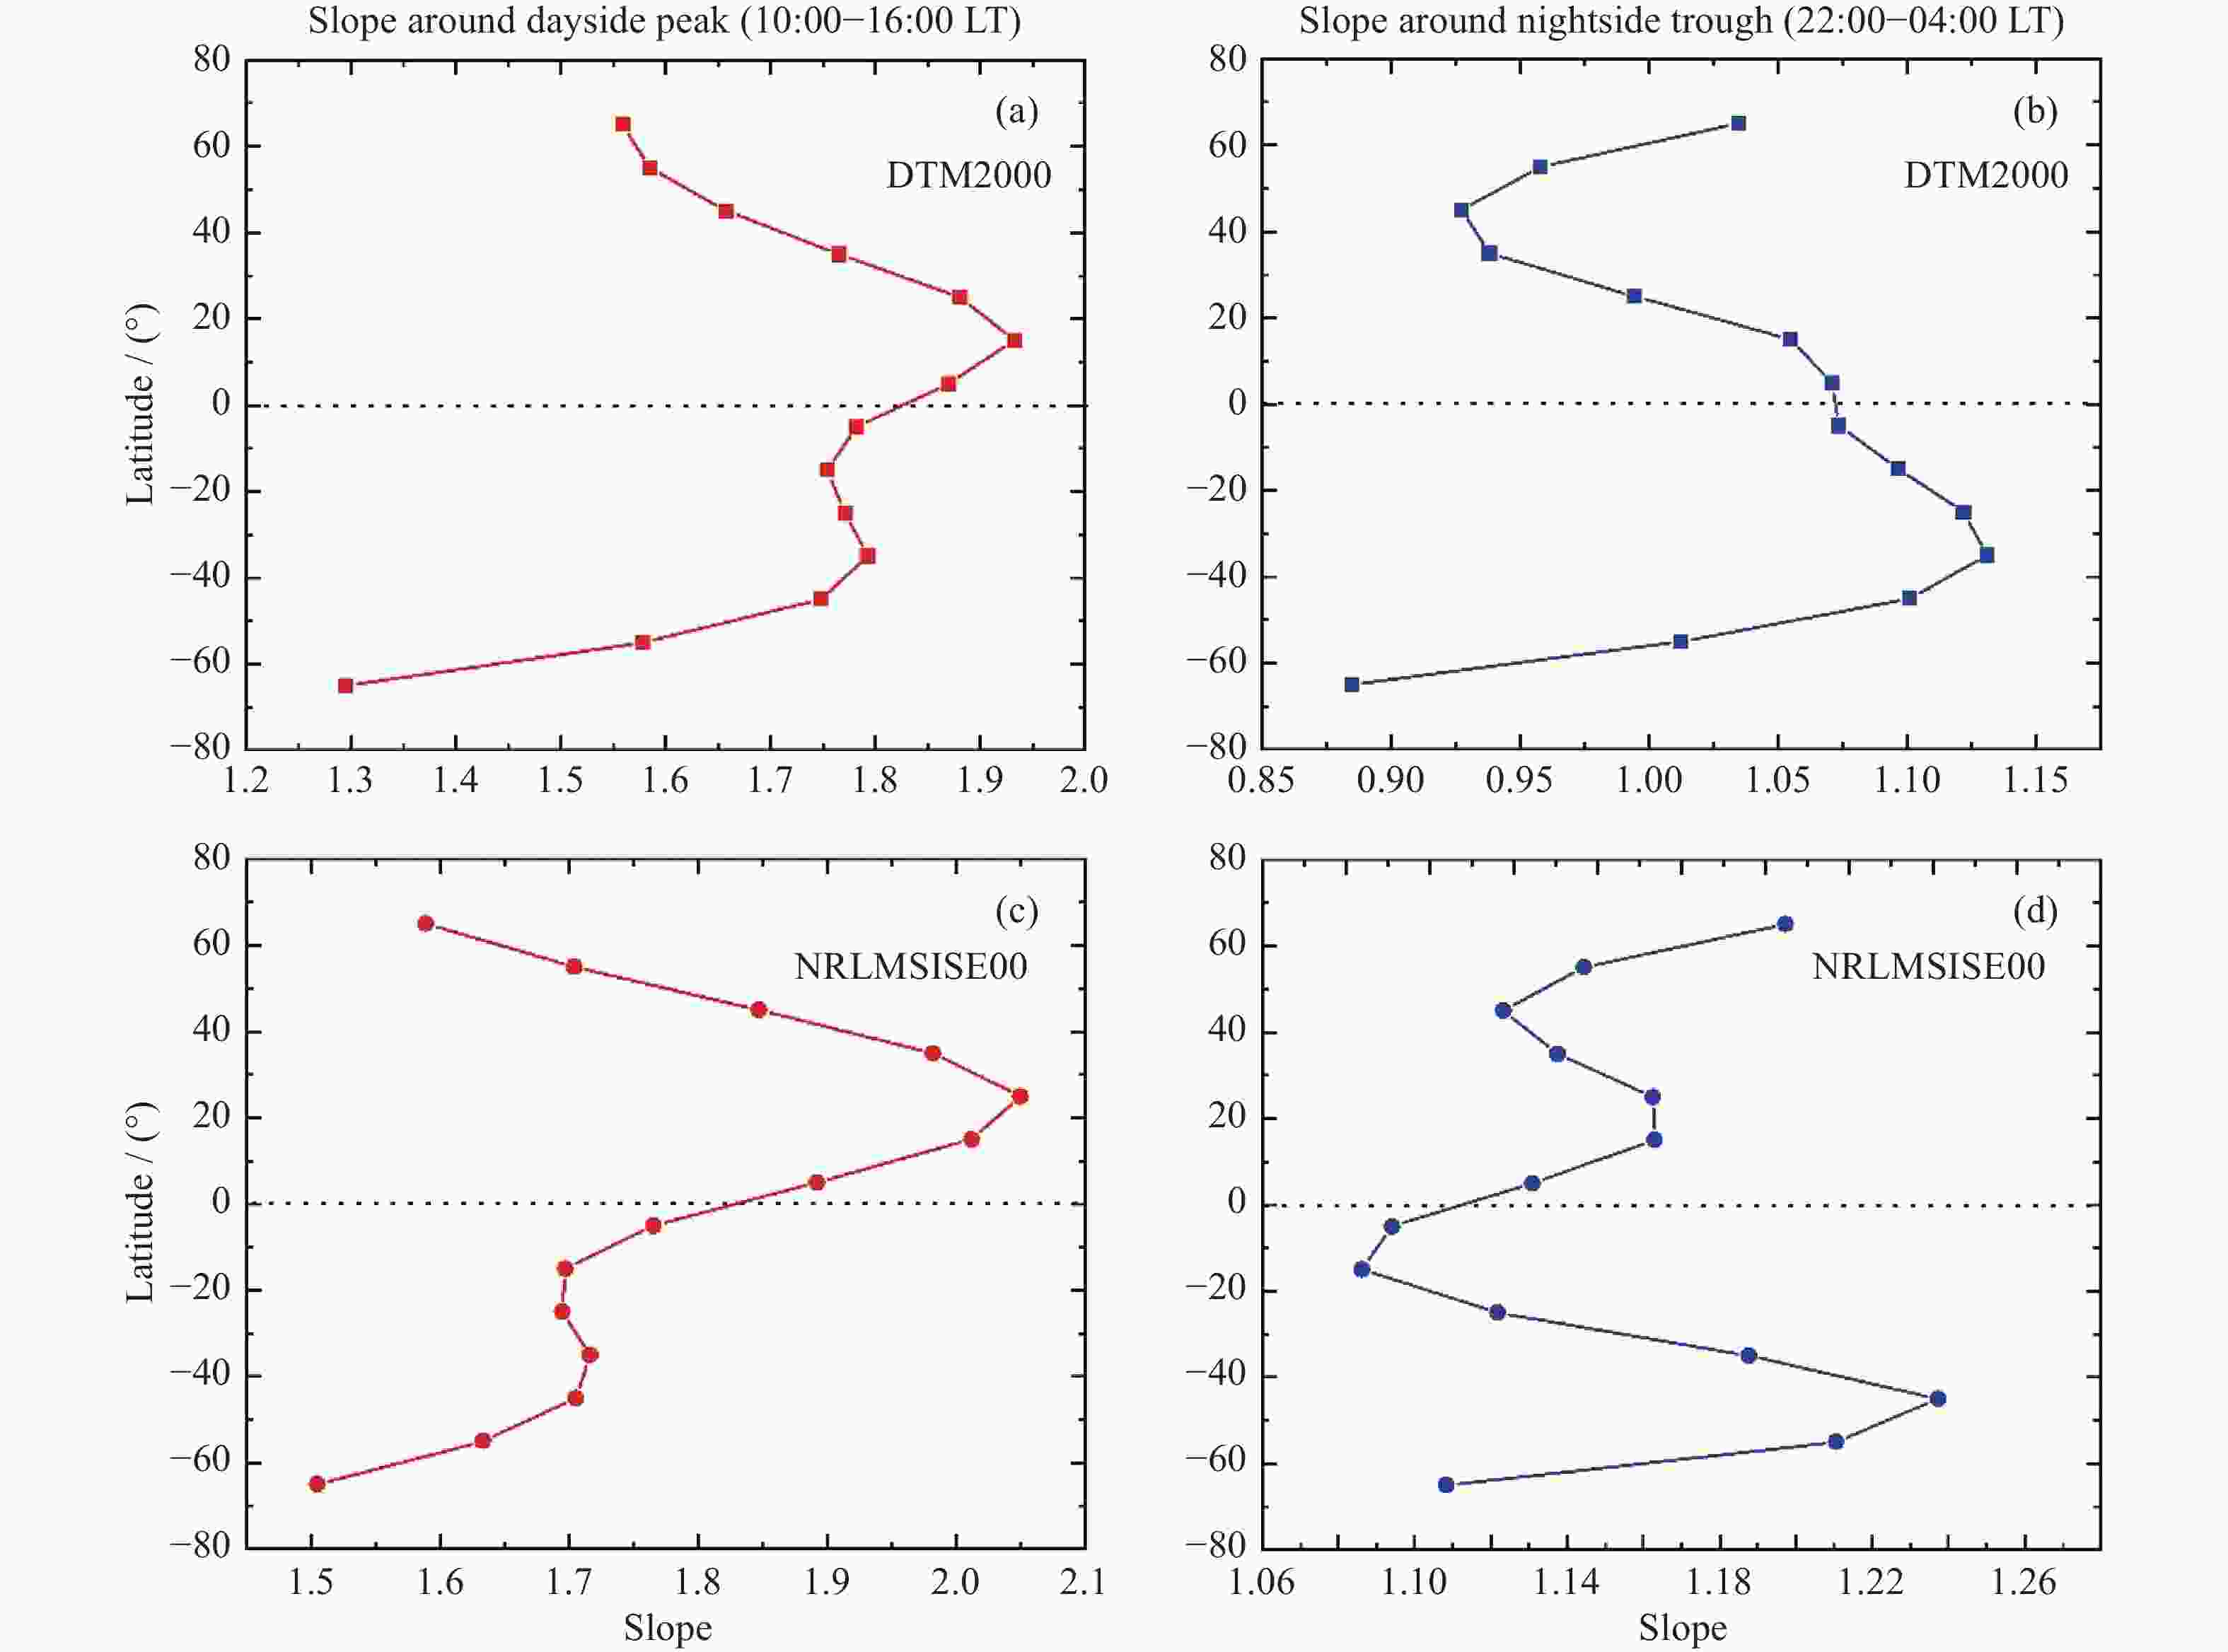
图 11 大气密度对极紫外辐射的线性斜率随地方时和地理纬度的变化(380 km高度大气模型模拟结果)
Figure 11. Slope of linear correlation between densities and EUV measurements at different LT and geomagnetic latitude (simulation results by DTM2000 and NRLMSISE00 at 380 km altitude)
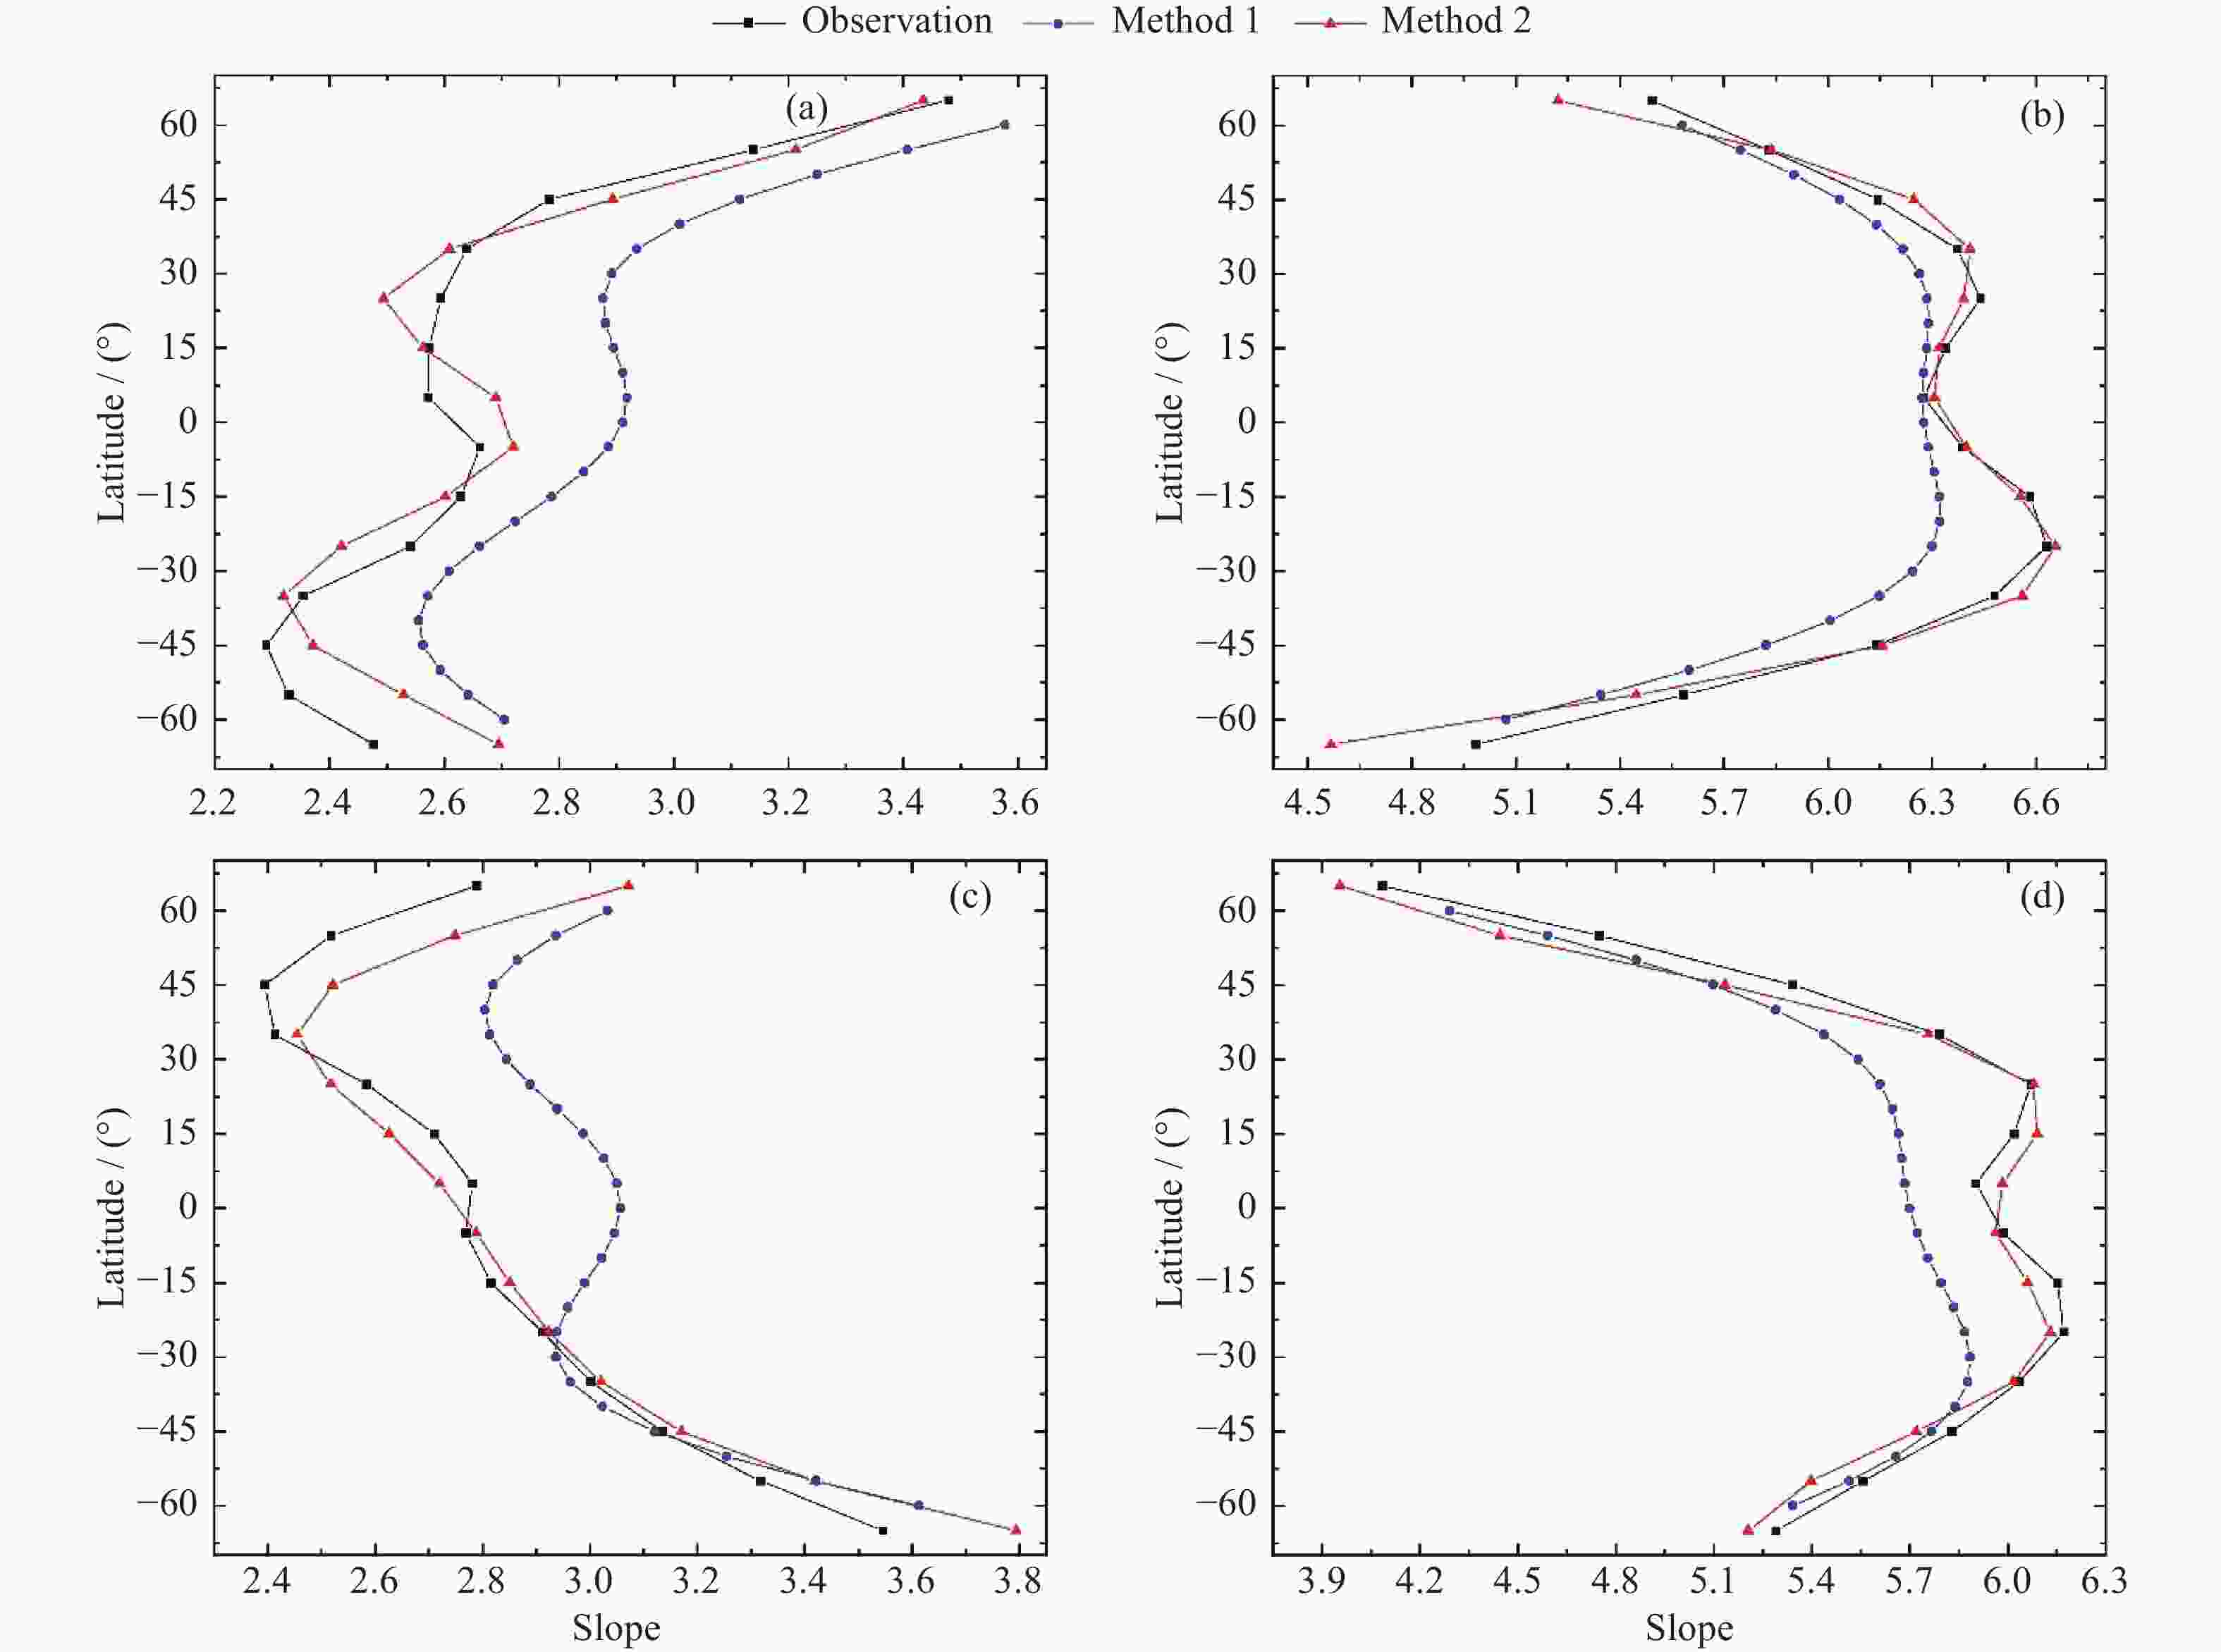
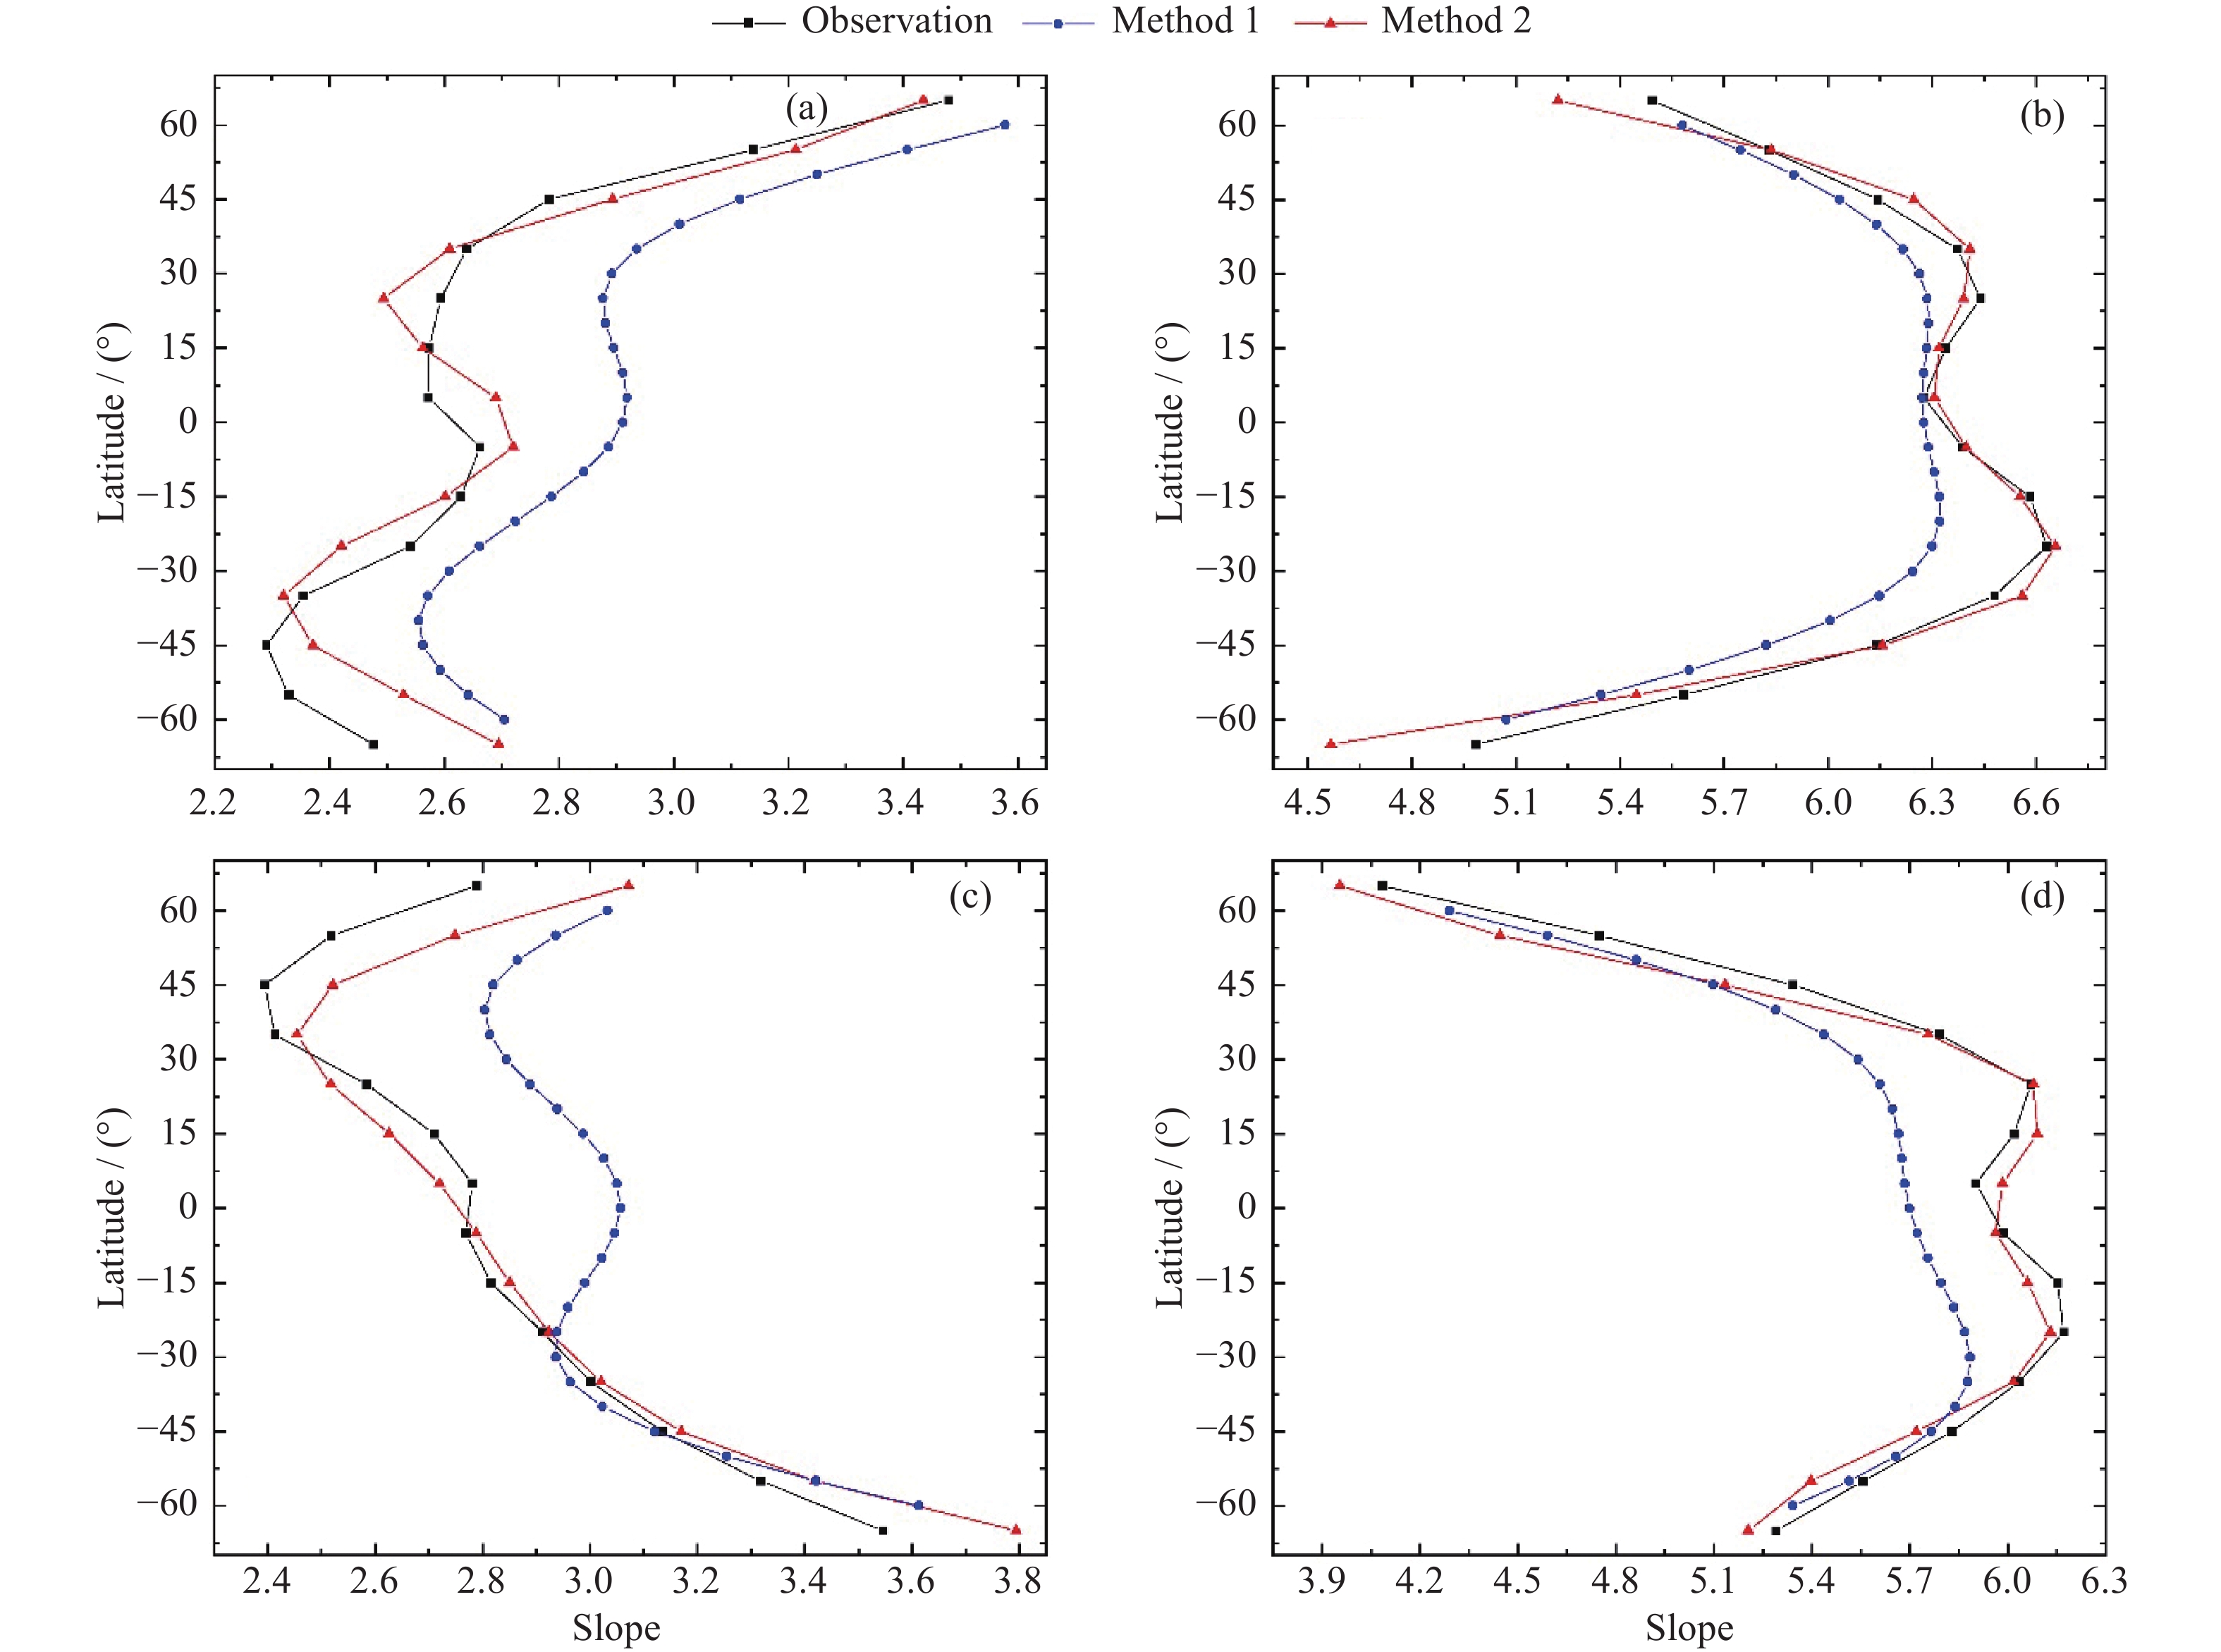
图 12 两种方法的拟合曲线与实测曲线对比。(a)(b)为太阳直射北半球时夜间01:00 LT和白天15:00 LT情形,(c)(d)为太阳直射南半球时夜间01:00 LT和白天15:00 LT情形
Figure 12. Comparison of fitting curves by two methods with the observed curves by CHAMP, graph (a) and (b) are at 01:00 LT and 15:00 LT when sub-solar point in the north hemisphere, and graph (c) and (d) are 01:00 LT and 15:00 LT when sub-solar point in the south hemisphere
表 1 用于研究的卫星数据资料
Table 1. Information of satellites’ data used in this study
Data Satellite Altitude / km Time resolution/s Time range Institution EUV SOHO 1500 000 86 400 2001-10-01至 2021-05-31 NASA, ESA Density CHAMP 330~460 45 2001-10-01至 2008-12-31 Colorado, USA SWARM-C 445~510 10 2014-02-01至 2021-05-31 ESA GRACE-A 420~520 10 2002-04-05至 2008-12-31
2009-01-01至 2014-12-05Corolado,USA
PMO 下载: 导出CSV
表 2 不同地方时的相关系数和斜率(CHAMP)
Table 2. Correlation coefficients and slopes at different LT(CHAMP)
LT R via F10.7 R via SEM Slope via SEM 01:00 0.935 0.975 2.841 03:00 0.966 0.981 3.068 05:00 0.963 0.962 2.908 07:00 0.921 0.966 3.711 09:00 0.965 0.960 4.578 11:00 0.955 0.961 5.133 13:00 0.944 0.982 5.510 15:00 0.972 0.988 5.848 17:00 0.966 0.968 4.861 19:00 0.918 0.969 4.296 21:00 0.959 0.958 3.821 23:00 0.946 0.952 3.398
下载: 导出CSV
表 3 用不同太阳辐射参数计算的相关系数平均值和白天夜晚区域的斜率平均值
Table 3. Average results of correlation coefficient via different solar parameters of solar radiation, and the average slopes in the dayside and nightside
Satellite Average R Slope via SEM F10.7 SEM dayside nightside CHAMP 0.951 0.968 4.940 3.389 SWARM-C 0.926 0.938 1.278 0.744 GRACE-A 0.915 0.923 1.030 0.603
下载: 导出CSV
表 4 多元回归函数方法与6阶球谐函数方法的拟合效果对比
Table 4. Fitting results of multiple regression method and six-order spherical harmonics method
Multiple Regression method Spherical Harmonics method (STD1-STD2)/
STD1/(%)R1 STD1 R2 STD2 CHAMP N 0.978 0.260 0.996 0.114 56 S 0.982 0.205 0.995 0.107 48 SWARM-C N 0.991 0.053 0.997 0.032 40 S 0.971 0.103 0.992 0.054 48 GRACE-A N 0.966 0.077 0.991 0.040 48 S 0.988 0.055 0.997 0.028 49 注 N和S分别为太阳直射北半球和南半球情形。
下载: 导出CSV
-
[1] HARRISON R A, SAWYER E C, CARTER M K, et al. The coronal diagnostic spectrometer for the solar and heliospheric observatory[J]. Solar Physics, 1995, 162(1/2): 233-290 [2] HOVESTADT D, HILCHENBACH M, BÜRGI A, et al. CELIAS – Charge, element and isotope analysis system for SOHO[J]. Solar Physics, 1995, 162(1/2): 441-481 [3] WOODS T N, EPARVIER F G, BAILEY S M, et al. Solar EUV Experiment (SEE): mission overview and first results[J]. Journal of Geophysical Research: Space Physics, 2005, 110(A1): A01312 [4] WOODS T N, EPARVIER F G, HOCK R, et al. Extreme Ultraviolet Variability Experiment (EVE) on the Solar Dynamics Observatory (SDO): overview of science objectives, instrument design, data products, and model developments[J]. Solar Physics, 2012, 275(1/2): 115-143 [5] 唐成, 李嘉巍, 张效信, 等. 第23太阳活动周热层大气密度对太阳辐射指数F10.7响应的模拟研究[J]. 空间科学学报, 2021, 41(5): 704-714 doi: 10.11728/cjss2021.05.704TANG Cheng, LI Jiawei, ZHANG Xiaoxin, et al. TIEGCM numerical study on the thermospheric density response to solar F10.7 radio flux variations during the 23 rd solar cycle[J]. Chinese Journal of Space Science, 2021, 41(5): 704-714 doi: 10.11728/cjss2021.05.704 [6] TOBISKA W K, BOUWER S D, BOWMAN B R. The development of new solar indices for use in thermospheric density modeling[J]. Journal of Atmospheric and Solar-Terrestrial Physics, 2008, 70(5): 803-819 doi: 10.1016/j.jastp.2007.11.001 [7] 汪宏波, 赵长印. 不同太阳辐射指数对大气模型精度的影响分析[J]. 中国科学G辑: 物理学 力学 天文学, 2009, 39(7): 1120-1128 doi: 10.1007/s11433-009-0133-yWANG Hongbo, ZHAO Changyin. Effects of various solar indices on accuracy of Earth’s thermospheric neutral density models[J]. Science in China Series G: Physics, Mechanics and Astronomy, 2009, 39(7): 1120-1128 doi: 10.1007/s11433-009-0133-y [8] BRUINSMA S, TAMAGNAN D, BIANCALE R. Atmospheric densities derived from CHAMP/STAR accelerometer observations[J]. Planetary and Space Science, 2004, 52(4): 297-312 doi: 10.1016/j.pss.2003.11.004 [9] SUTTON E K, NEREM R S, FORBES J M. Density and winds in the thermosphere deduced from accelerometer data[J]. Journal of Spacecraft and Rockets, 2007, 44(6): 1210-1219 doi: 10.2514/1.28641 [10] REIGBER C, LÜHR H, SCHWINTZER P. CHAMP mission status[J]. Advances in Space Research, 2002, 30(2): 129-134 doi: 10.1016/S0273-1177(02)00276-4 [11] TAPLEY B D, BETTADPUR S, WATKINS M, et al. The gravity recovery and climate experiment: mission overview and early results[J]. Geophysical Research Letters, 2004, 31(9): L09607 [12] 汪宏波, 熊永清, 赵长印. 基于精密光压模型的GRACE卫星加速仪校标新方法[J]. 天文学报, 2016, 57(5): 544-559 doi: 10.15940/j.cnki.0001-5245.2016.05.005WANG Hongbo, XIONG Yongqing, ZHAO Changyin. The new calibration method of accelerometer in GRACE satellites based on precise solar radiation model[J]. Acta Astronomica Sinica, 2016, 57(5): 544-559 doi: 10.15940/j.cnki.0001-5245.2016.05.005 [13] FRIIS-CHRISTENSEN E, LÜHR H, KNUDSEN D, et al. Swarm-an earth observation mission investigating geospace[J]. Advances in Space Research, 2008, 41(1): 210-216 doi: 10.1016/j.asr.2006.10.008 [14] GUO J P, WAN W X, FORBES J M, et al. Effects of solar variability on thermosphere density from CHAMP accelerometer data[J]. Journal of Geophysical Research: Space Physics, 2007, 112(A10): A10308 [15] JACCHIA L G. Thermospheric Temperature, Density, and Composition: New Models[R]. Cambridge: Smithsonian Institution Astrophysical Observatory, 1977 [16] HEDIN A E. Correlations between thermospheric density and temperature, solar EUV Flux, and 10.7-cm Flux variations[J]. Journal of Geophysical Research, 1984, 89(A11): 9828-9834 doi: 10.1029/JA089iA11p09828 [17] HEDIN A E, MAYR H G. Solar EUV induced variations in the thermosphere[J]. Journal of Geophysical Research, 1987, 92(D1): 869-875 doi: 10.1029/JD092iD01p00869 [18] LIU H, LÜHR H. Strong disturbance of the upper thermospheric density due to magnetic storms: CHAMP observations[J]. Journal of Geophysical Research: Space Physics, 2005, 110(A9): A09S29 [19] BRUINSMA S, THUILLIER G, BARLIER F. The DTM-2000 empirical thermosphere model with new data assimilation and constraints at lower boundary: accuracy and properties[J]. Journal of Atmospheric and Solar-Terrestrial Physics, 2003, 65(9): 1053-1070 doi: 10.1016/S1364-6826(03)00137-8 [20] PICONE J M, HEDIN A E, DROB D P, et al. NRLMSISE-00 empirical model of the atmosphere: statistical comparisons and scientific issues[J]. Journal of Geophysical Research: Space Physics, 2002, 107(A12): 1468 [21] REBER C A, HAYS P B. Thermospheric wind effects on the distribution of helium and argon in the Earth’s upper atmosphere[J]. Journal of Geophysical Research, 1973, 78(16): 2977-2991 doi: 10.1029/JA078i016p02977 [22] LIU X J, WANG W B, THAYER J P, et al. The winter helium bulge revisited[J]. Geophysical Research Letters, 2014, 41(19): 6603-6609 doi: 10.1002/2014GL061471 [23] KEATING G, PRIOR E. The winter helium bulge[J]. Space Research, 1968, 8: 982 [24] SUTTON E K. Interhemispheric transport of light neutral species in the thermosphere[J]. Geophysical Research Letters, 2016, 43(24): 12325-12332 -
-

 下载:
下载:

计量
- 文章访问数: 1157
- HTML全文浏览量: 503
- PDF下载量: 84
-
被引次数:
0(来源:Crossref)
0(来源:其他)

