


时变体数据传输函数设计及其在行星际数值模拟结果可视化中的应用
doi: 10.11728/cjss2023.03.2022-0011 cstr: 32142.14.cjss2023.03.2022-0011
A Time-varying Volume Data Transfer Function for Interplanetary Numerical Simulation Data
-
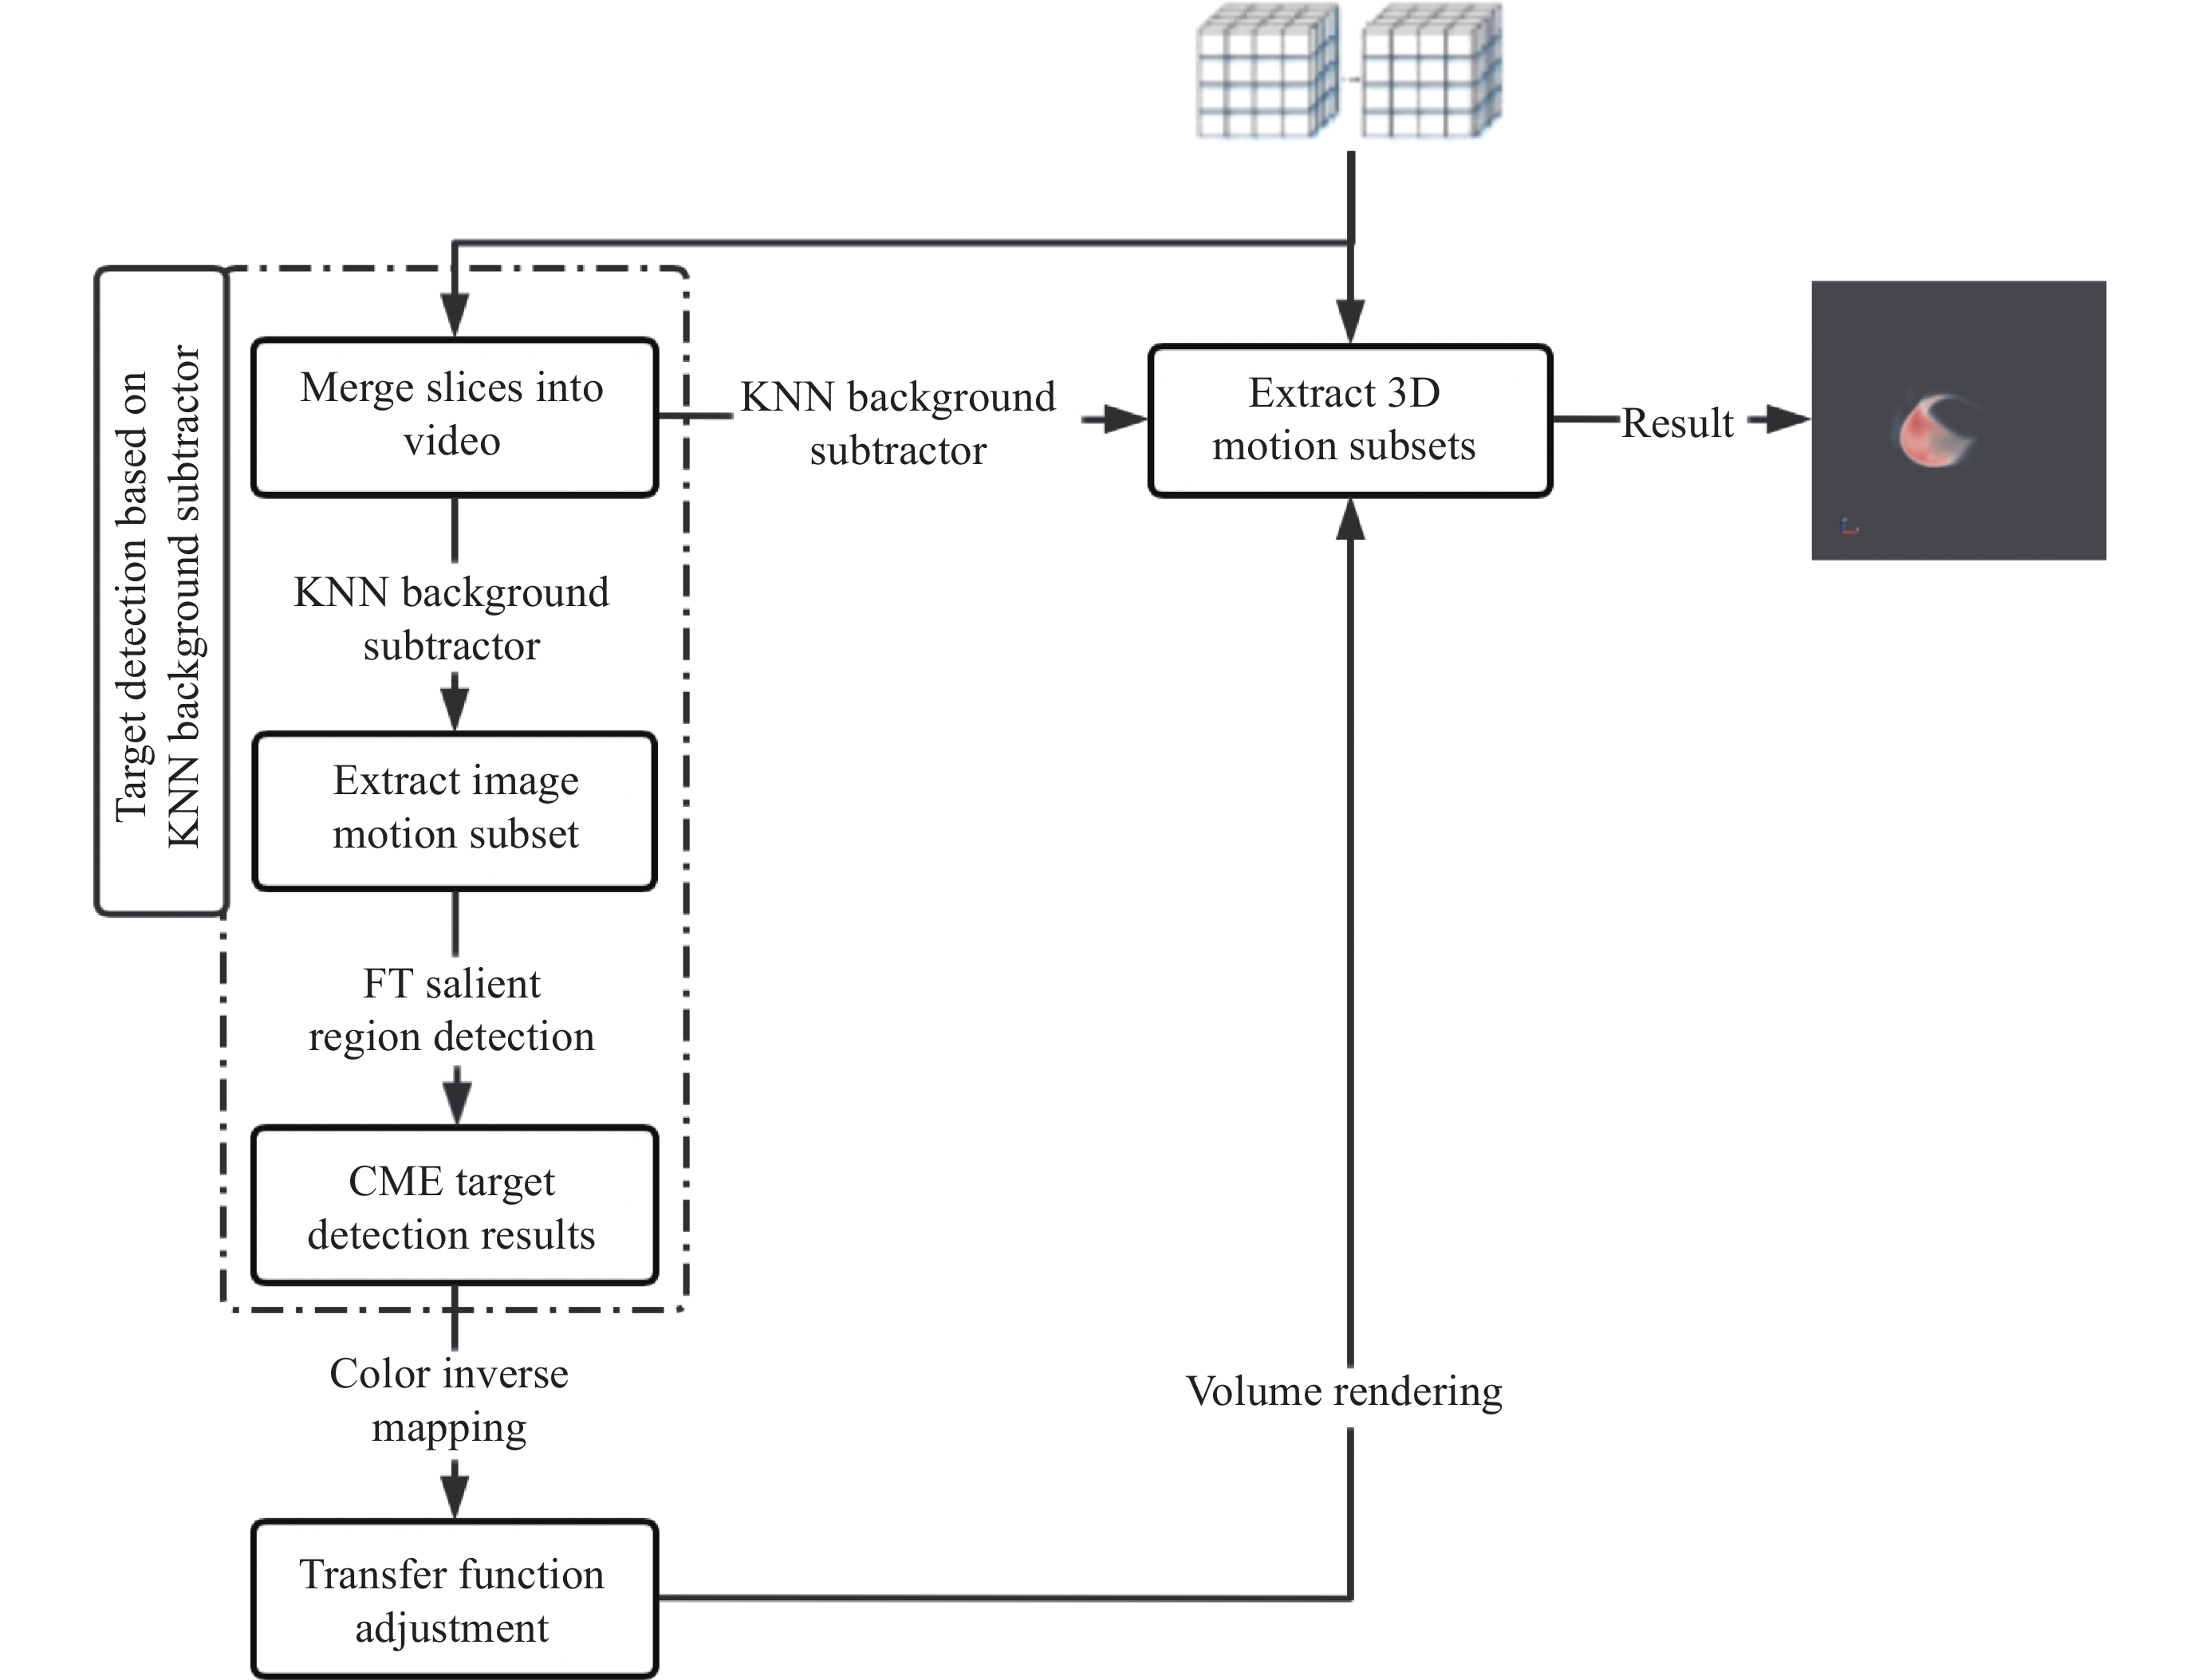
摘要: 为便于太阳风暴行星际传播数值模型结果可视化分析,提出一种针对时变模拟数据体绘制的传输函数设计算法(Transfer Function for Time-varying Volume data,TFTV)。该算法首先基于KNN(K-Nearest Neighbors,KNN)背景差分法提取运动区域;然后,利用频率调谐(Frequency Tuned,FT)显著性算法检测日冕物质抛射(Coronal Mass Ejection,CME),并设计颜色反映射算法查找CME与背景的分界阈值;最后,基于阈值自适应调整传输函数实现各时间步上运动区域中CME的快速三维可视化。实验结果表明,该算法能够适应静态及动态背景下CME的数值模型结果,相对于线性传输函数有效避免了视线方向的遮挡,直观自动地展示了相对动量的变化,示踪行星际空间中CME的演化过程,局部区域的提取降低了数据冗余,借助算法自动分析数据自适应调整传输函数避免了人工调整的低效性。Abstract: Understanding the interplanetary propagation of solar storms is the foundation of space environmental forecasting and services. The visualization of numerical model simulation data is an important method to analyze the propagation dynamics process and verify the validity of the model. In order to facilitate the visualization analysis of the numerical model simulation data with increasing simulation scale, a Transfer Function for Time-varying Volume data rendering (TFTV) based on the characteristics of time domain and frequency domain is proposed. The algorithm is designed to extract images including motion regions based on the K-Nearest Neighbor (KNN) background subtraction method, and then the three-dimensional subset of the moving region can be extracted according to the mapping relationship between the image and the volume data to achieve the reduction of large-scale grid volume data. Then the Frequency Tuned (FT) salient region detection algorithm is used to detect Coronal Mass Ejection (CME) in motion area images, and according to the CME detection results, a color inverse mapping algorithm is designed to find the boundary threshold between the CME and interplanetary space background. Finally, the transfer function design in volume visualization is adaptively adjusted based on the threshold to realize the fast 3D visualization of CME in the motion region at each time step. The experimental results show that TFTV transfer function algorithm can adapt to the numerical model simulation data in static and dynamic backgrounds. Compared with the linear transfer function, the occlusion of the line in sight direction is effectively avoided, the change of relative momentum is intuitively and automatically displayed, and the evolution process of CME in interplanetary space is traced. The extraction of local regions reduces data redundancy, and the process of adaptively adjusting the transfer function by automatically analyzing the data with the help of algorithms avoids the inefficiency of manual adjustment.
-
Key words:
- Volume rendering /
- Transfer function /
- Visualization /
- Numerical simulation
-
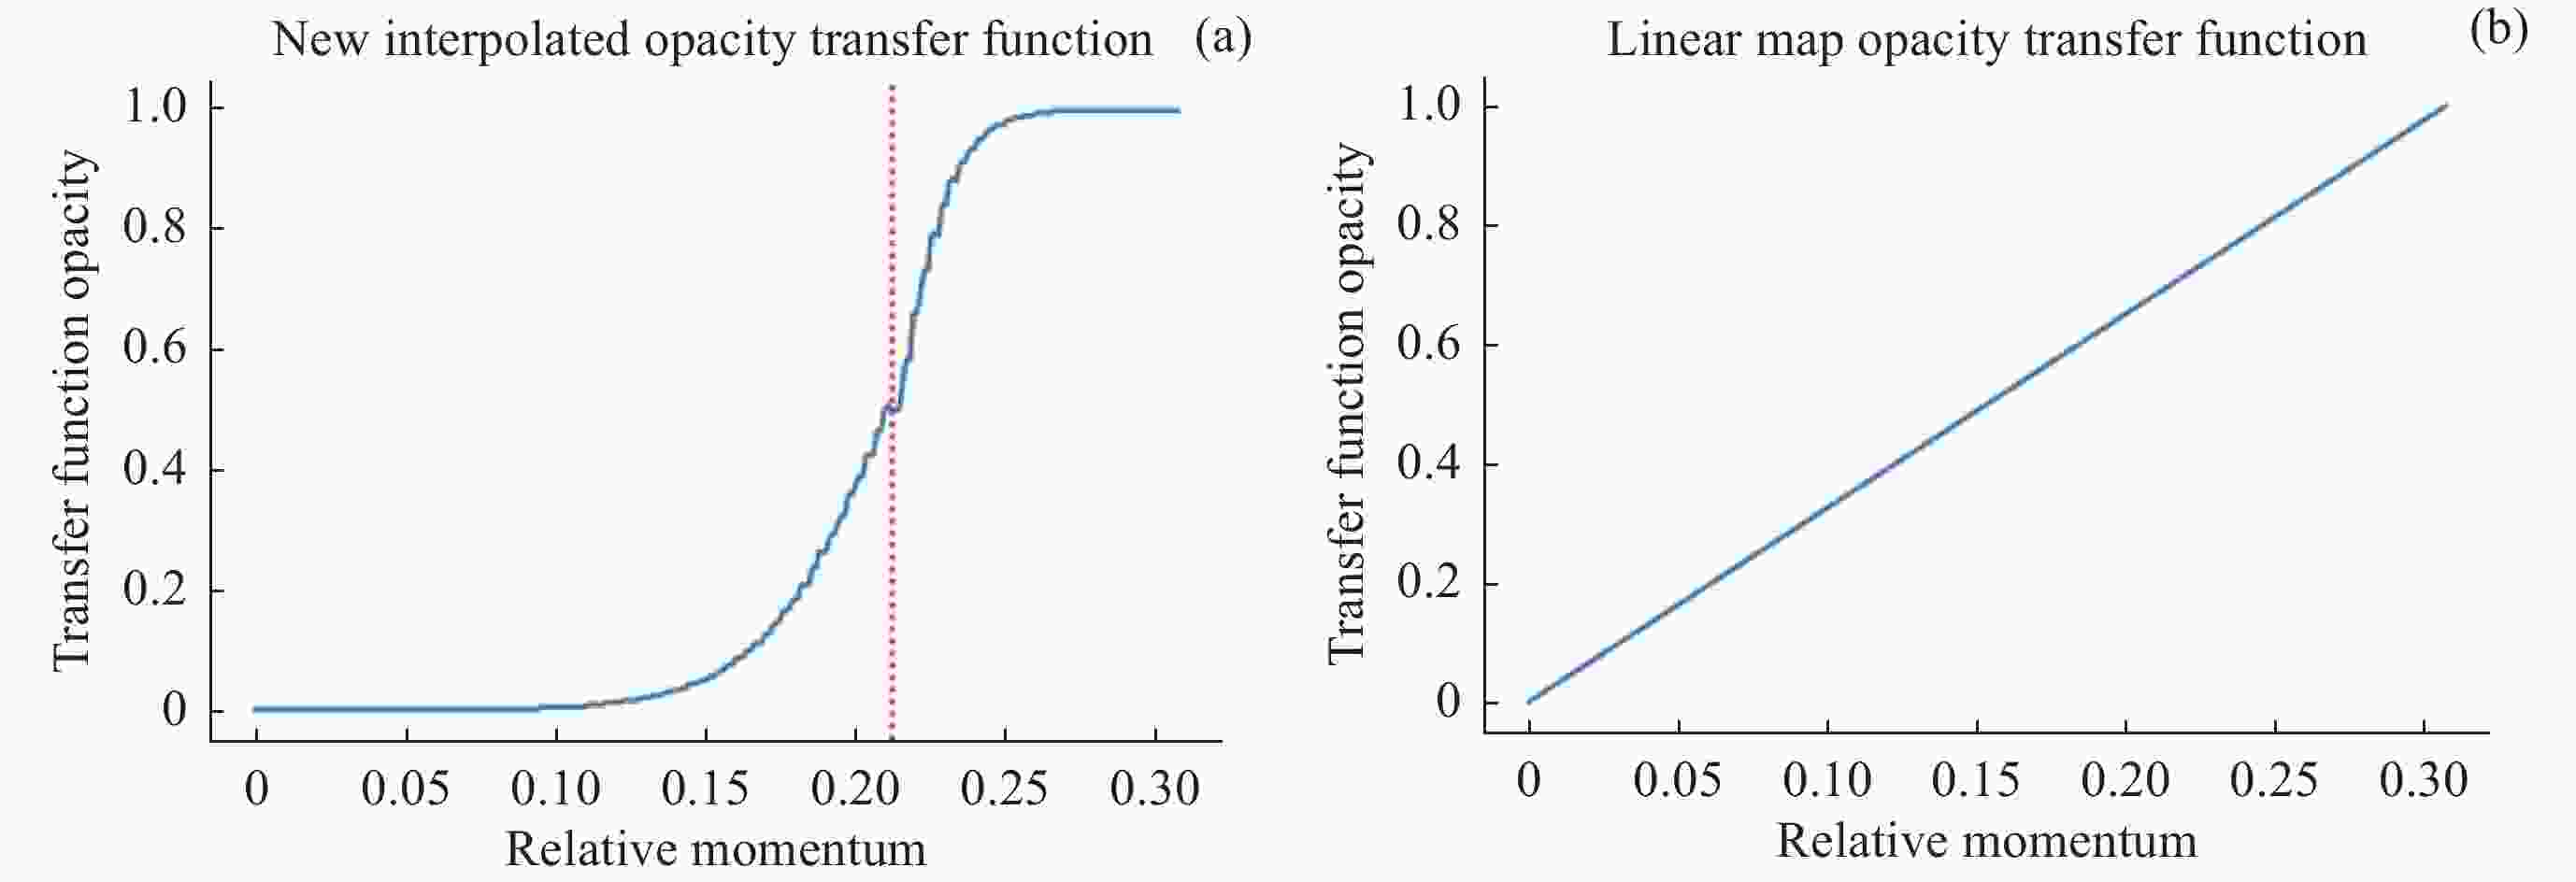
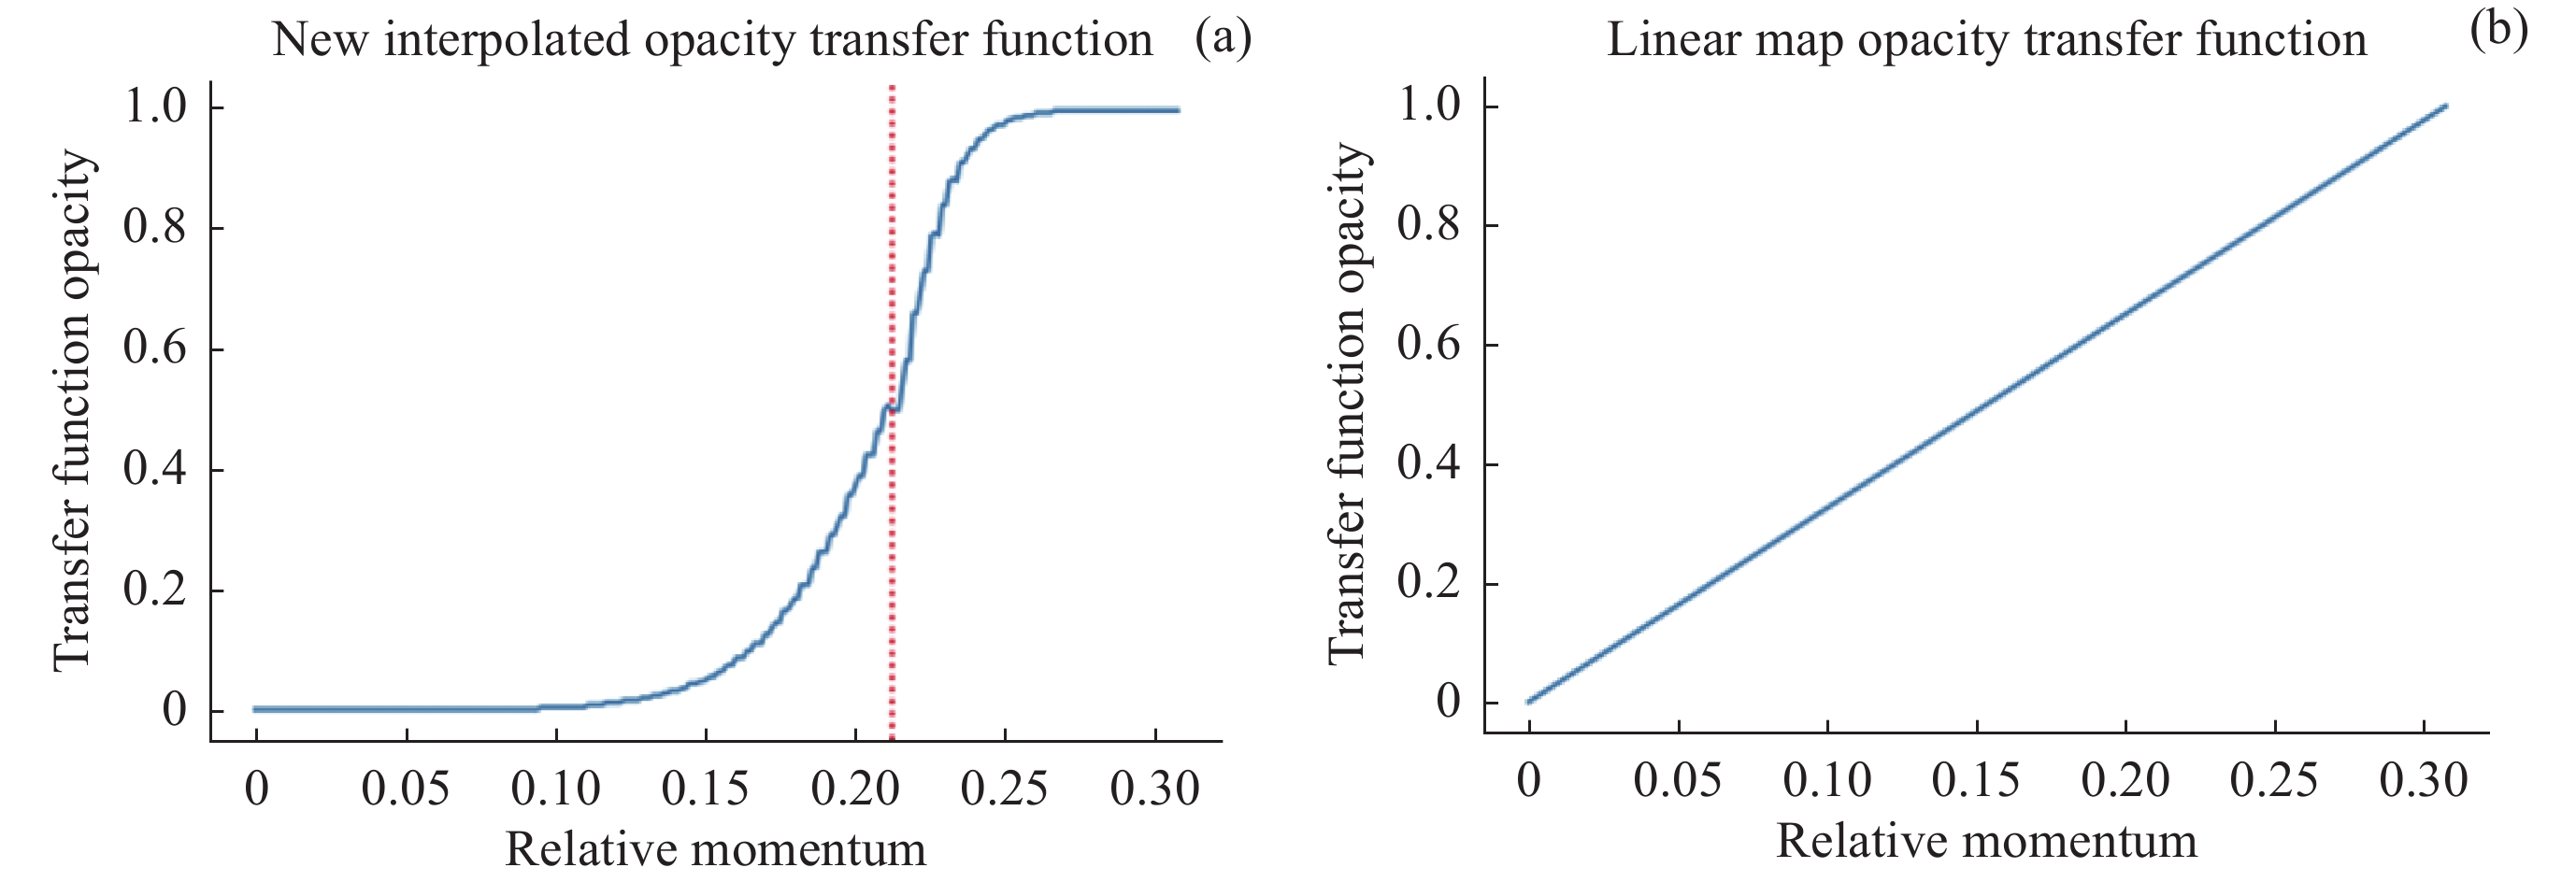
图 3 (a) 基于阈值设计的新不透明度映射函数,红色虚线为阈值。(b) Paraview与Visit三维可视化软件常用的一般线性函数不透明度映射函数
Figure 3. (a) New opacity mapping function based on threshold design, the red dotted line is the threshold. (b) General linear function opacity mapping function commonly used in Paraview and Visit 3D visualization software
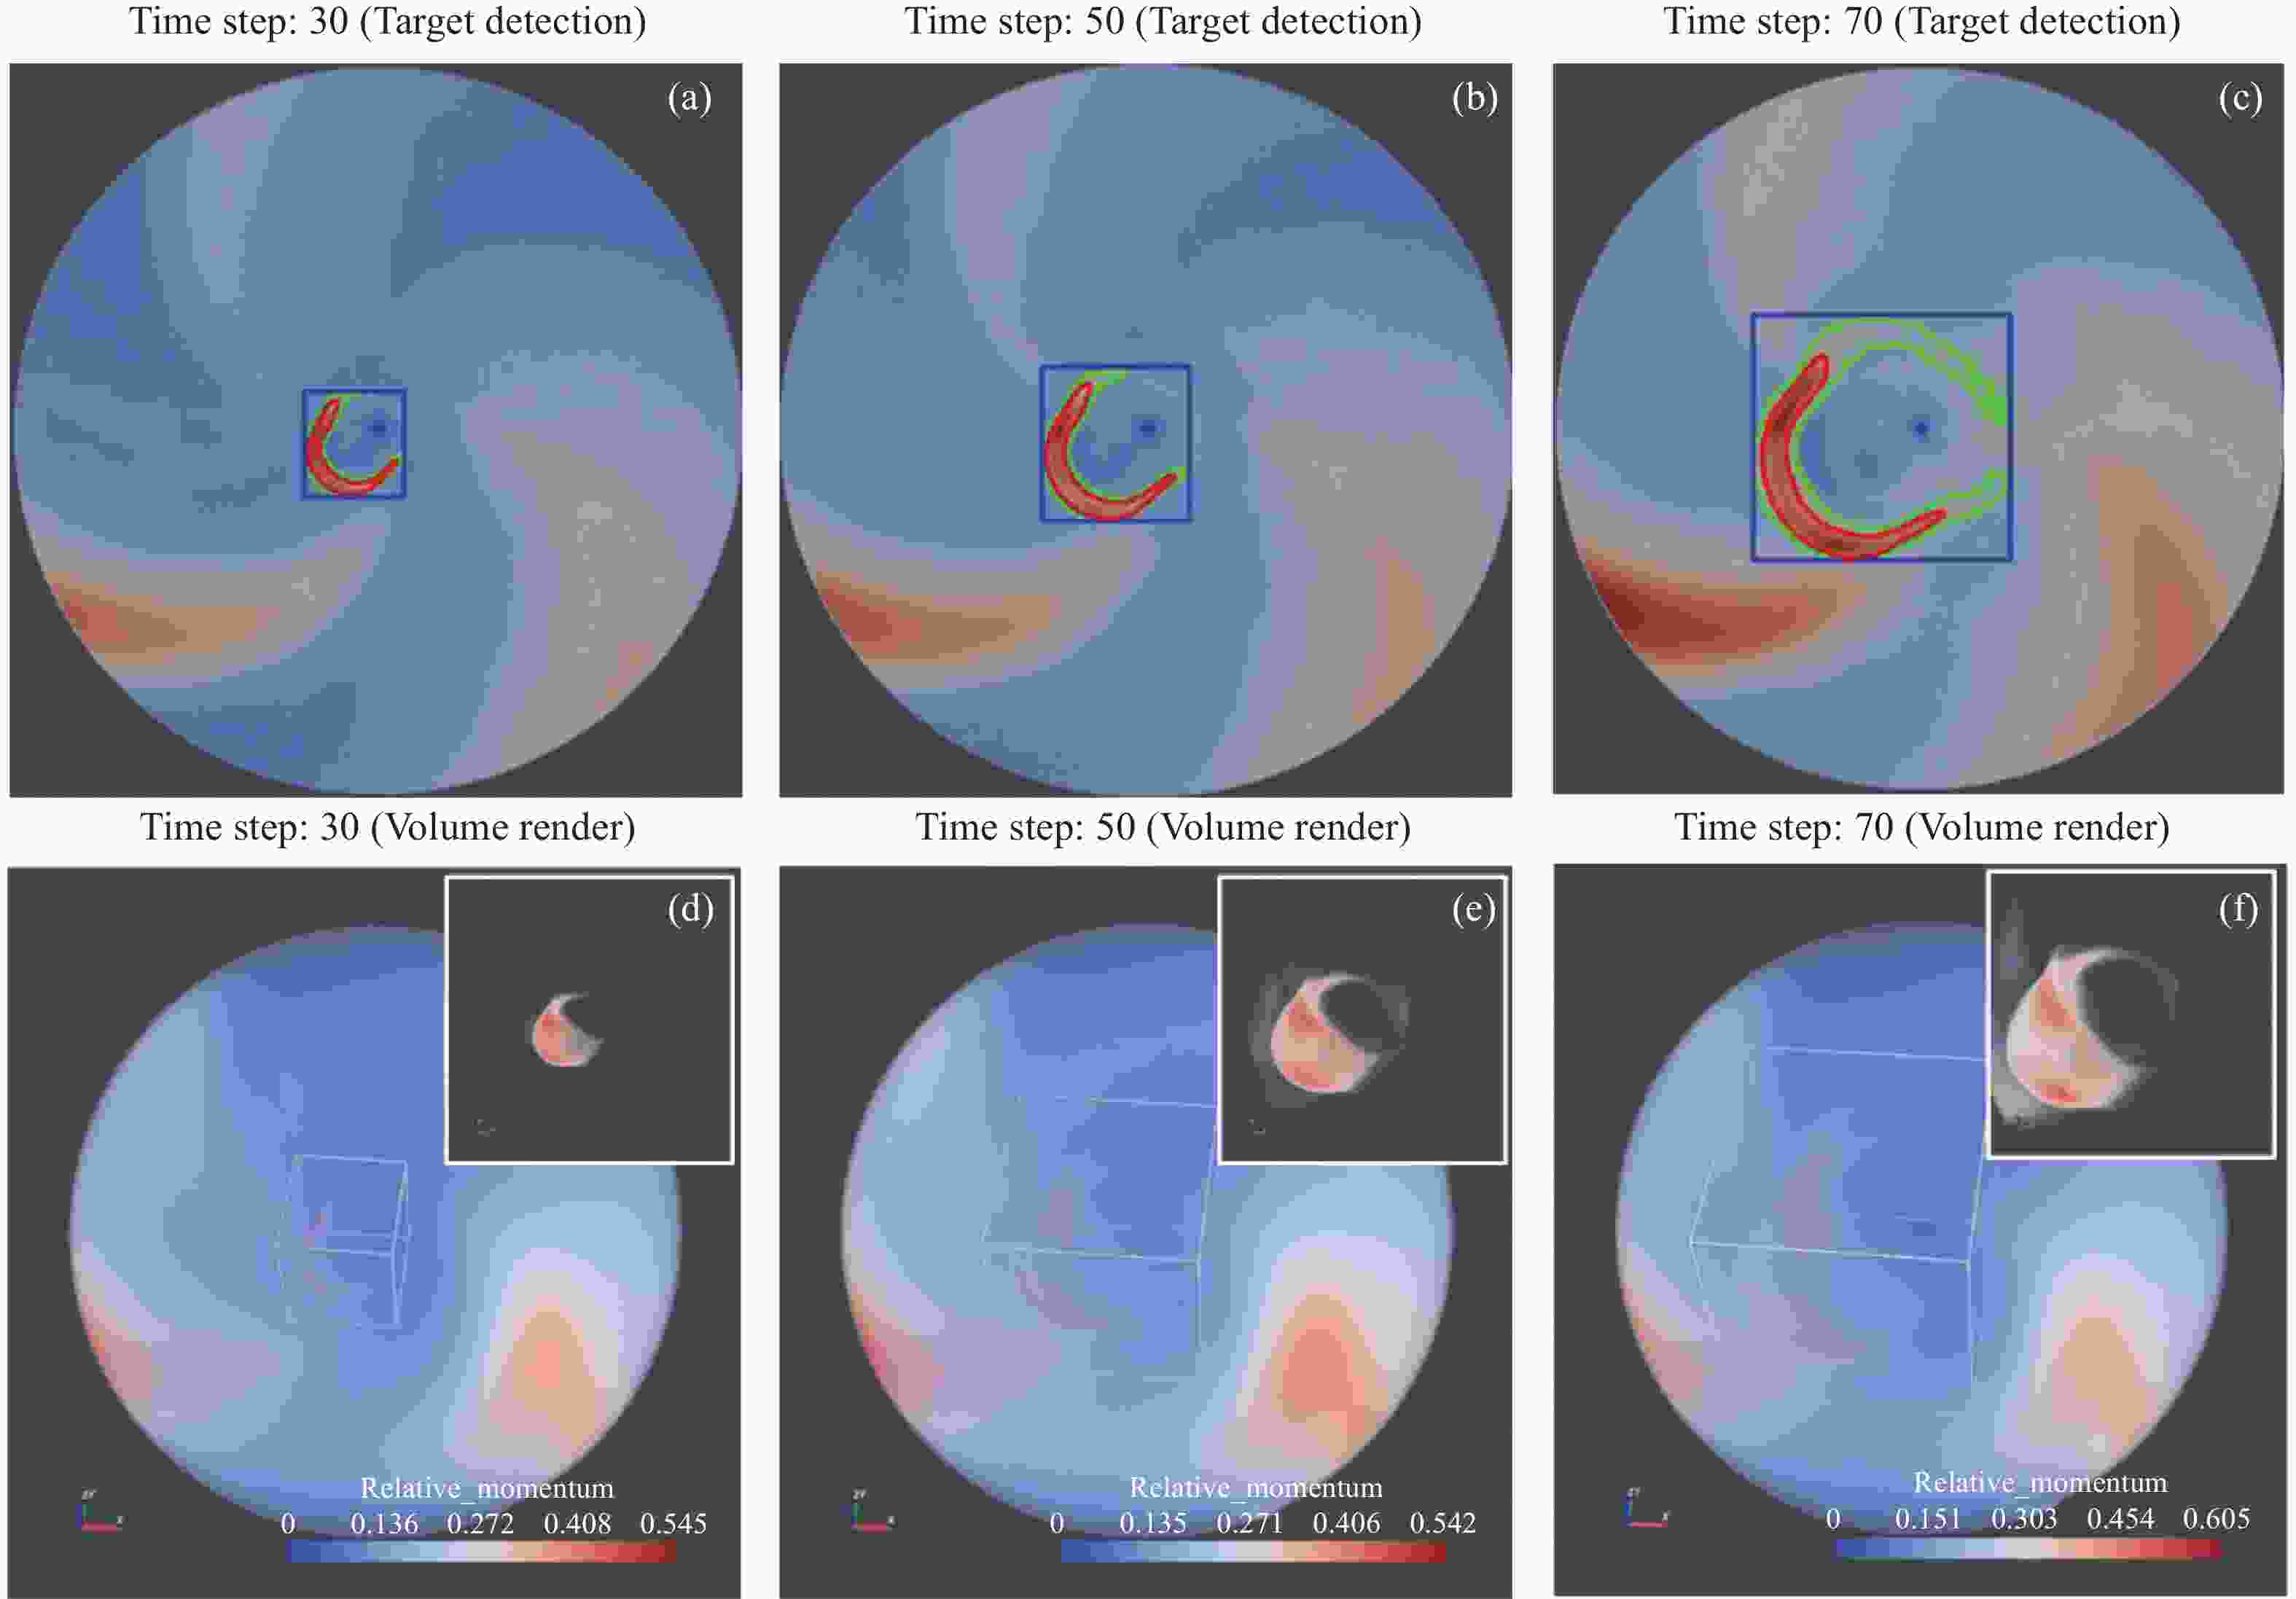
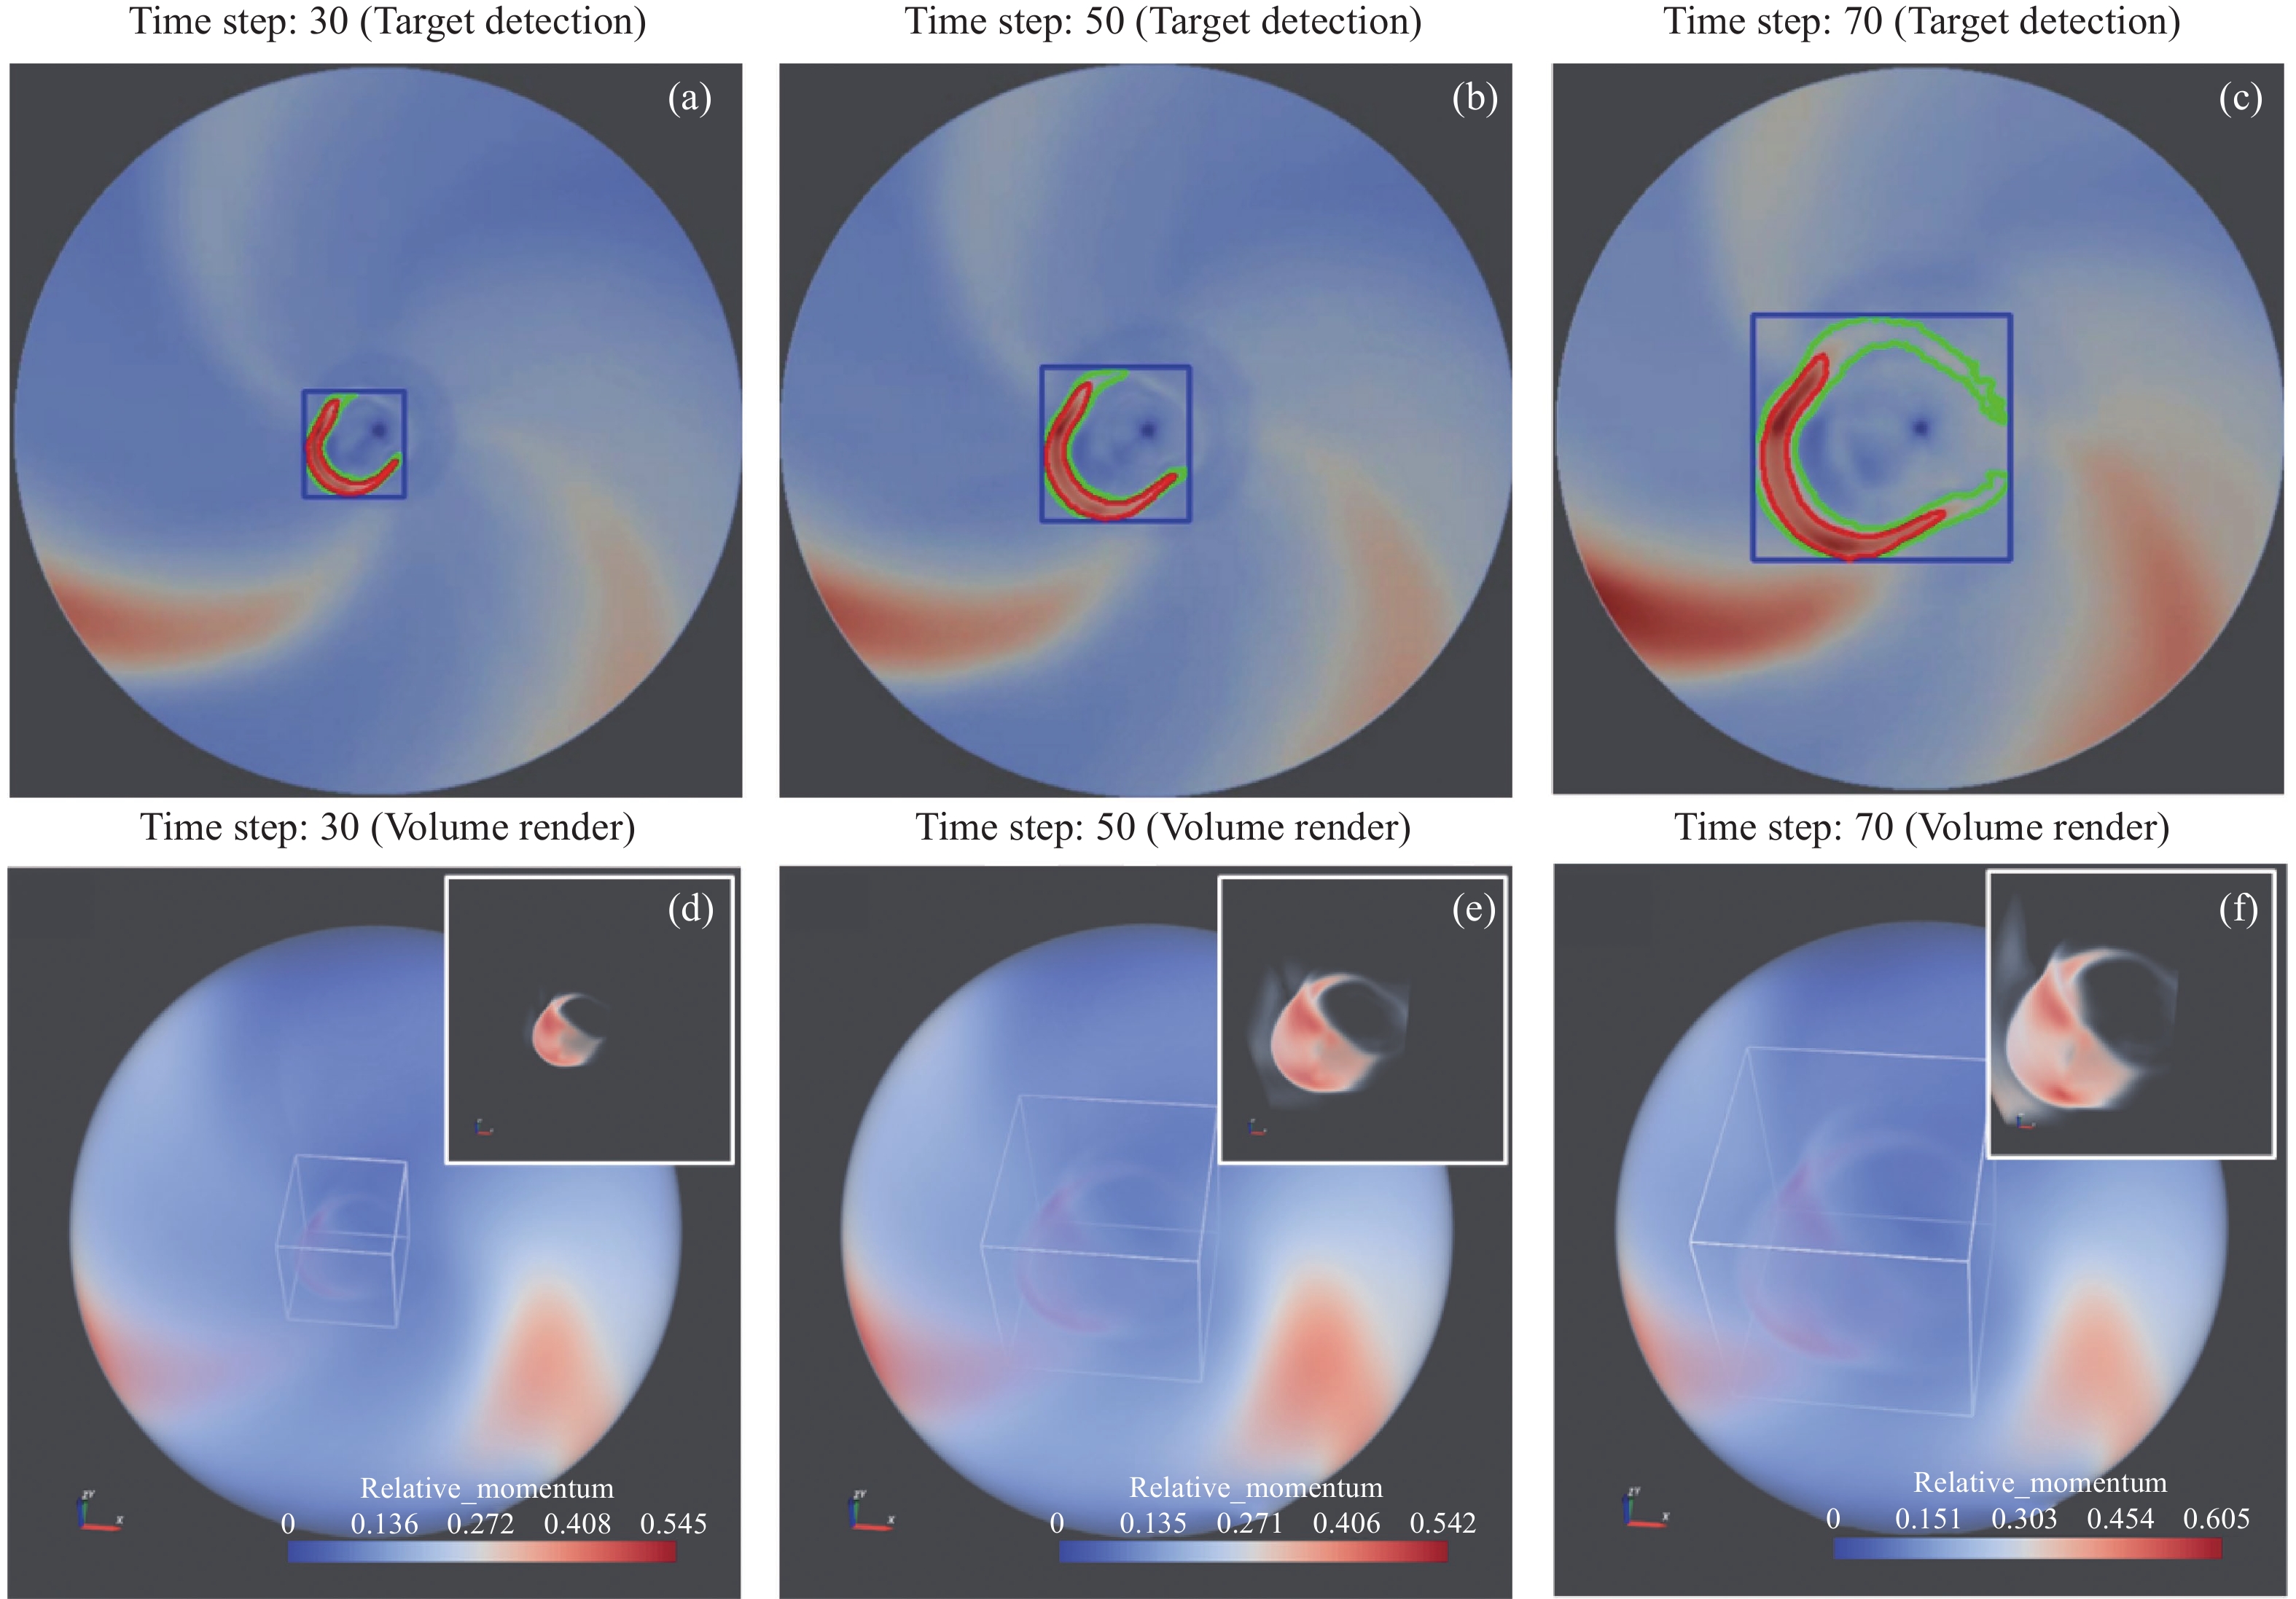
图 4 事件A:第30,50,70 三个时间步体数据相对动量的赤道面检测结果及体绘制结果。(a)~(c)中红绿蓝轮廓分别表示本文CME最终检测结果、KNN背景差分法检测结果、运动区域外接矩形,(d)~(f)大图为线性映射的体绘制效果、内部白色边框为提取的运动子集、右上小图为本文TFTV体绘制效果
Figure 4. Event A: the equatorial plane detection results and volume rendering results of the relative momentum volume data at 30th, 50th, and 70th time steps. In (a)~(c), the red, green and blue outlines respectively represent the final detection result of CME, the detection result of KNN background subtraction method, outer boundary of the moving area. In (d)~(f), the large is the volume rendering result of linear mapping, the inner white border is the extracted motion subset, the upper right is the TFTV volume rendering result in this article
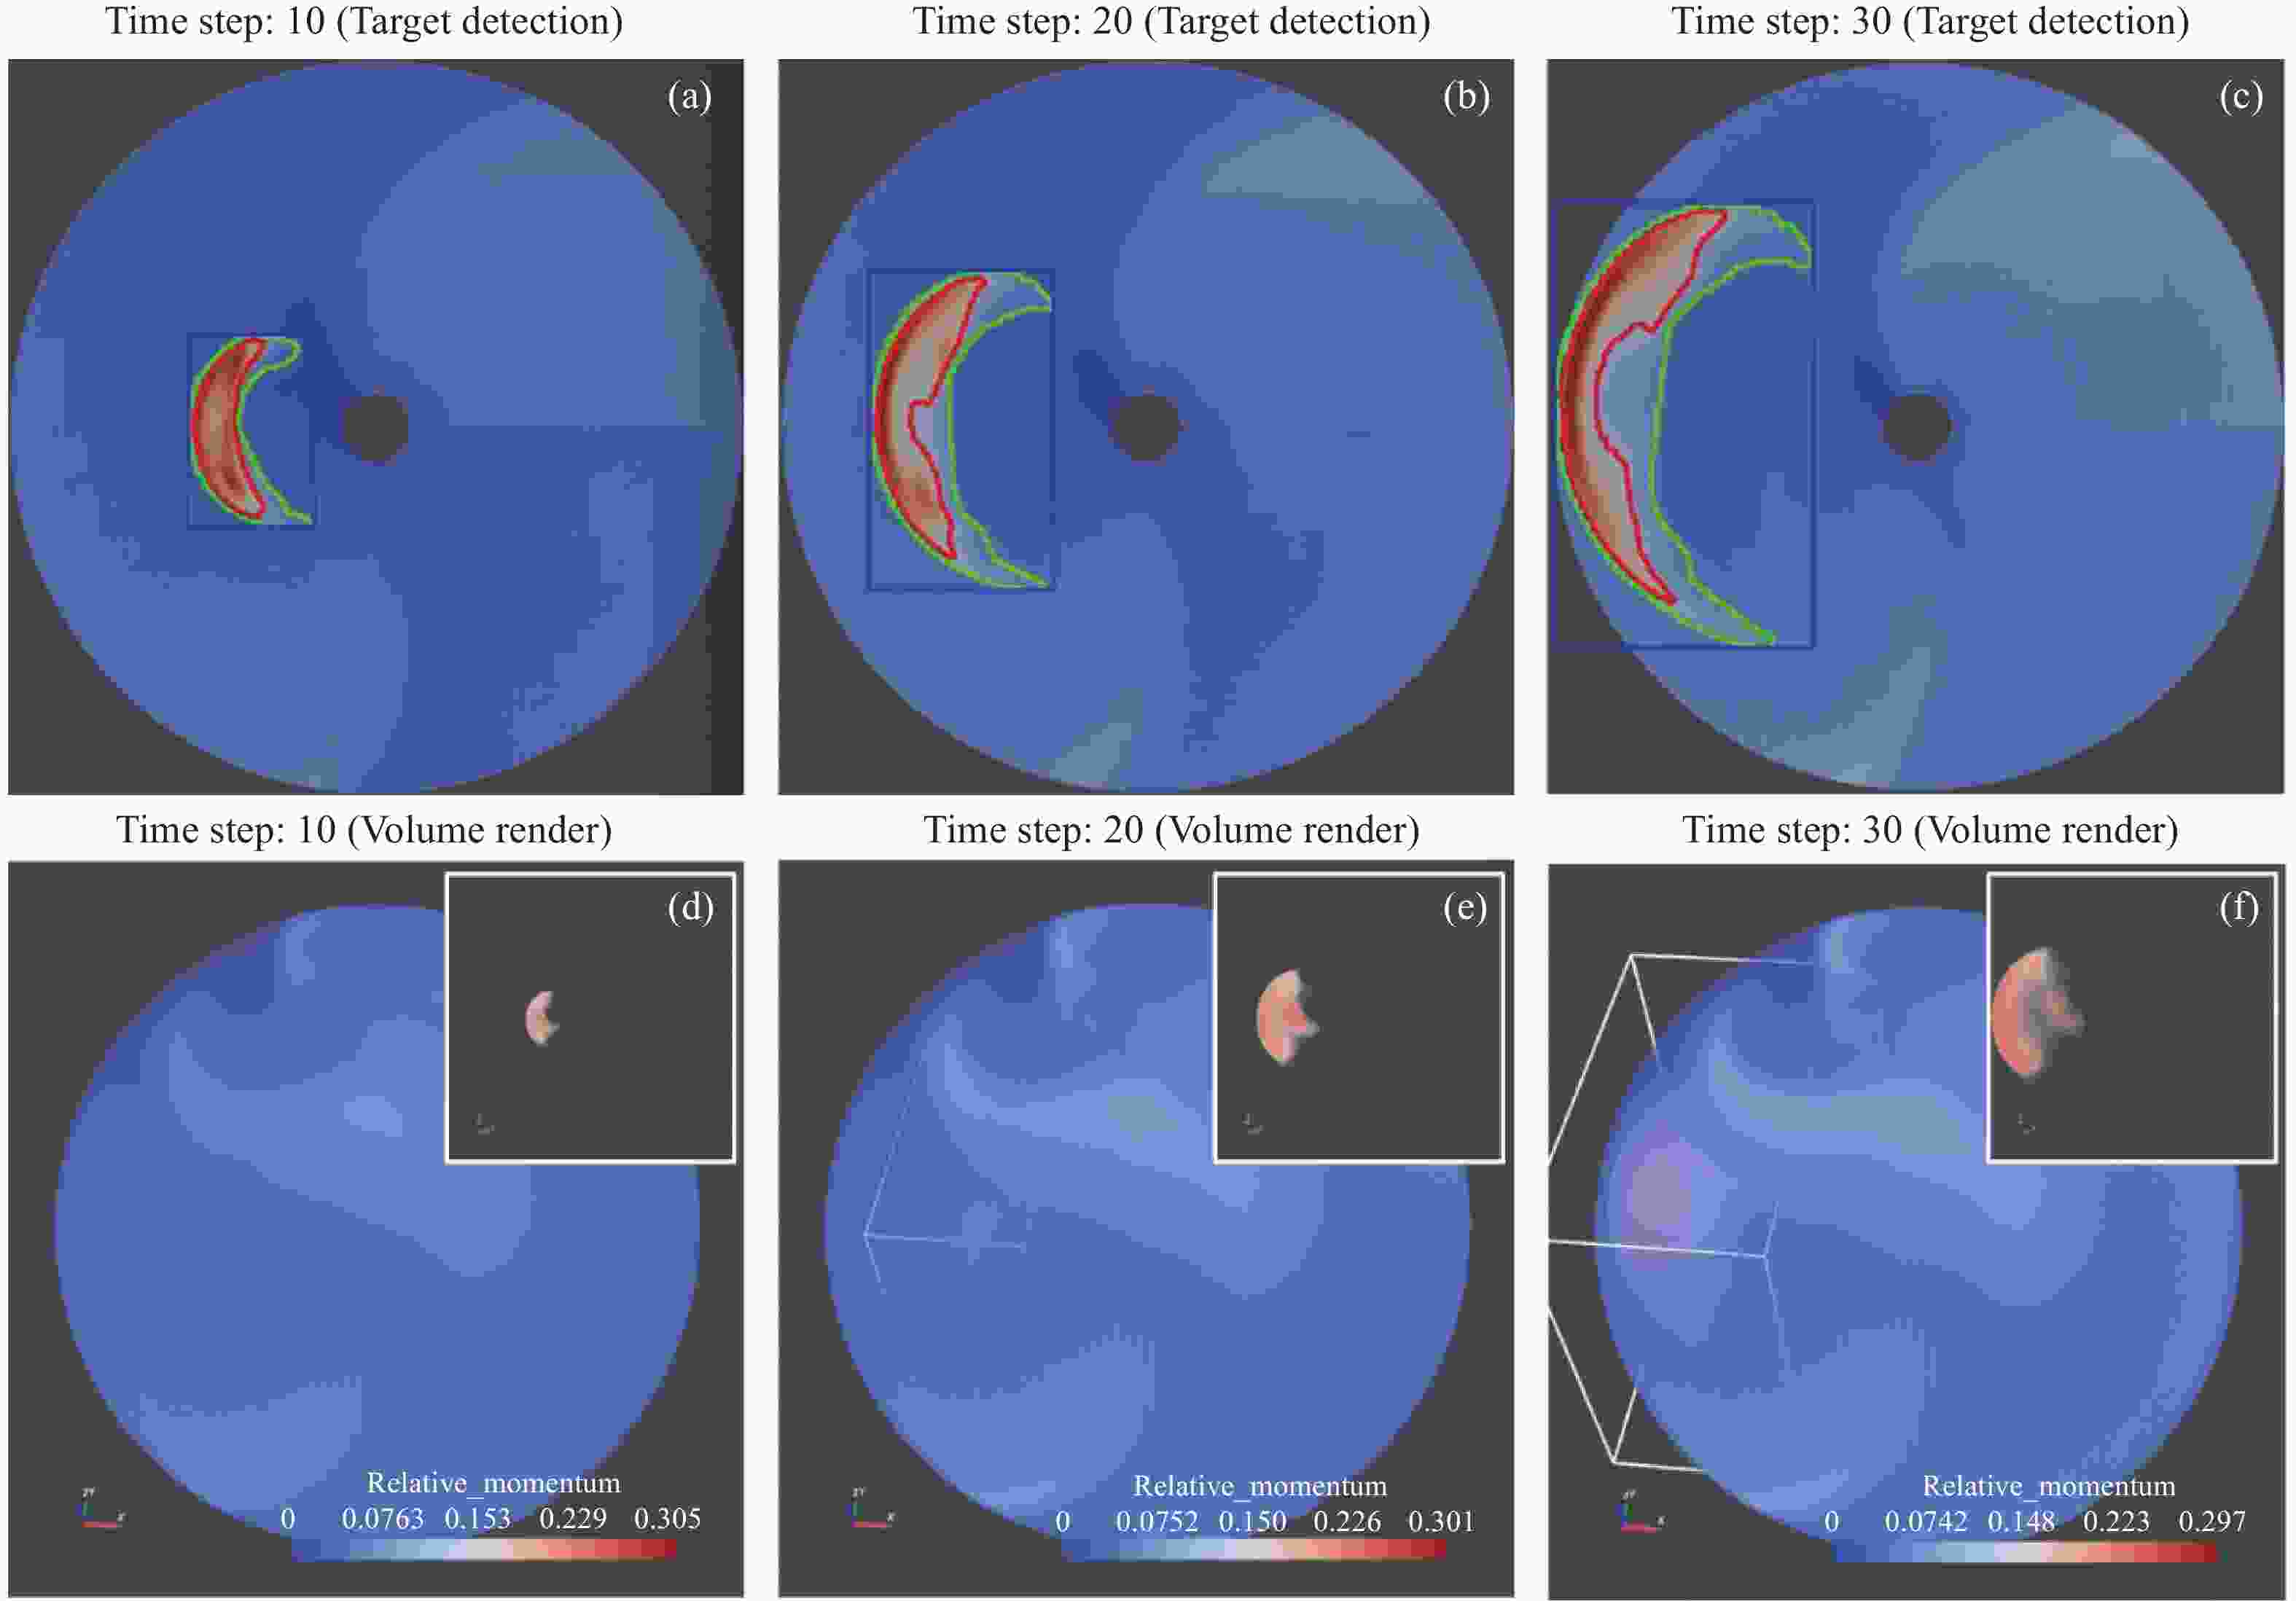
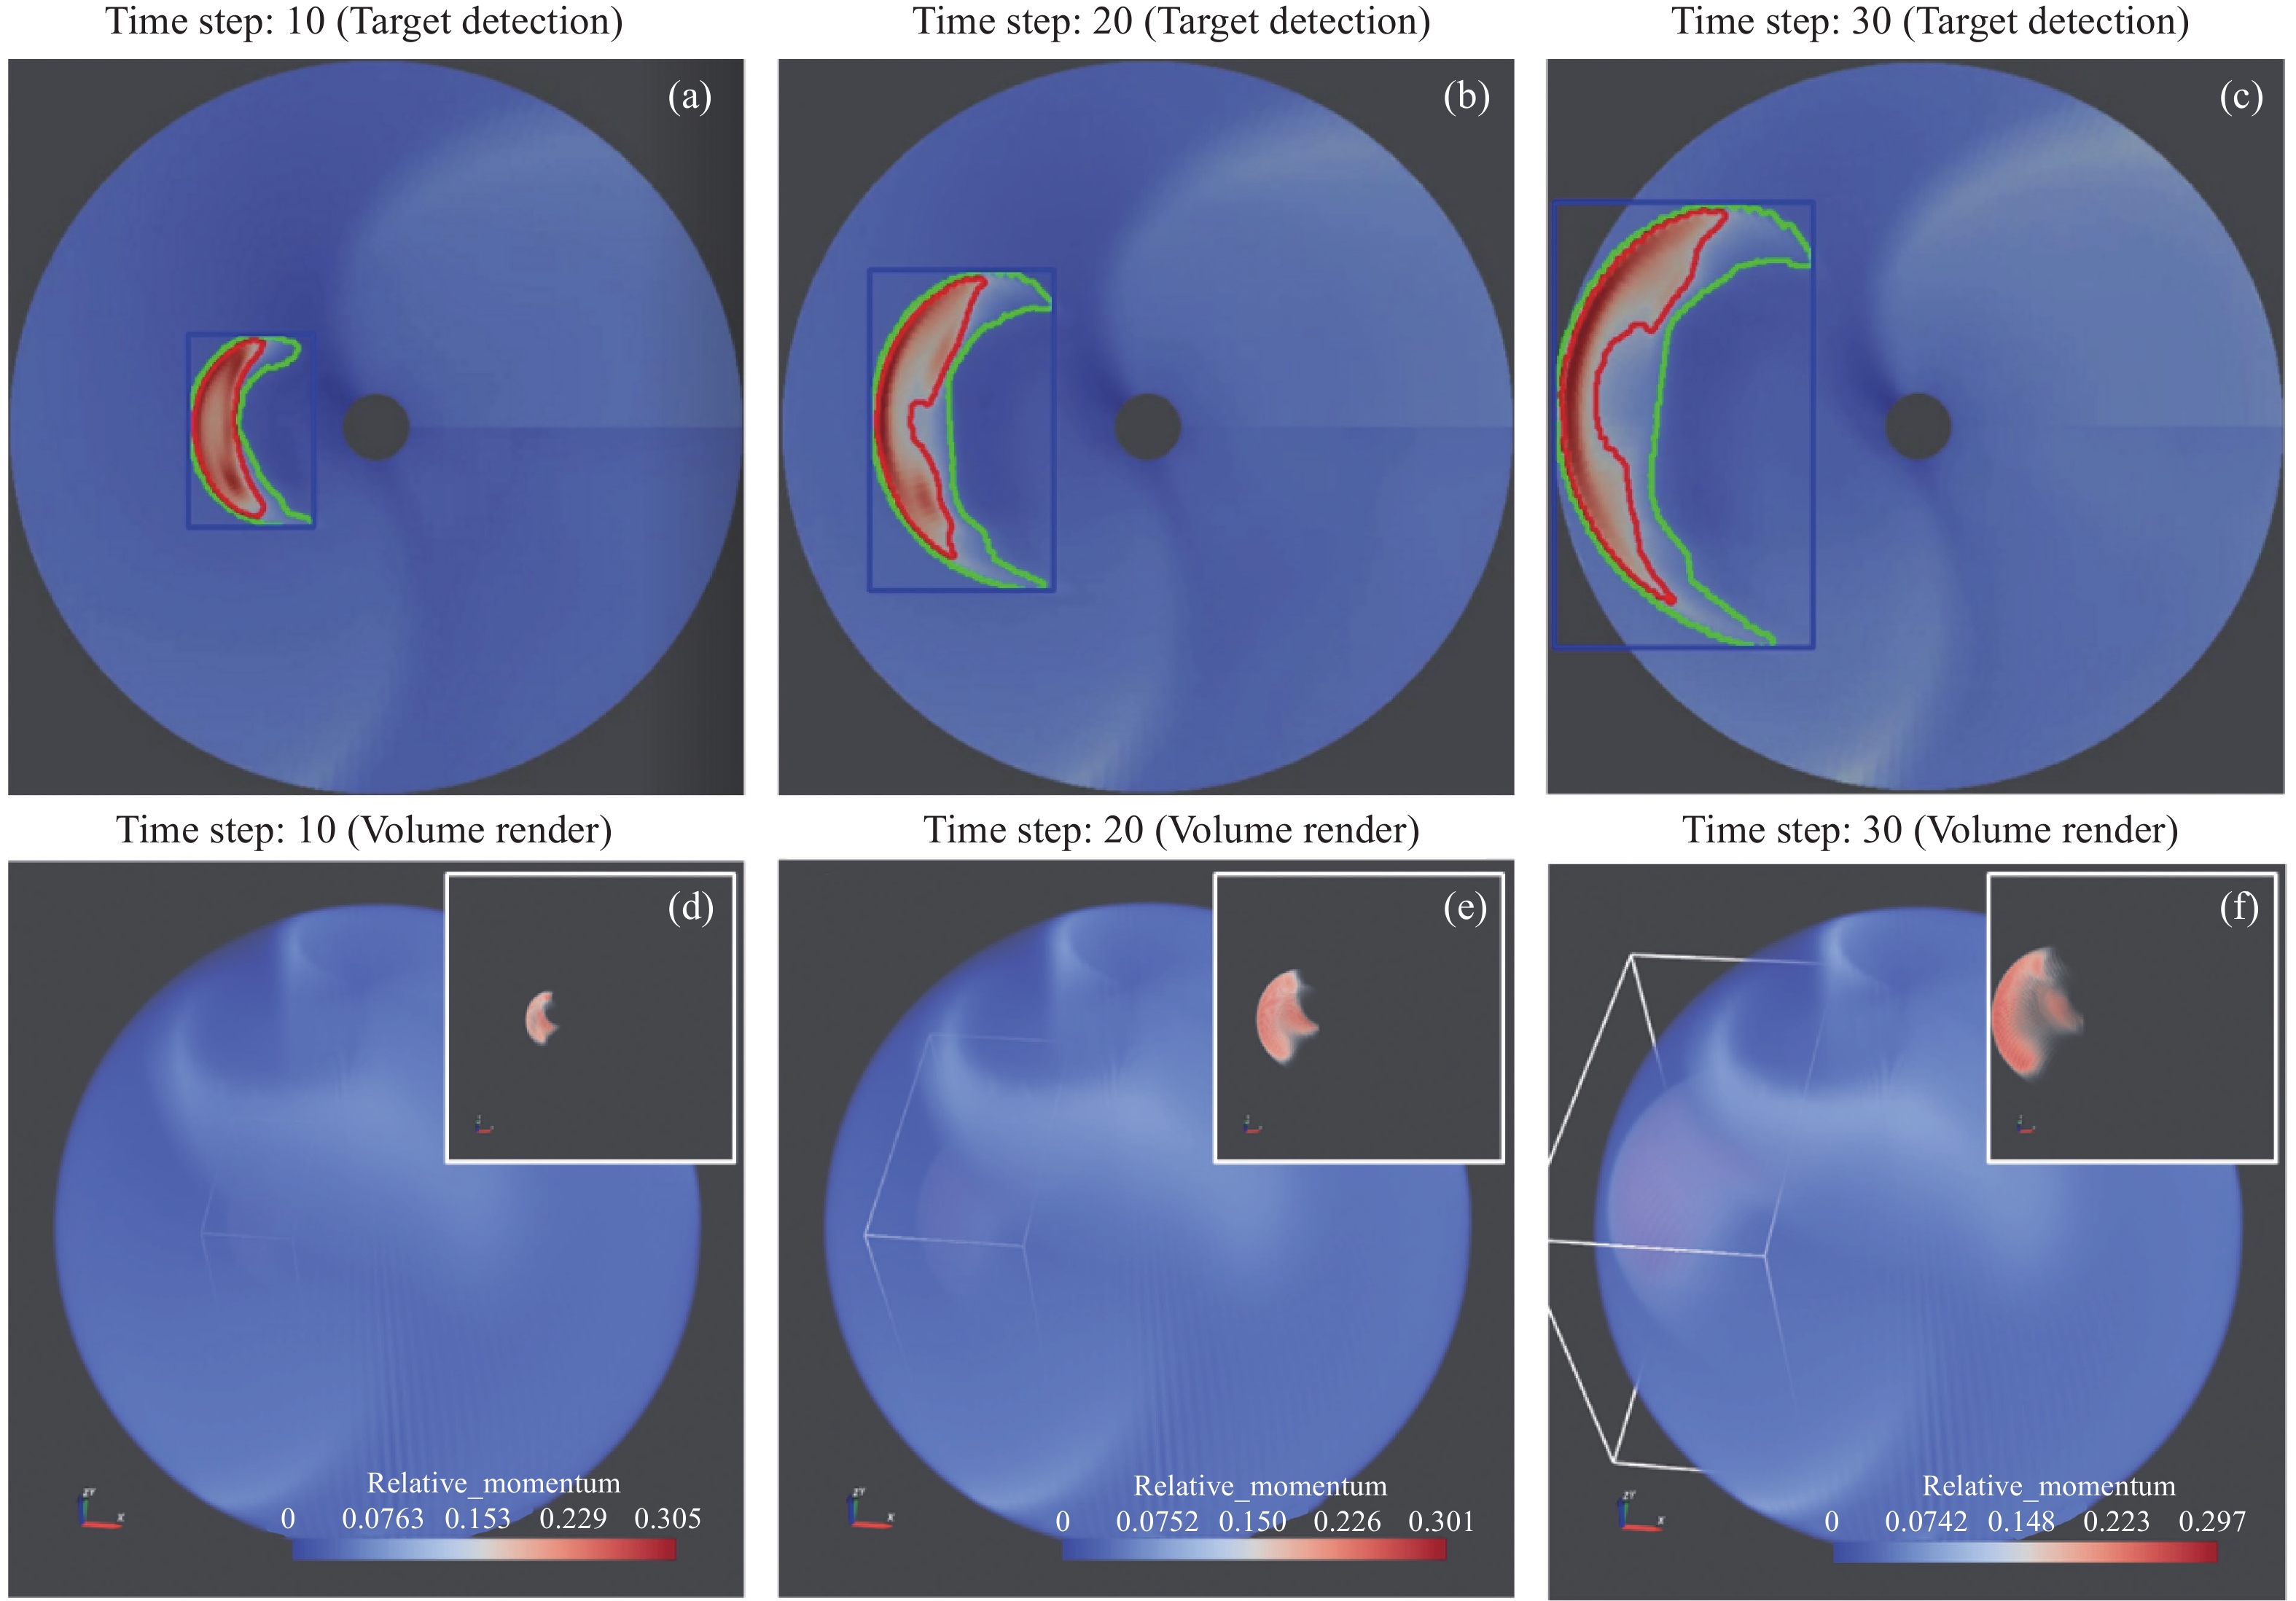
图 5 事件B:第10,20,30 三个时间步体数据相对动量的赤道面检测结果及体绘制结果。(a)~(c)中红绿蓝轮廓分别表示本文CME最终检测结果、KNN背景差分法检测结果、运动区域外接矩形,(d)~(f)大图为线性映射的体绘制效果、内部白色边框为提取的运动子集、右上小图为本文TFTV体绘制效果
Figure 5. Event B: the equatorial plane detection results and volume rendering results of the relative momentum volume data at 10th, 20th, and 30th time steps. In (a)~(c), the red, green and blue outlines respectively represent the final detection result of CME, the detection result of KNN background subtraction method, outer boundary of the moving area. In (d)~(f), the large is the volume rendering result of linear mapping, the inner white border is the extracted motion subset, the upper right is the TFTV volume rendering result in this article
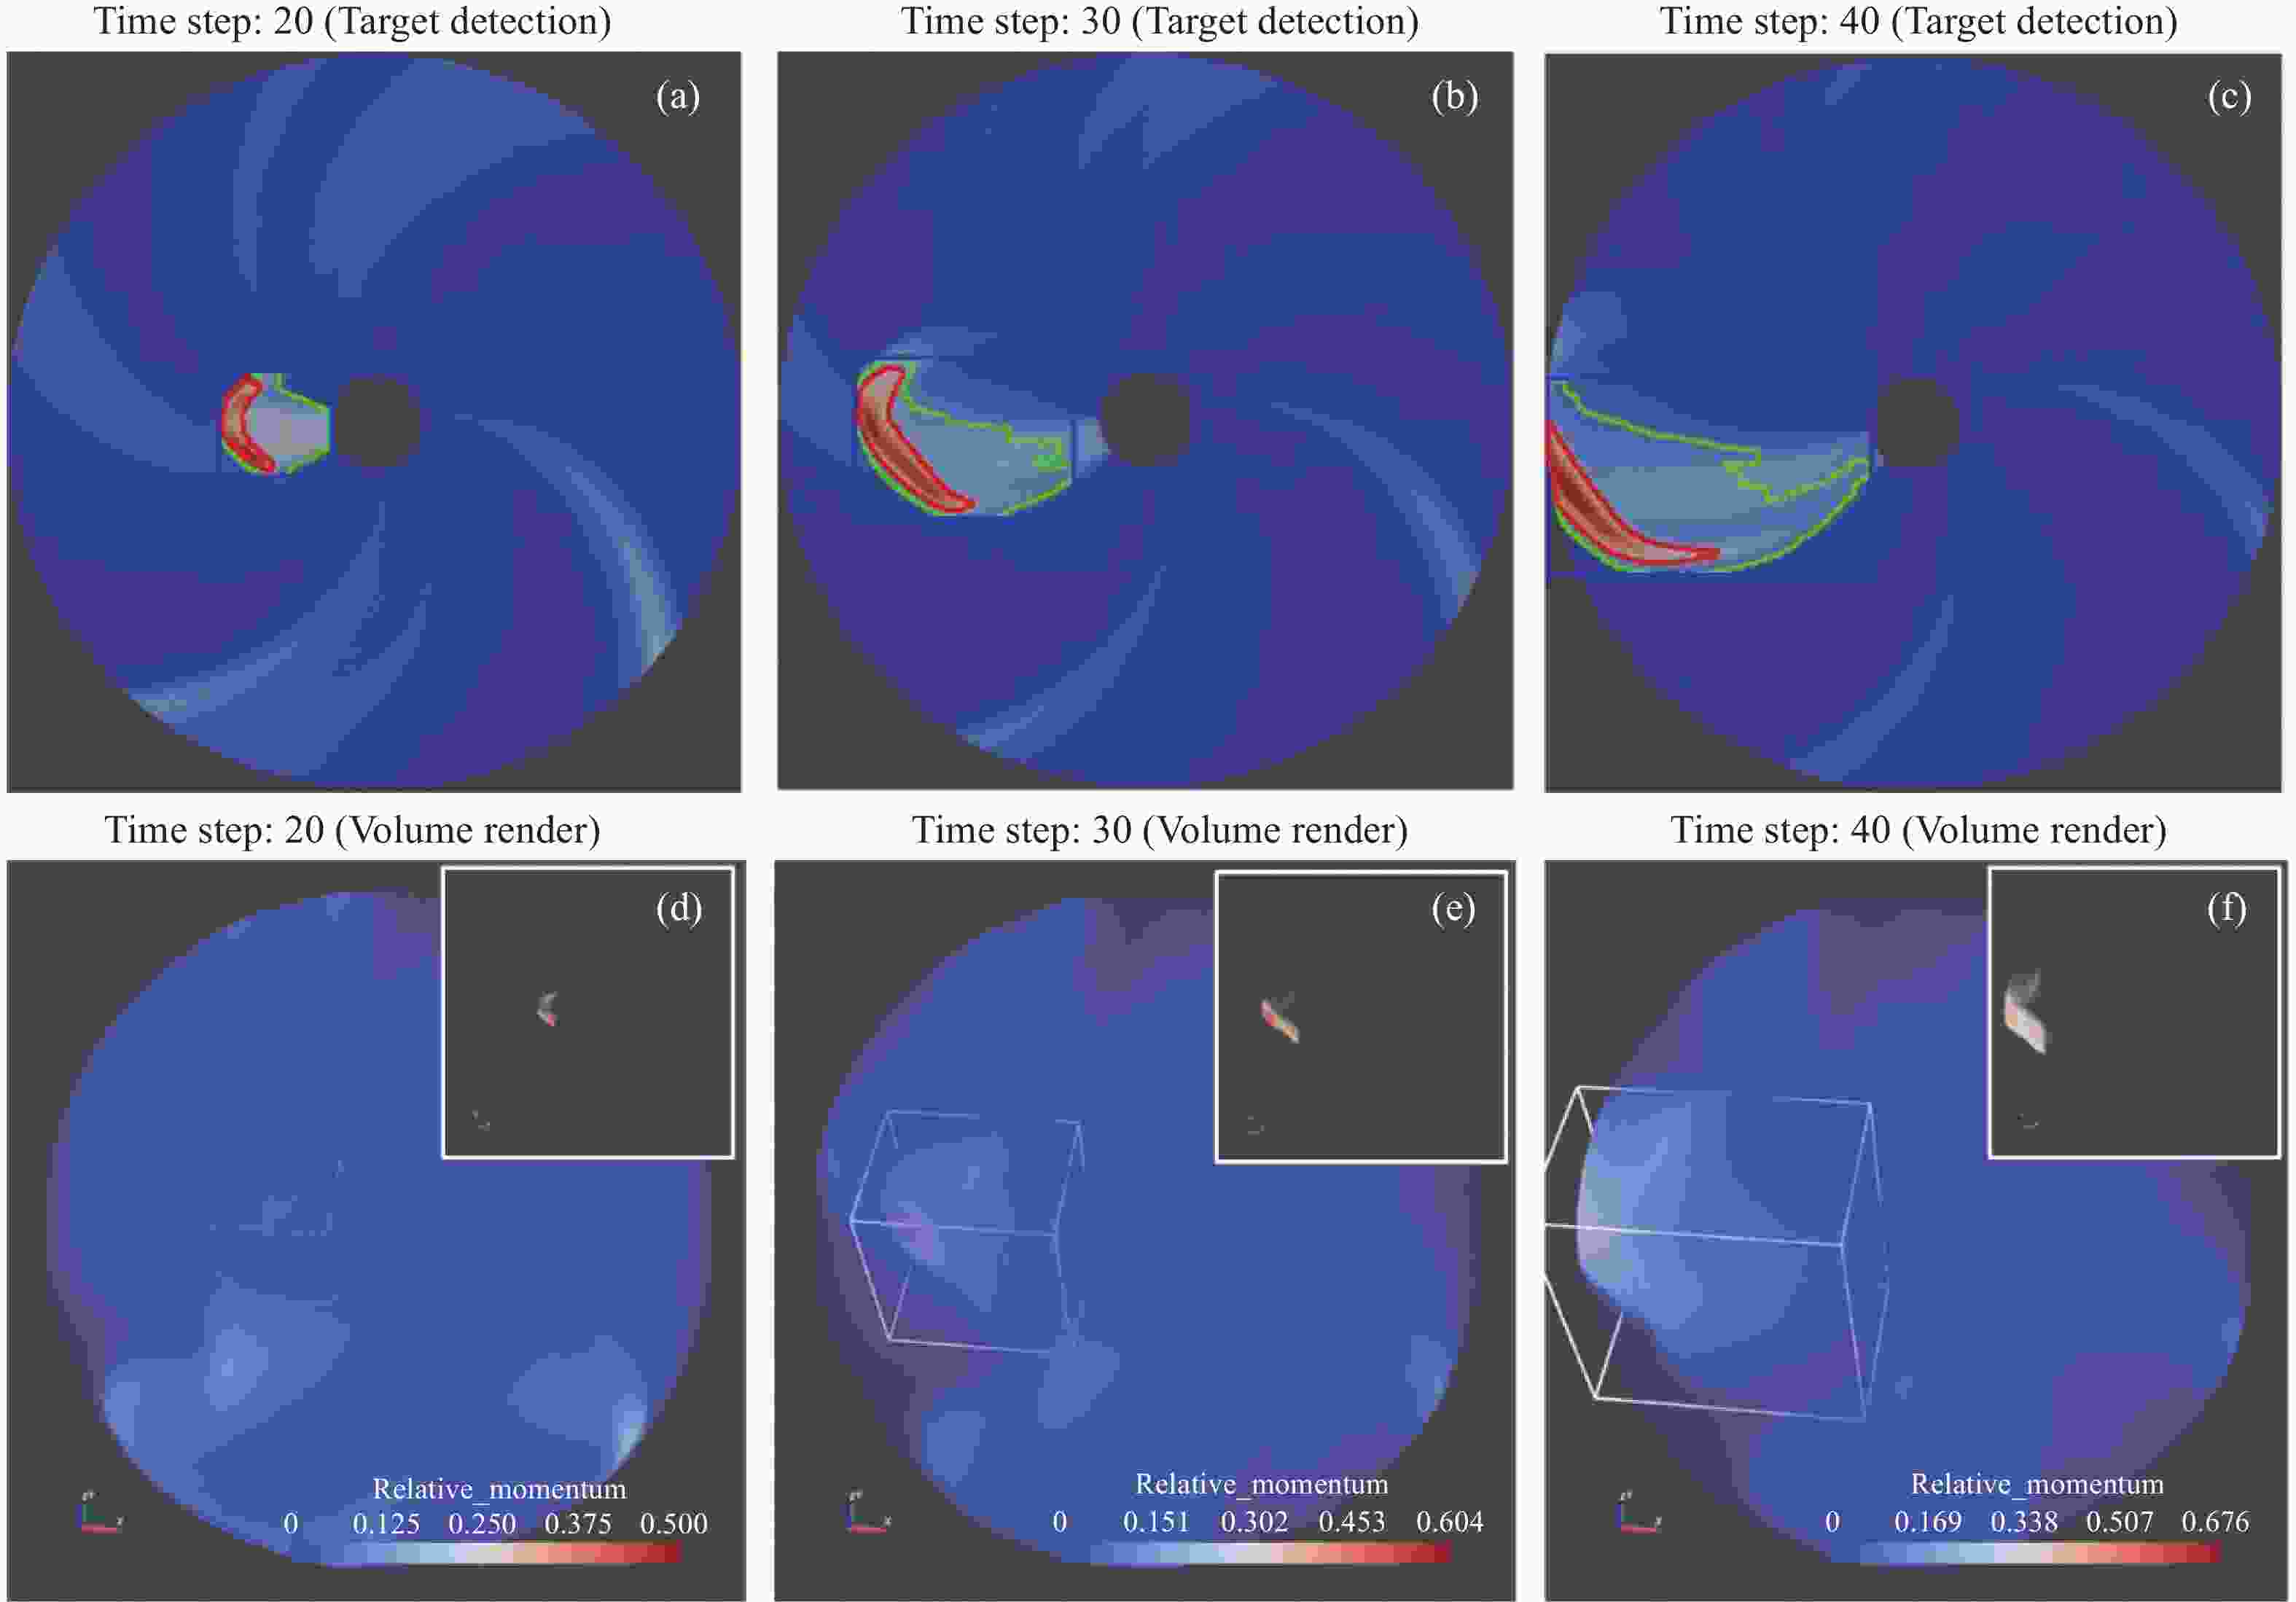
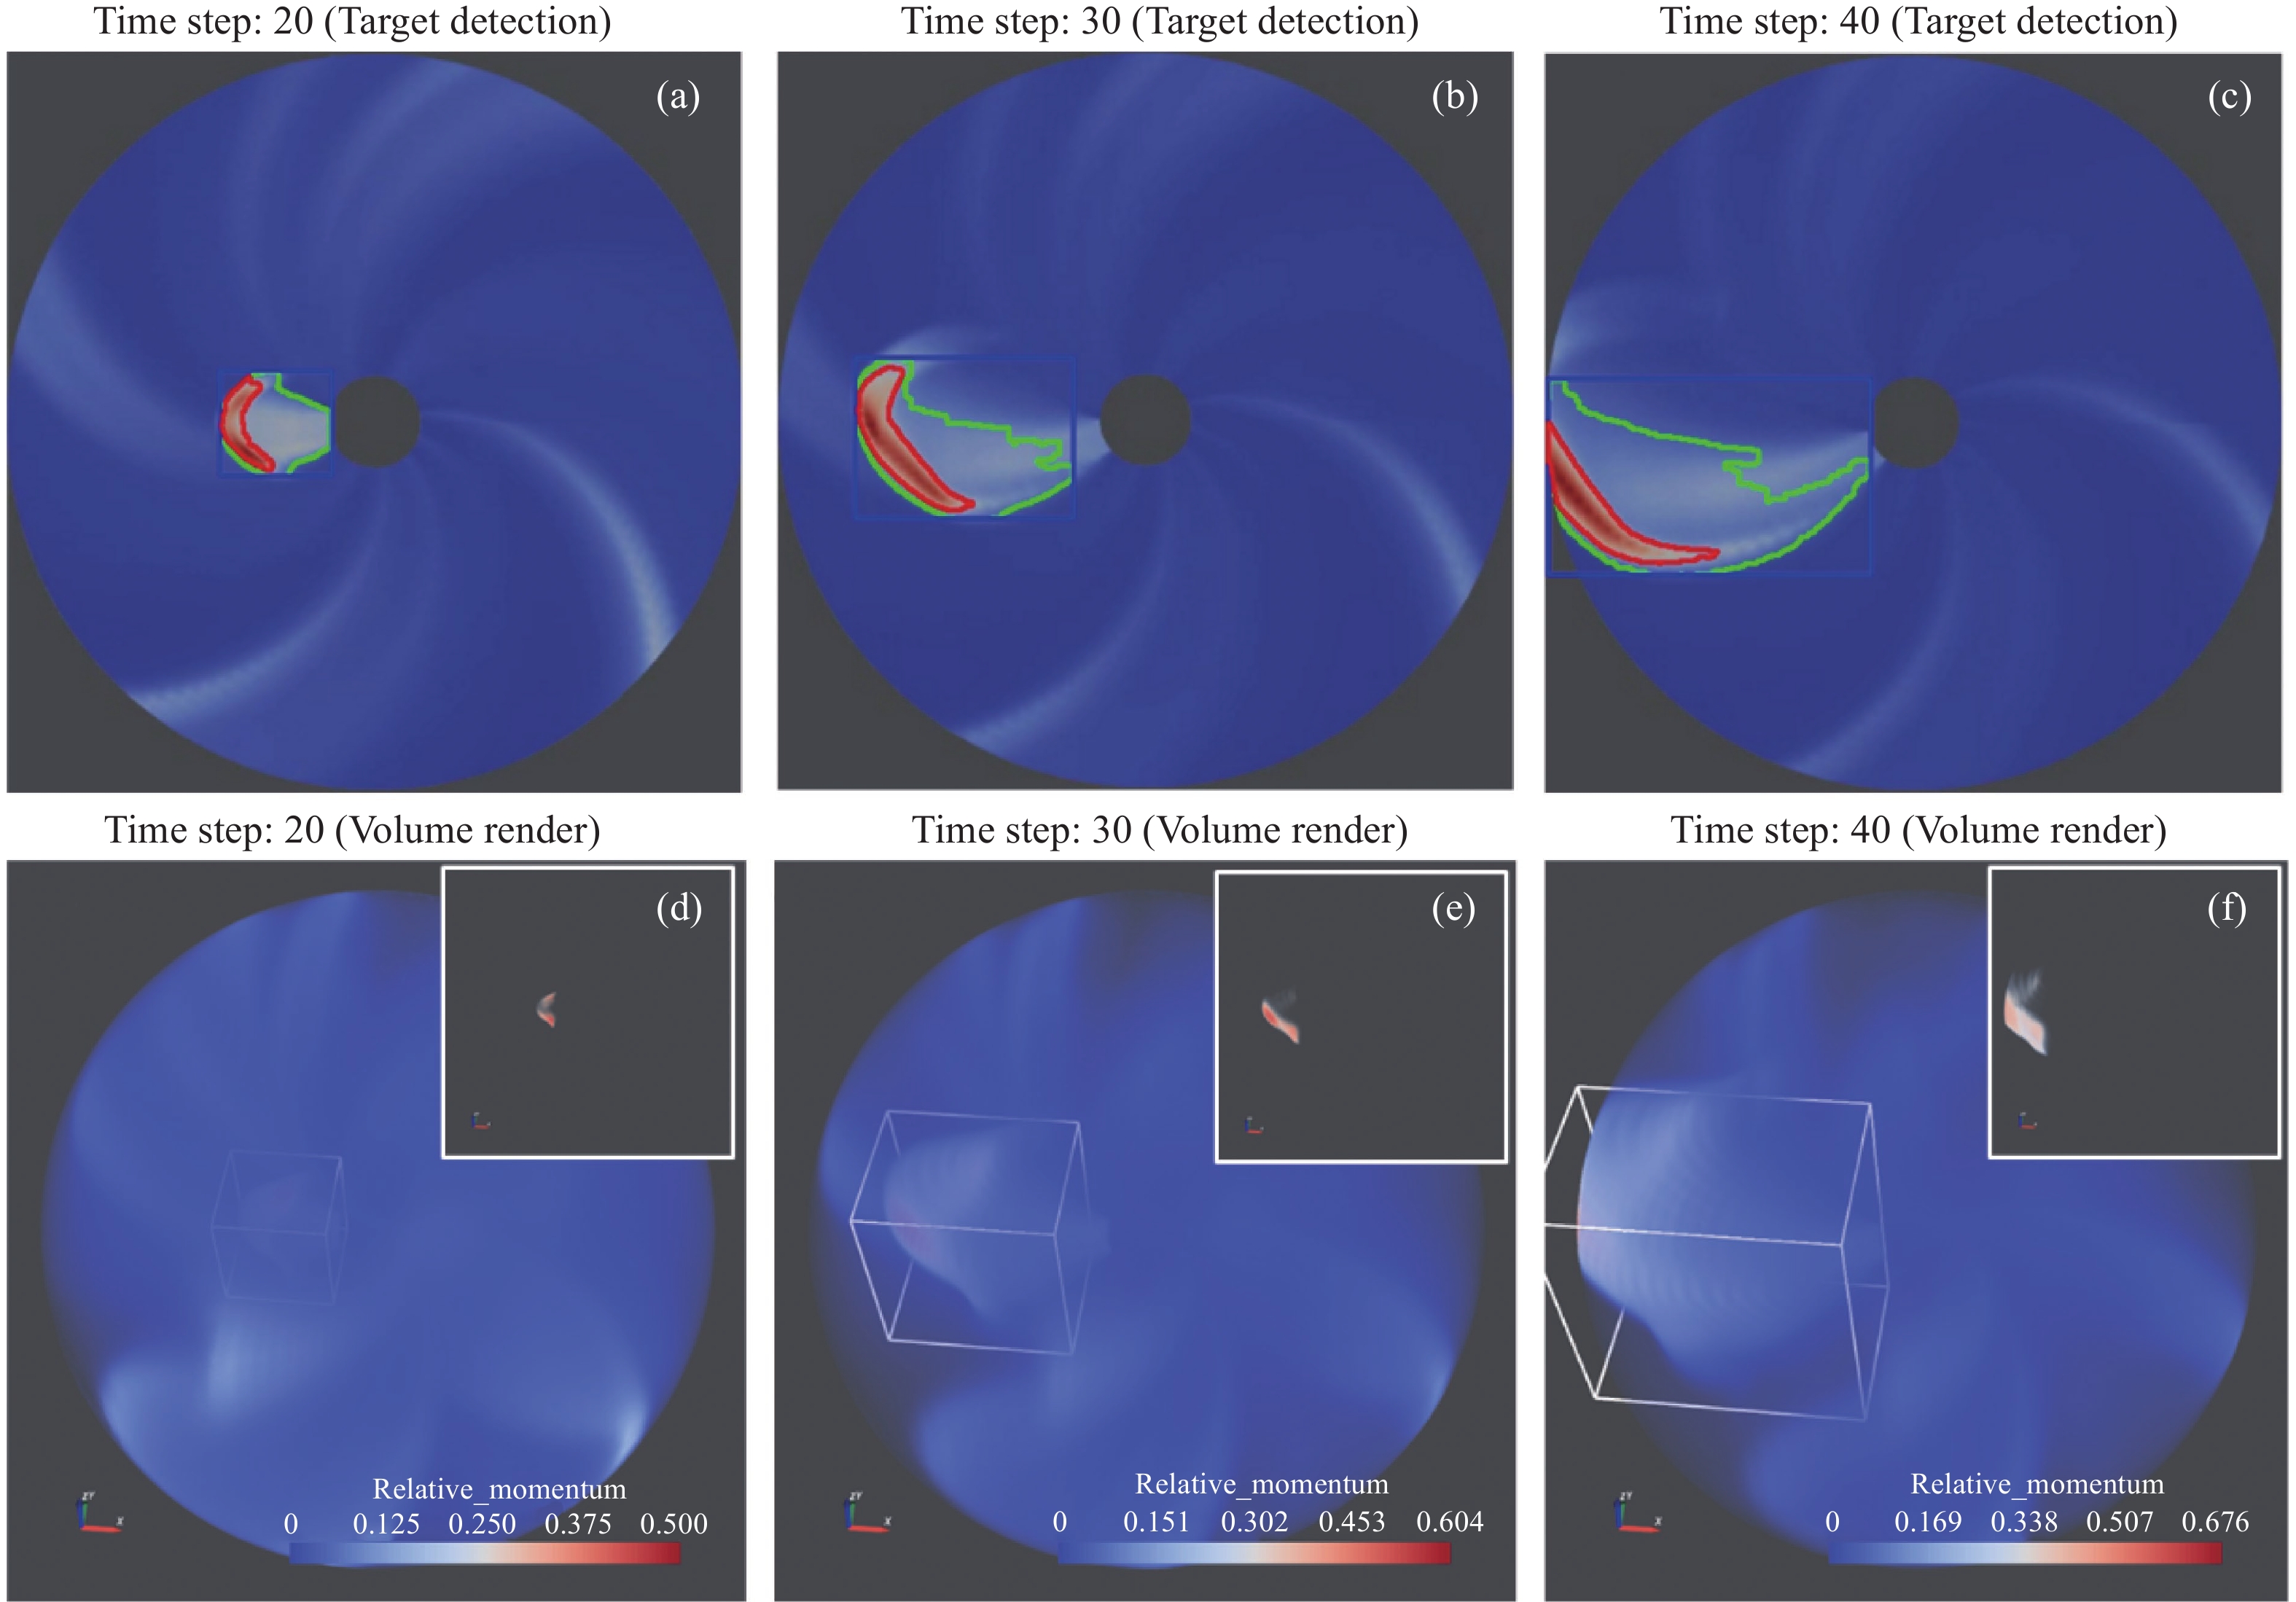
图 6 事件C:第20,30,40 三个时间步体数据相对动量的赤道面检测结果及体绘制结果。(a)~(c)中红绿蓝轮廓分别表示本文CME最终检测结果、KNN背景差分法检测结果、运动区域外接矩形,(d)~(f)大图为线性映射的体绘制效果、内部白色边框为提取的运动子集、右上小图为本文TFTV体绘制效果
Figure 6. Event C: the equatorial plane detection results and volume rendering results of the relative momentum volume data at 20th, 30th, and 40th time steps. In (a)~(c), the red, green and blue outlines respectively represent the final detection result of CME, the detection result of KNN background subtraction method, outer boundary of the moving area. In (d)~(f), the large is the volume rendering result of linear mapping, the inner white border is the extracted motion subset, the upper right is the TFTV volume rendering result in this article
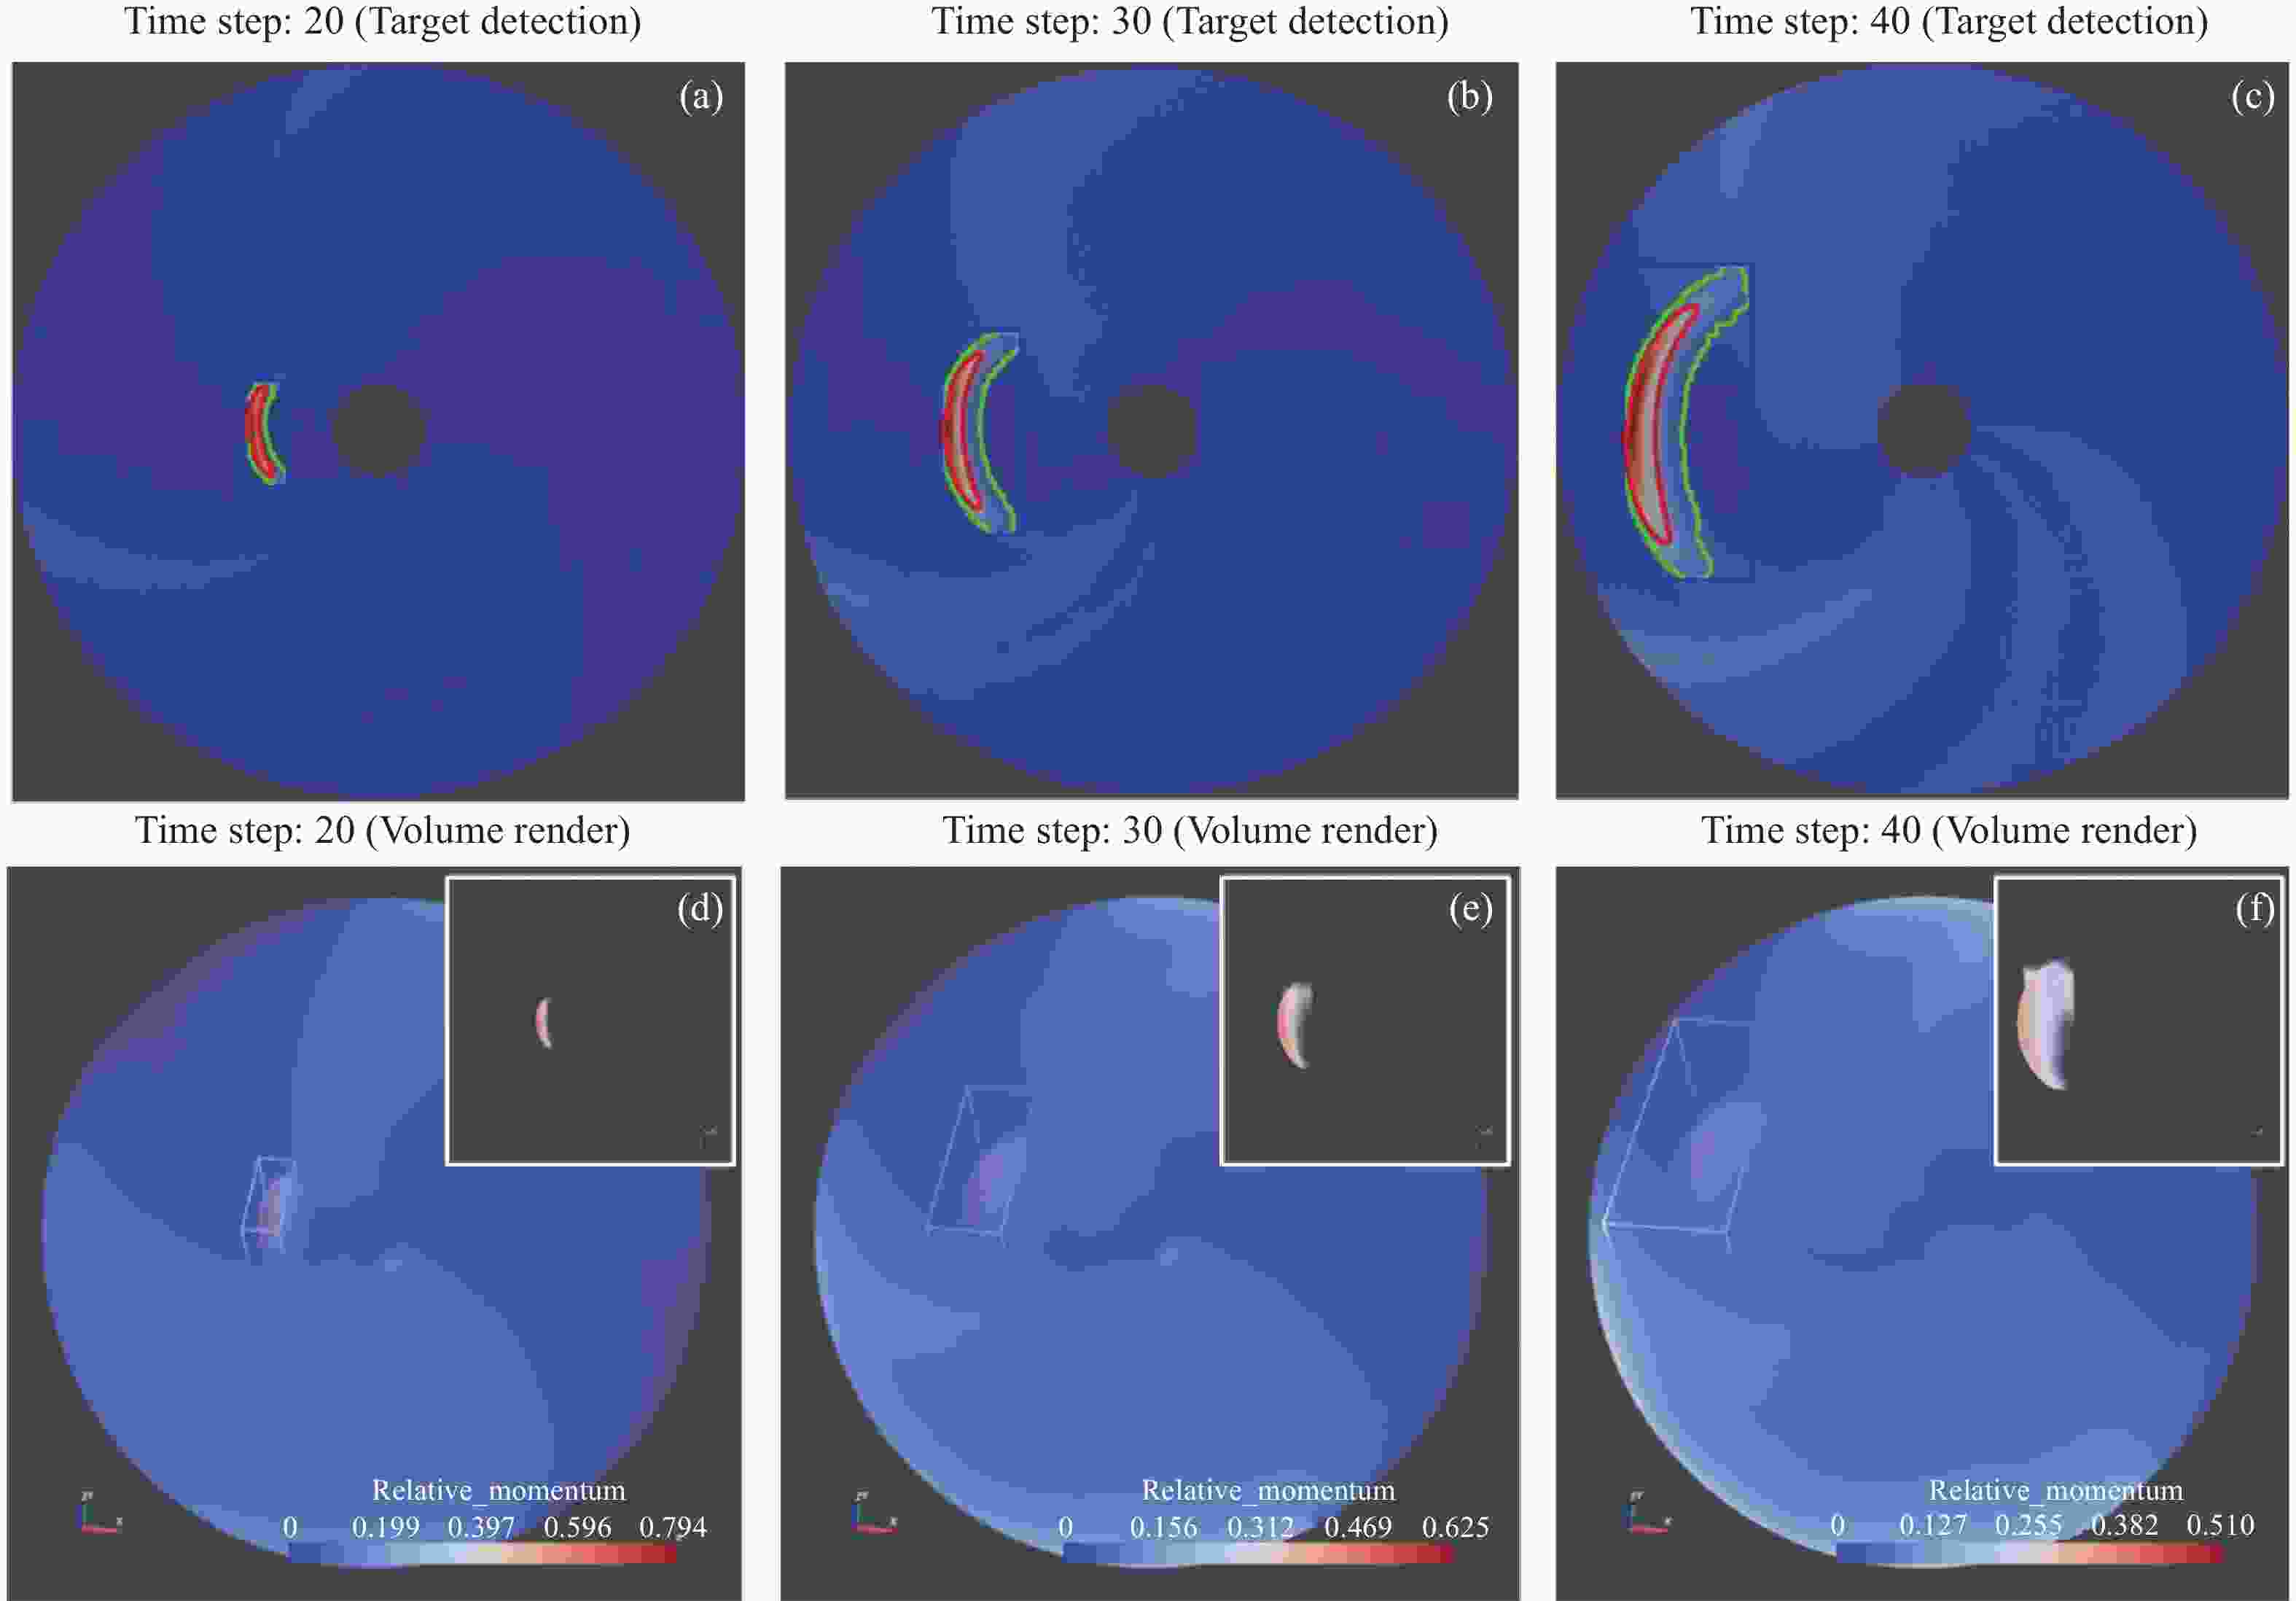
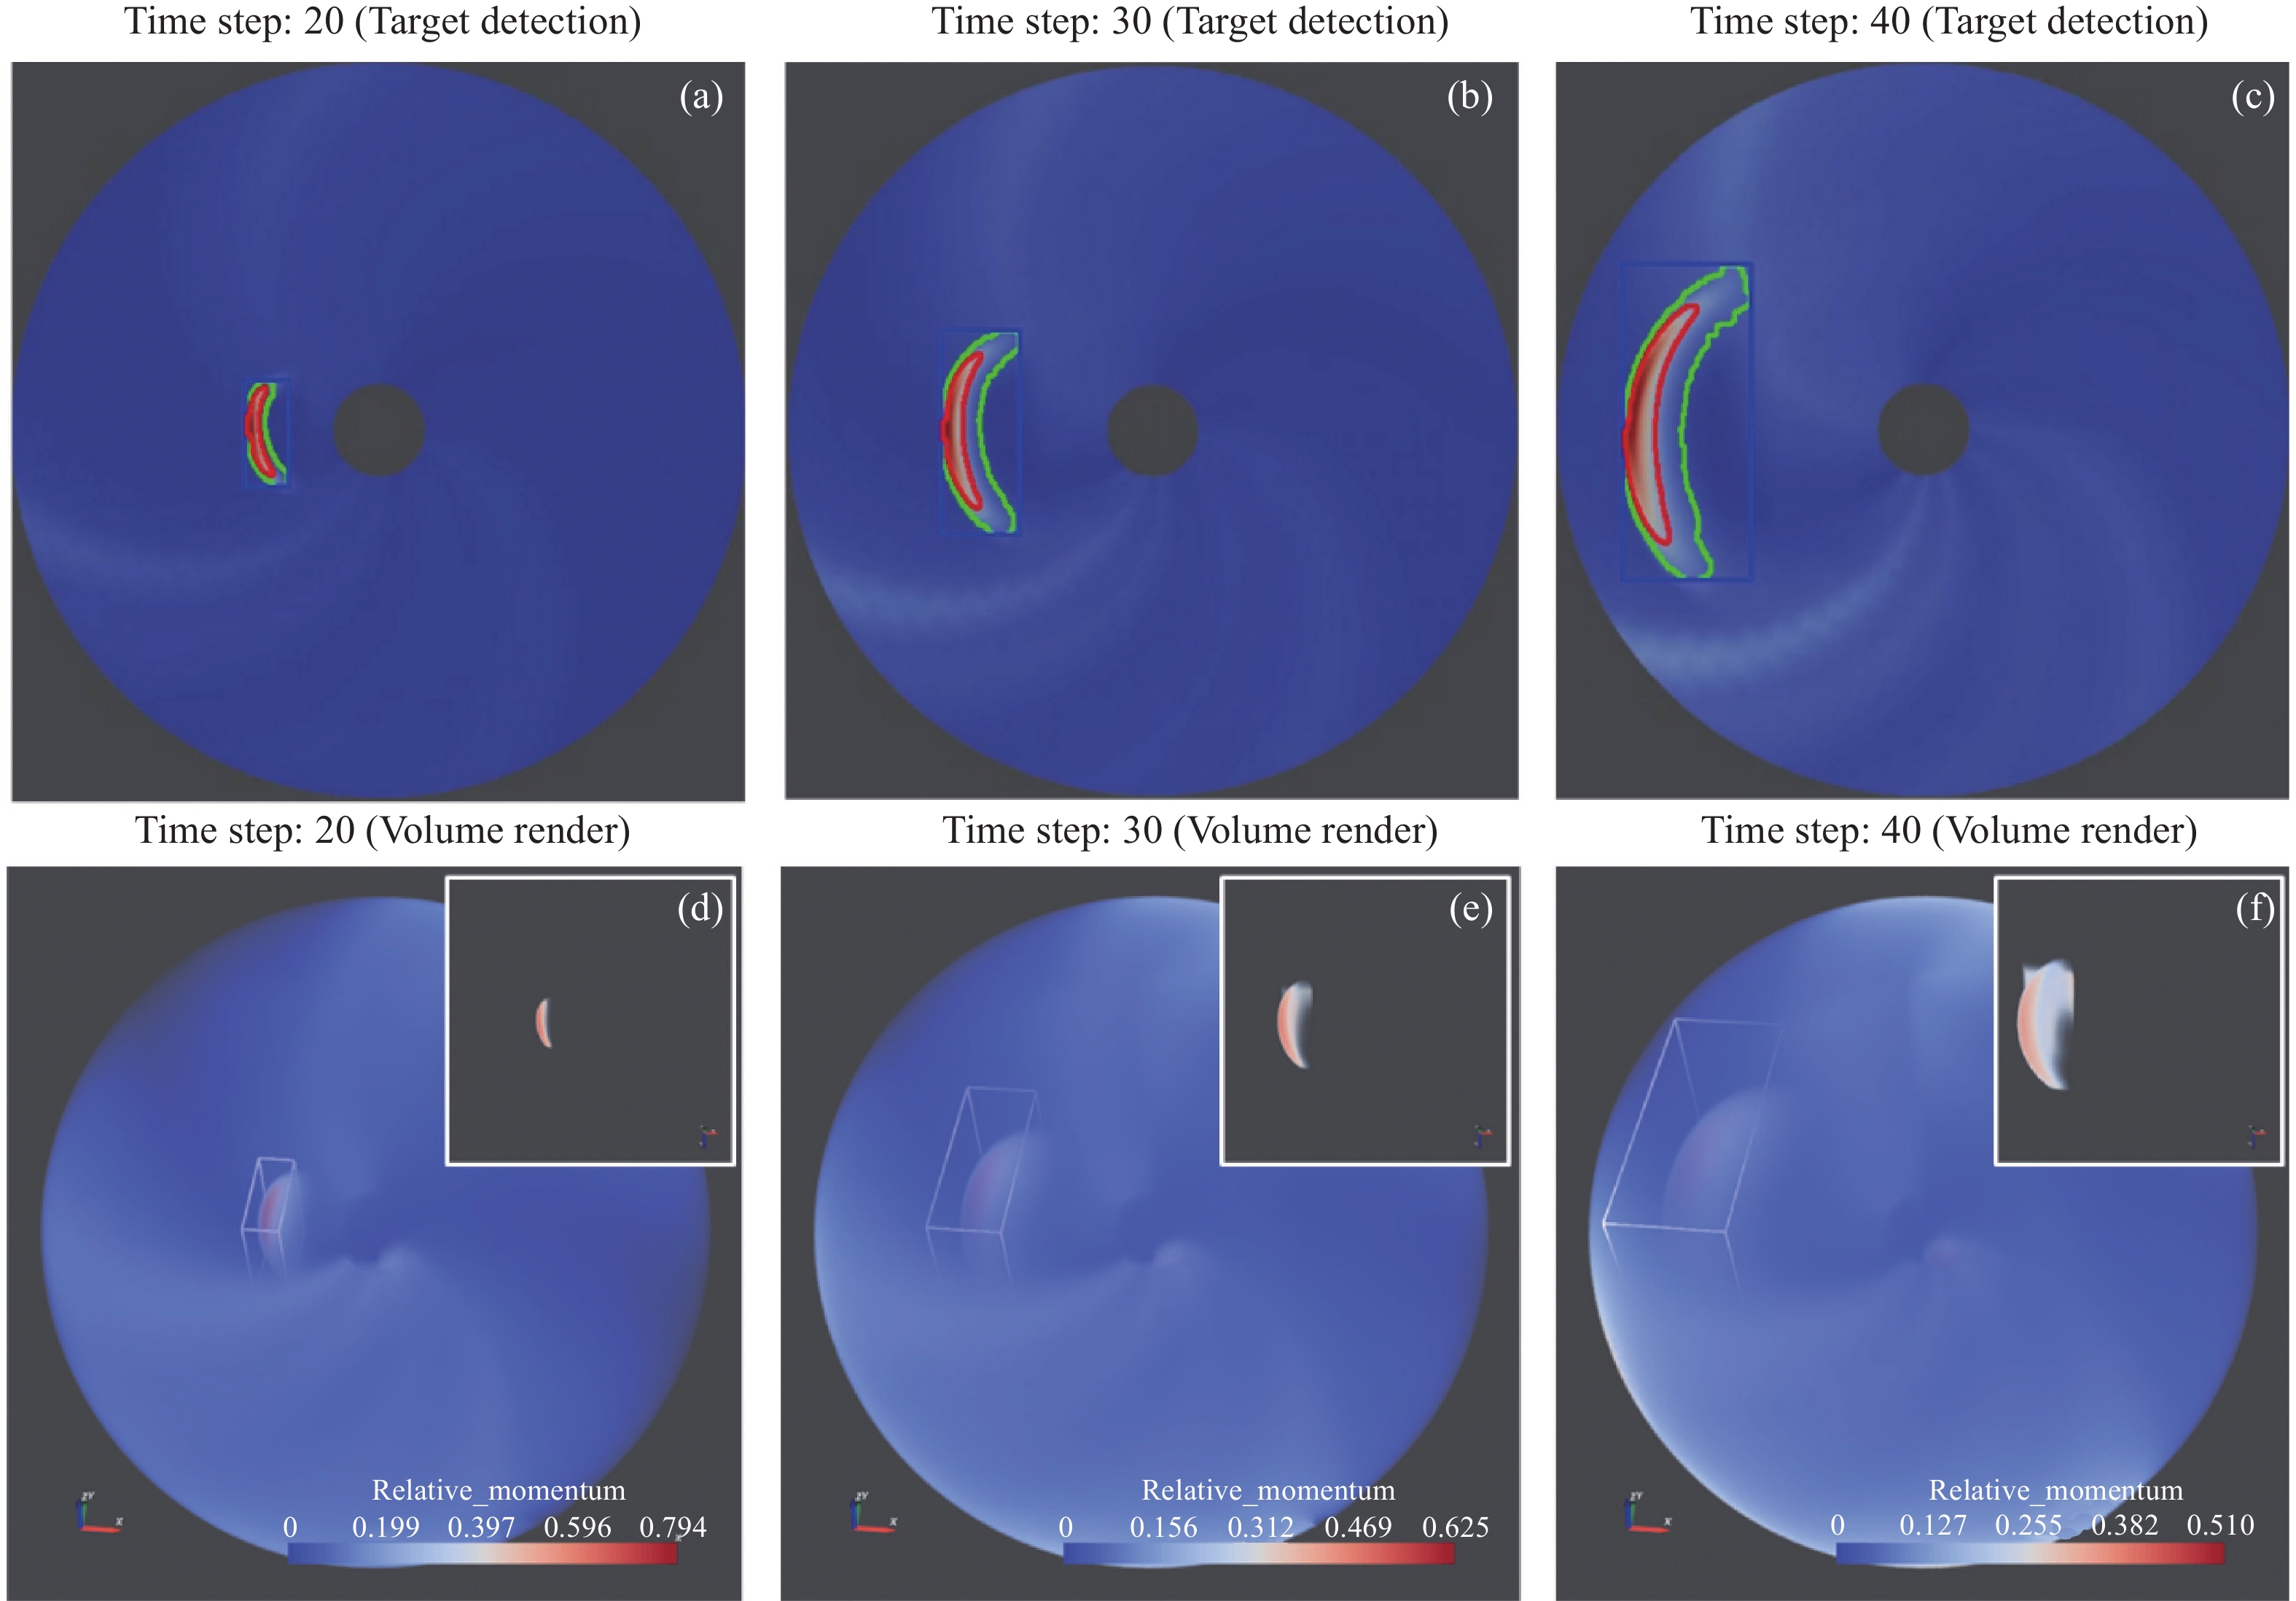
图 7 事件D:第20,30,40 三个时间步体数据相对动量的赤道面检测结果及体绘制结果。(a)~(c)中红绿蓝轮廓分别表示本文CME最终检测结果、KNN背景差分法检测结果、运动区域外接矩形,(d)~(f)大图为线性映射的体绘制效果、内部白色边框为提取的运动子集、右上小图为本文TFTV体绘制效果
Figure 7. Event D: the equatorial plane detection results and volume rendering results of the relative momentum volume data at 20th, 30th, and 40th time steps. In (a)~(c), the red, green and blue outlines respectively represent the final detection result of CME, the detection result of KNN background subtraction method, outer boundary of the moving area. In (d)~(f), the large is the volume rendering result of linear mapping, the inner white border is the extracted motion subset, the upper right is the TFTV volume rendering result in this article
表 1 数值网格与模拟区域
Table 1. Numerical grid and simulation region
数值模型 事件 网格大小 半径范围/$R_{\text{s}}$ 卡林顿周 SIP-CESE A $ 300(x) \times 300(y) \times 300(z) $ $1\sim225$ CR2194 B $ 192(r) \times 181(\theta) \times 361(\phi) $ $21.5\sim235$ CR2154 CORHEL C $ 320(r) \times 60(\theta) \times 180(\phi) $ $30\sim245$ CR2185 D $ 160(r) \times 30(\theta) \times 90(\phi) $ $30\sim245$ CR2154  下载: 导出CSV
-
[1] MIKIĆ Z, DOWNS C, LINKER J A, et al. Predicting the corona for the 21 August 2017 total solar eclipse[J]. Nature Astronomy, 2018, 2(11): 913-921 doi: 10.1038/s41550-018-0562-5 [2] BOCK A, PEMBROKE A, MAYS M L, et al. Visual verification of space weather ensemble simulations[C]//2015 IEEE Scientific Visualization Conference (SciVis). Chicago, IL, USA: IEEE, 2015: 17-24 [3] CARLBAUM O, NOVÉN M. Real-time magnetohydrodynamic space weather visualization[D]. Linköping: Linköping University, 2017 [4] ODSTRCIL D. Modeling 3 D solar wind structure[J]. Advances in Space Research, 2003, 32(4): 497-506 doi: 10.1016/S0273-1177(03)00332-6 [5] LJUNG P, KRÜGER J, GROLLER E, et al. State of the art in transfer functions for direct volume rendering[J]. Computer Graphics Forum, 2016, 35(3): 669-691 doi: 10.1111/cgf.12934 [6] ROETTGER S, BAUER M, STAMMINGER M. Spatialized transfer functions[C]//Proceedings of the Seventh Joint Eurographics/IEEE VGTC Conference on Visualization. Leeds: Eurographics Association, 2005: 271-278 [7] ŠEREDA P, VILANOVA A, GERRITSEN F A. Automating transfer function design for volume rendering using hierarchical clustering of material boundaries[C]//Proceedings of the Eighth Joint Eurographics/IEEE VGTC Conference on Visualization. Lisbon: Eurographics Association, 2006: 243-250 [8] LAN Y S, DING Y M, LUO X, et al. A clustering based transfer function for volume rendering using gray-gradient mode histogram[J]. IEEE Access, 2019, 7: 80737-80747 doi: 10.1109/ACCESS.2019.2923080 [9] MACIEJEWSKI R, WOO I, CHEN W, et al. Structuring feature space: A non-parametric method for volumetric transfer function generation[J]. IEEE Transactions on Visualization and Computer Graphics, 2009, 15(6): 1473-1480 doi: 10.1109/TVCG.2009.185 [10] WANG Y H, CHEN W, SHAN G H, et al. Volume exploration using ellipsoidal gaussian transfer functions[C]//2010 IEEE Pacific Visualization Symposium (PacificVis). Taipei, China: IEEE, 2010: 25-32 [11] WANG Y H, CHEN W, ZHANG J, et al. Efficient volume exploration using the gaussian mixture model[J]. IEEE Transactions on Visualization and Computer Graphics, 2011, 17(11): 1560-1573 doi: 10.1109/TVCG.2011.97 [12] WANG Y H, ZHANG J, LEHMANN D J, et al. Automating transfer function design with valley cell-based clustering of 2 D density plots[J]. Computer Graphics Forum, 2012, 31(3pt4): 1295-1304 doi: 10.1111/j.1467-8659.2012.03122.x [13] ROPINSKI T, PRAßNI J, STEINICKE F, et al. Stroke-based transfer function design[C]//Proceedings of the Fifth Eurographics / IEEE VGTC Conference on Point-Based Graphics. Los Angeles, California, USA: Eurographics Association, 2008: 41-48 [14] MA K L, WANG C L, YU H F, et al. In-situ processing and visualization for ultrascale simulations[J]. Journal of Physics: Conference Series, 2007, 78: 012043 doi: 10.1088/1742-6596/78/1/012043 [15] WANG K C, LU K W, WEI T H, et al. Statistical visualization and analysis of large data using a value-based spatial distribution[C]//2017 IEEE Pacific Visualization Symposium (PacificVis). Seoul, Korea: IEEE, 2017: 161-170 [16] JUNG Y, KIM J, KUMAR A, et al. Feature of interest-based direct volume rendering using contextual saliency-driven ray profile analysis[J]. Computer Graphics Forum, 2018, 37(6): 5-19 doi: 10.1111/cgf.13308 [17] WANG K C, SHAREEF N, SHEN H W. Image and distribution based volume rendering for large data sets[C]//2018 IEEE Pacific Visualization Symposium (PacificVis). Kobe, Japan: IEEE, 2018: 26-35 [18] LIU Y S, SHEN F, YANG Y. Numerical Simulation on the propagation and deflection of fast coronal mass ejections (CMEs) Interacting with a corotating interaction region in interplanetary space[J]. The Astrophysical Journal, 2019, 887(2): 150 doi: 10.3847/1538-4357/ab543e [19] ZIVKOVIC Z, VAN DER HEIJDEN F. Efficient adaptive density estimation per image pixel for the task of background subtraction[J]. Pattern Recognition Letters, 2006, 27(7): 773-780 doi: 10.1016/j.patrec.2005.11.005 [20] ACHANTA R, HEMAMI S, ESTRADA F, et al. Frequency-tuned salient region detection[C]//2009 IEEE Conference on Computer Vision and Pattern Recognition. Miami, FL, USA: IEEE, 2009: 1597-1604 [21] COVER T, HART P. Nearest neighbor pattern classification[J]. IEEE Transactions on Information Theory, 1967, 13(1): 21-27 doi: 10.1109/TIT.1967.1053964 [22] ELGAMMAL A, HARWOOD D, DAVIS L. Non-parametric model for background subtraction[C]//Proceedings of the 6th European Conference on Computer Vision. Dublin: Springer, 2000: 751-767 [23] Zou X, Hu Y, Tian Z, et al. Logistic regression model optimization and case analysis[C]//2019 IEEE 7th International Conference on Computer Science and Network Technology (ICCSNT). IEEE, 2019: 135-139 [24] FENG X. Magnetohydrodynamic Modeling of the Solar Corona and Heliosphere[M]. Singapore: Springer, 2020 [25] ZHOU Y F, FENG X S. Numerical study of the propagation characteristics of coronal mass ejections in a structured ambient solar wind[J]. Journal of Geophysical Research: Space Physics, 2017, 122(2): 1451-1462 doi: 10.1002/2016JA023053 -
-

 下载:
下载:


计量
- 文章访问数: 1067
- HTML全文浏览量: 473
- PDF下载量: 101
-
被引次数:
0(来源:Crossref)
0(来源:其他)

