基于GNSS TEC的电离层模型IRI-Plas 2020与IRI-2020的全球精度评估
doi: 10.11728/cjss2024.06.2023-0075 cstr: 32142.14.cjss.2023-0075
Global Accuracy Assessment and Analysis of the Ionospheric Model IRI-Plas 2020 and IRI-2020 Based on GNSS Observations
-
摘要: 在信号传播与接收的过程中对电离层延迟进行改正可以提升卫星导航定位的精度, 电离层经验模型, 如国际参考电离层(International Reference Ionosphere, IRI)模型和IRI-Plas (IRI Extended to Plasmasphere)模型在估计电离层参数时得到广泛应用. 基于太阳活动低年2021年全球135个GNSS站的双频观测数据, 提取了垂直总电子含量(VTEC)和倾斜总电子含量(STEC)作为评价基准, 评估了同化GIM TEC数据的IRI-Plas 2020模型、未同化外部TEC的IRI-Plas 2020模型和IRI-2020模型. 针对不同模型与GNSS观测值之间的精度差异做了详细评估与分析, 分析了电离层纬度变化、日变化与季节变化规律, 探究了两种模型在不同地磁情况下的精度表现. 结果表明, 两种模型均能很好地表现电离层特征, 其中同化GIM TEC的IRI-Plas模型值精度最高, 由于模型计算高度范围的限制, 导致IRI模型值偏低, 未同化外部TEC的IRI-Plas模型值偏高. 同时, 两种模型的误差都表现出纬度变化, 通常随着纬度的增加而下降, 这些变化还显示出季节性趋势.
-
关键词:
- 电离层 /
- 全球导航卫星系统 /
- 倾斜总电子含量 /
- IRI-Plas 2020模型 /
- IRI-2020模型
Abstract: The ionosphere plays a crucial role in aerospace, communication and navigation positioning, and empirical ionospheric models such as the IRI (International Reference Ionosphere) model and IRI-Plas (International Reference Ionosphere Extended to Plasmasphere) model are widely used in estimating ionospheric parameters. Due to the uneven distribution and missing stations in certain regions of GNSS (Global Navigation Satellite System) stations, empirical ionospheric models are often employed in ionospheric research to address data scarcity. Evaluating the latest versions of the IRI-Plas model and the IRI model will assist in understanding the ionospheric response and model performance under different environments, enabling better refinement of existing models. Based on the dual-frequency observations of 135 GNSS stations worldwide, the Vertical Total Electron Content (VTEC) and Slant Total Electron Content (STEC) are extracted in this study to evaluate the IRI-Plas 2020 model with GIM TEC input, the IRI-Plas 2020 model without external TEC input, and the IRI-2020 model. The differences between different ionospheric models and GNSS observations are presented and analyzed in detail, including patterns of ionospheric latitude variation, daily variation and seasonal variation and the accuracy of models under different geomagnetic conditions. The results show that all models can represent the ionospheric characteristics very well, among which the IRI-Plas model value with GIM TEC input has the highest accuracy, while the IRI-Plas model value without external TEC input is high due to the limitation of the model calculation altitude range. Also, the errors of all models exhibit latitudinal variations, usually decreasing with the increase of latitude, and these variations also show seasonal trends. -
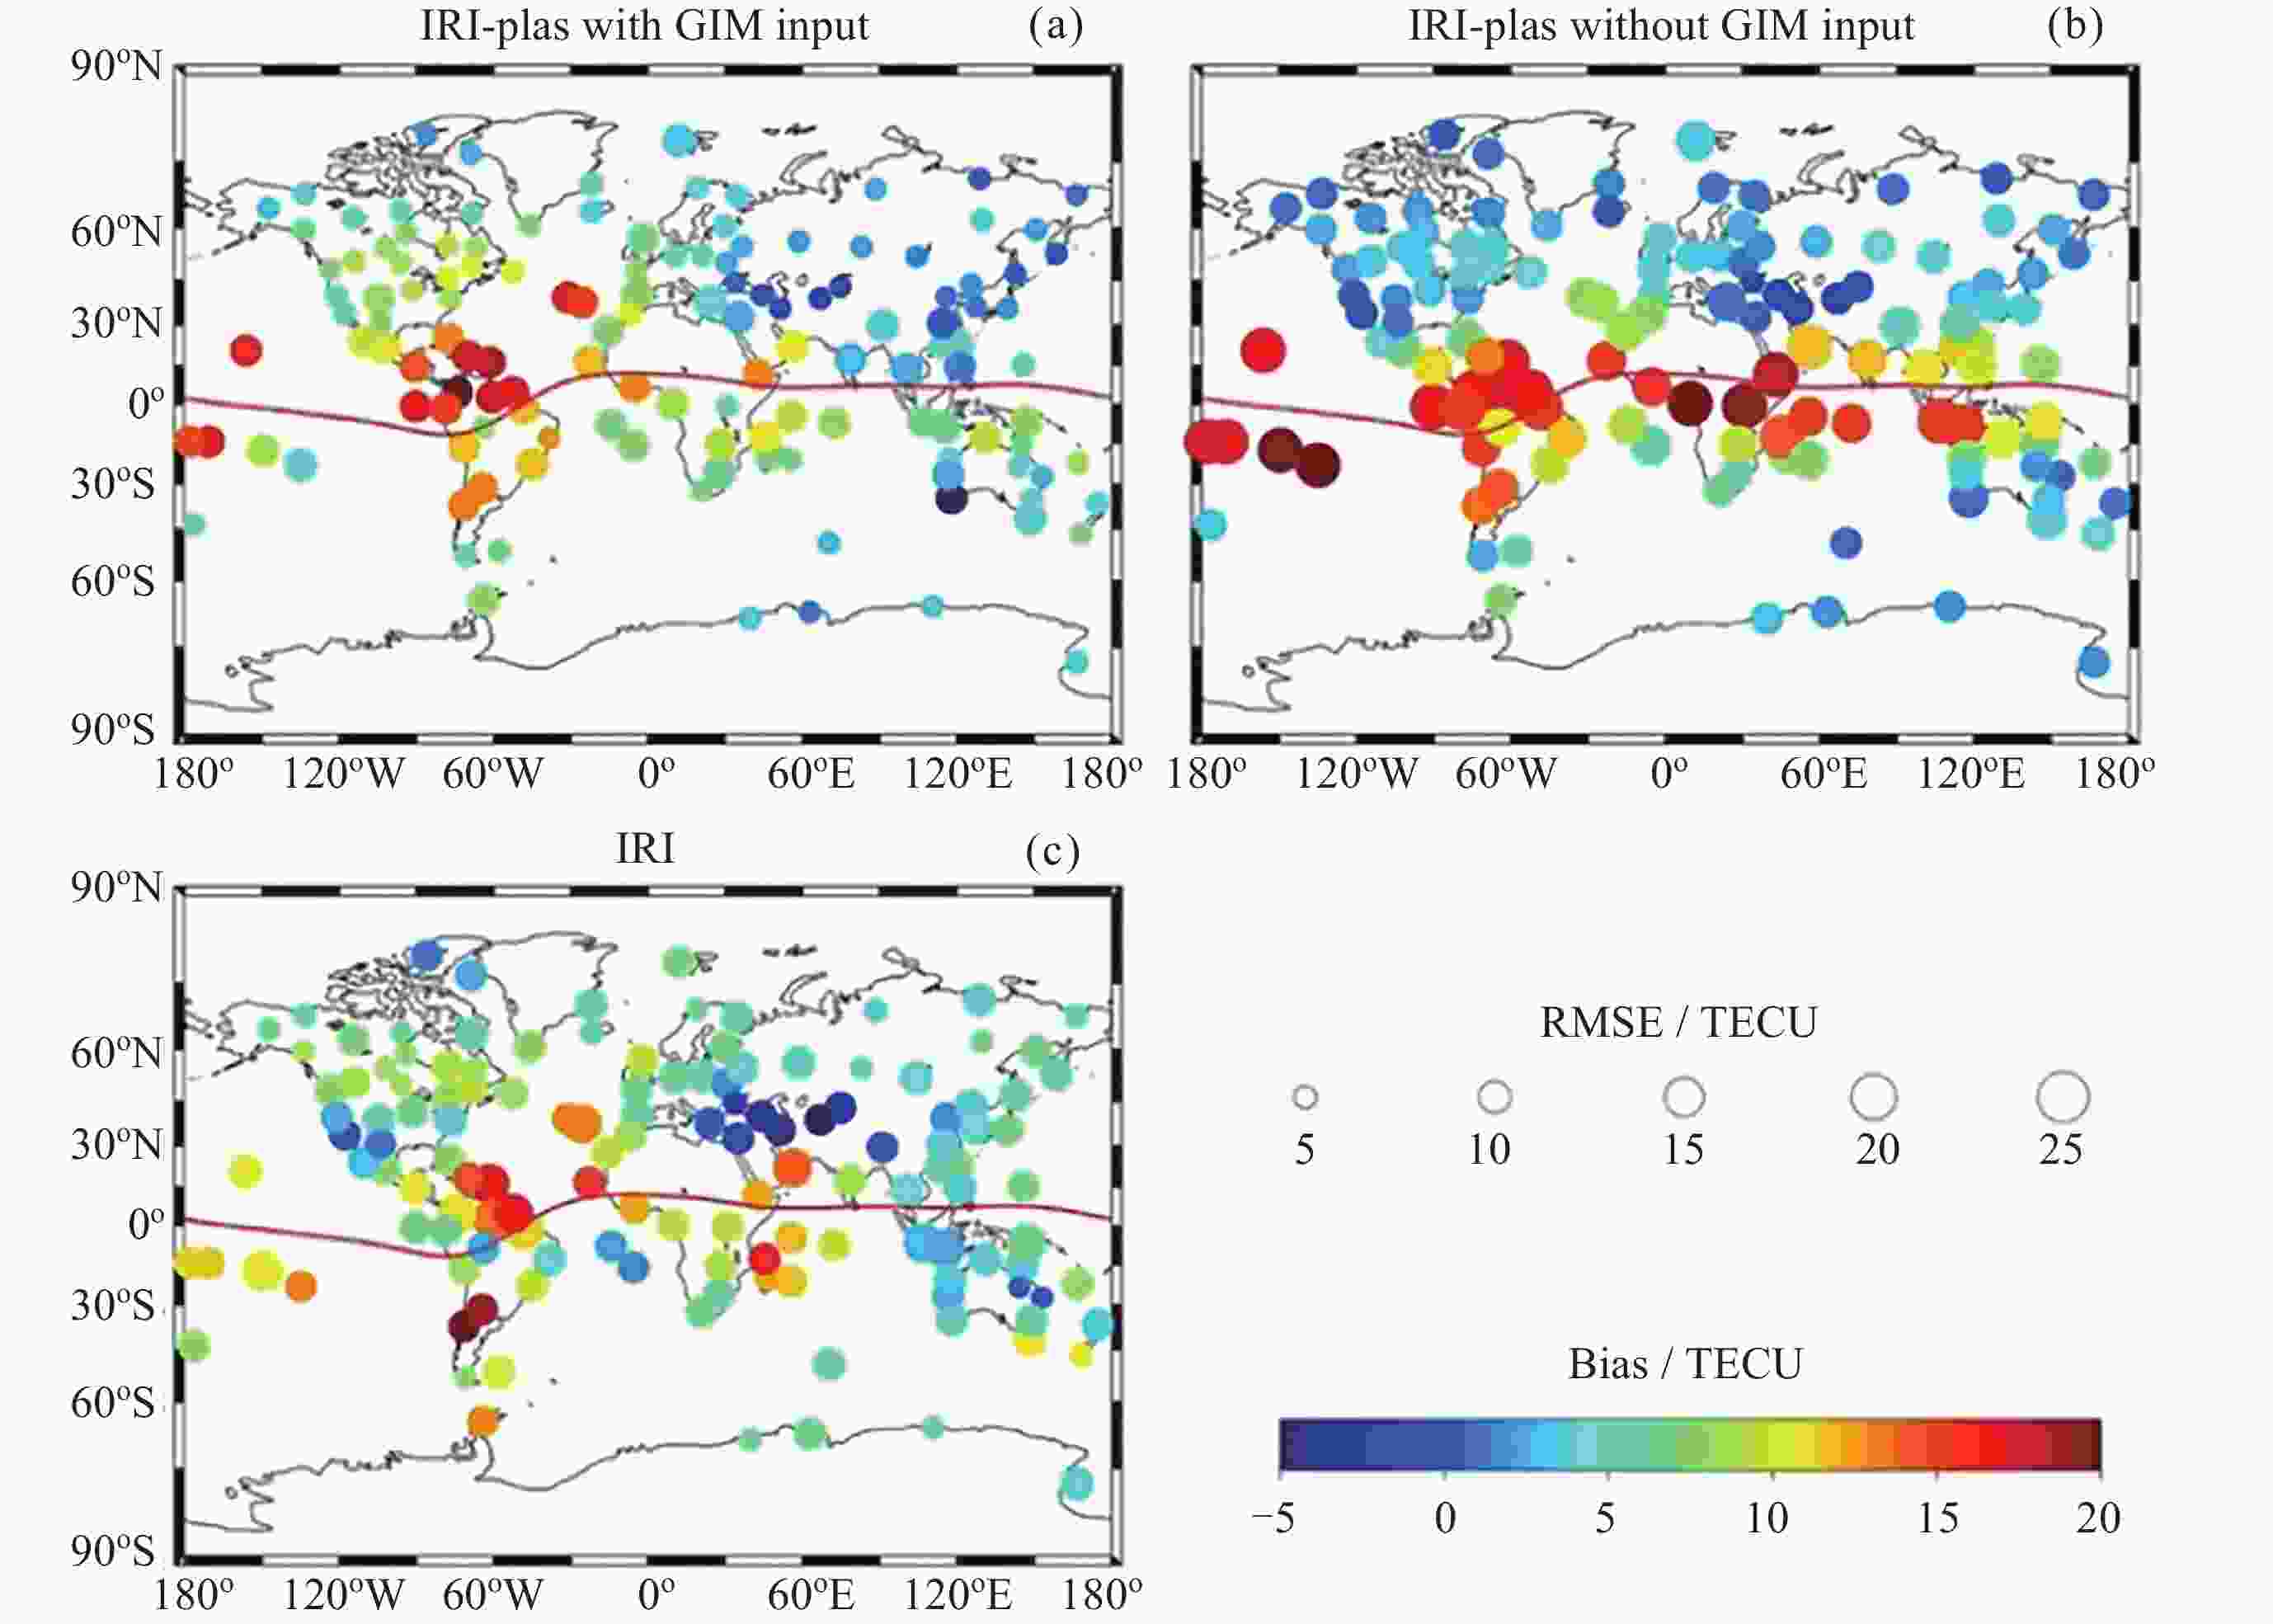
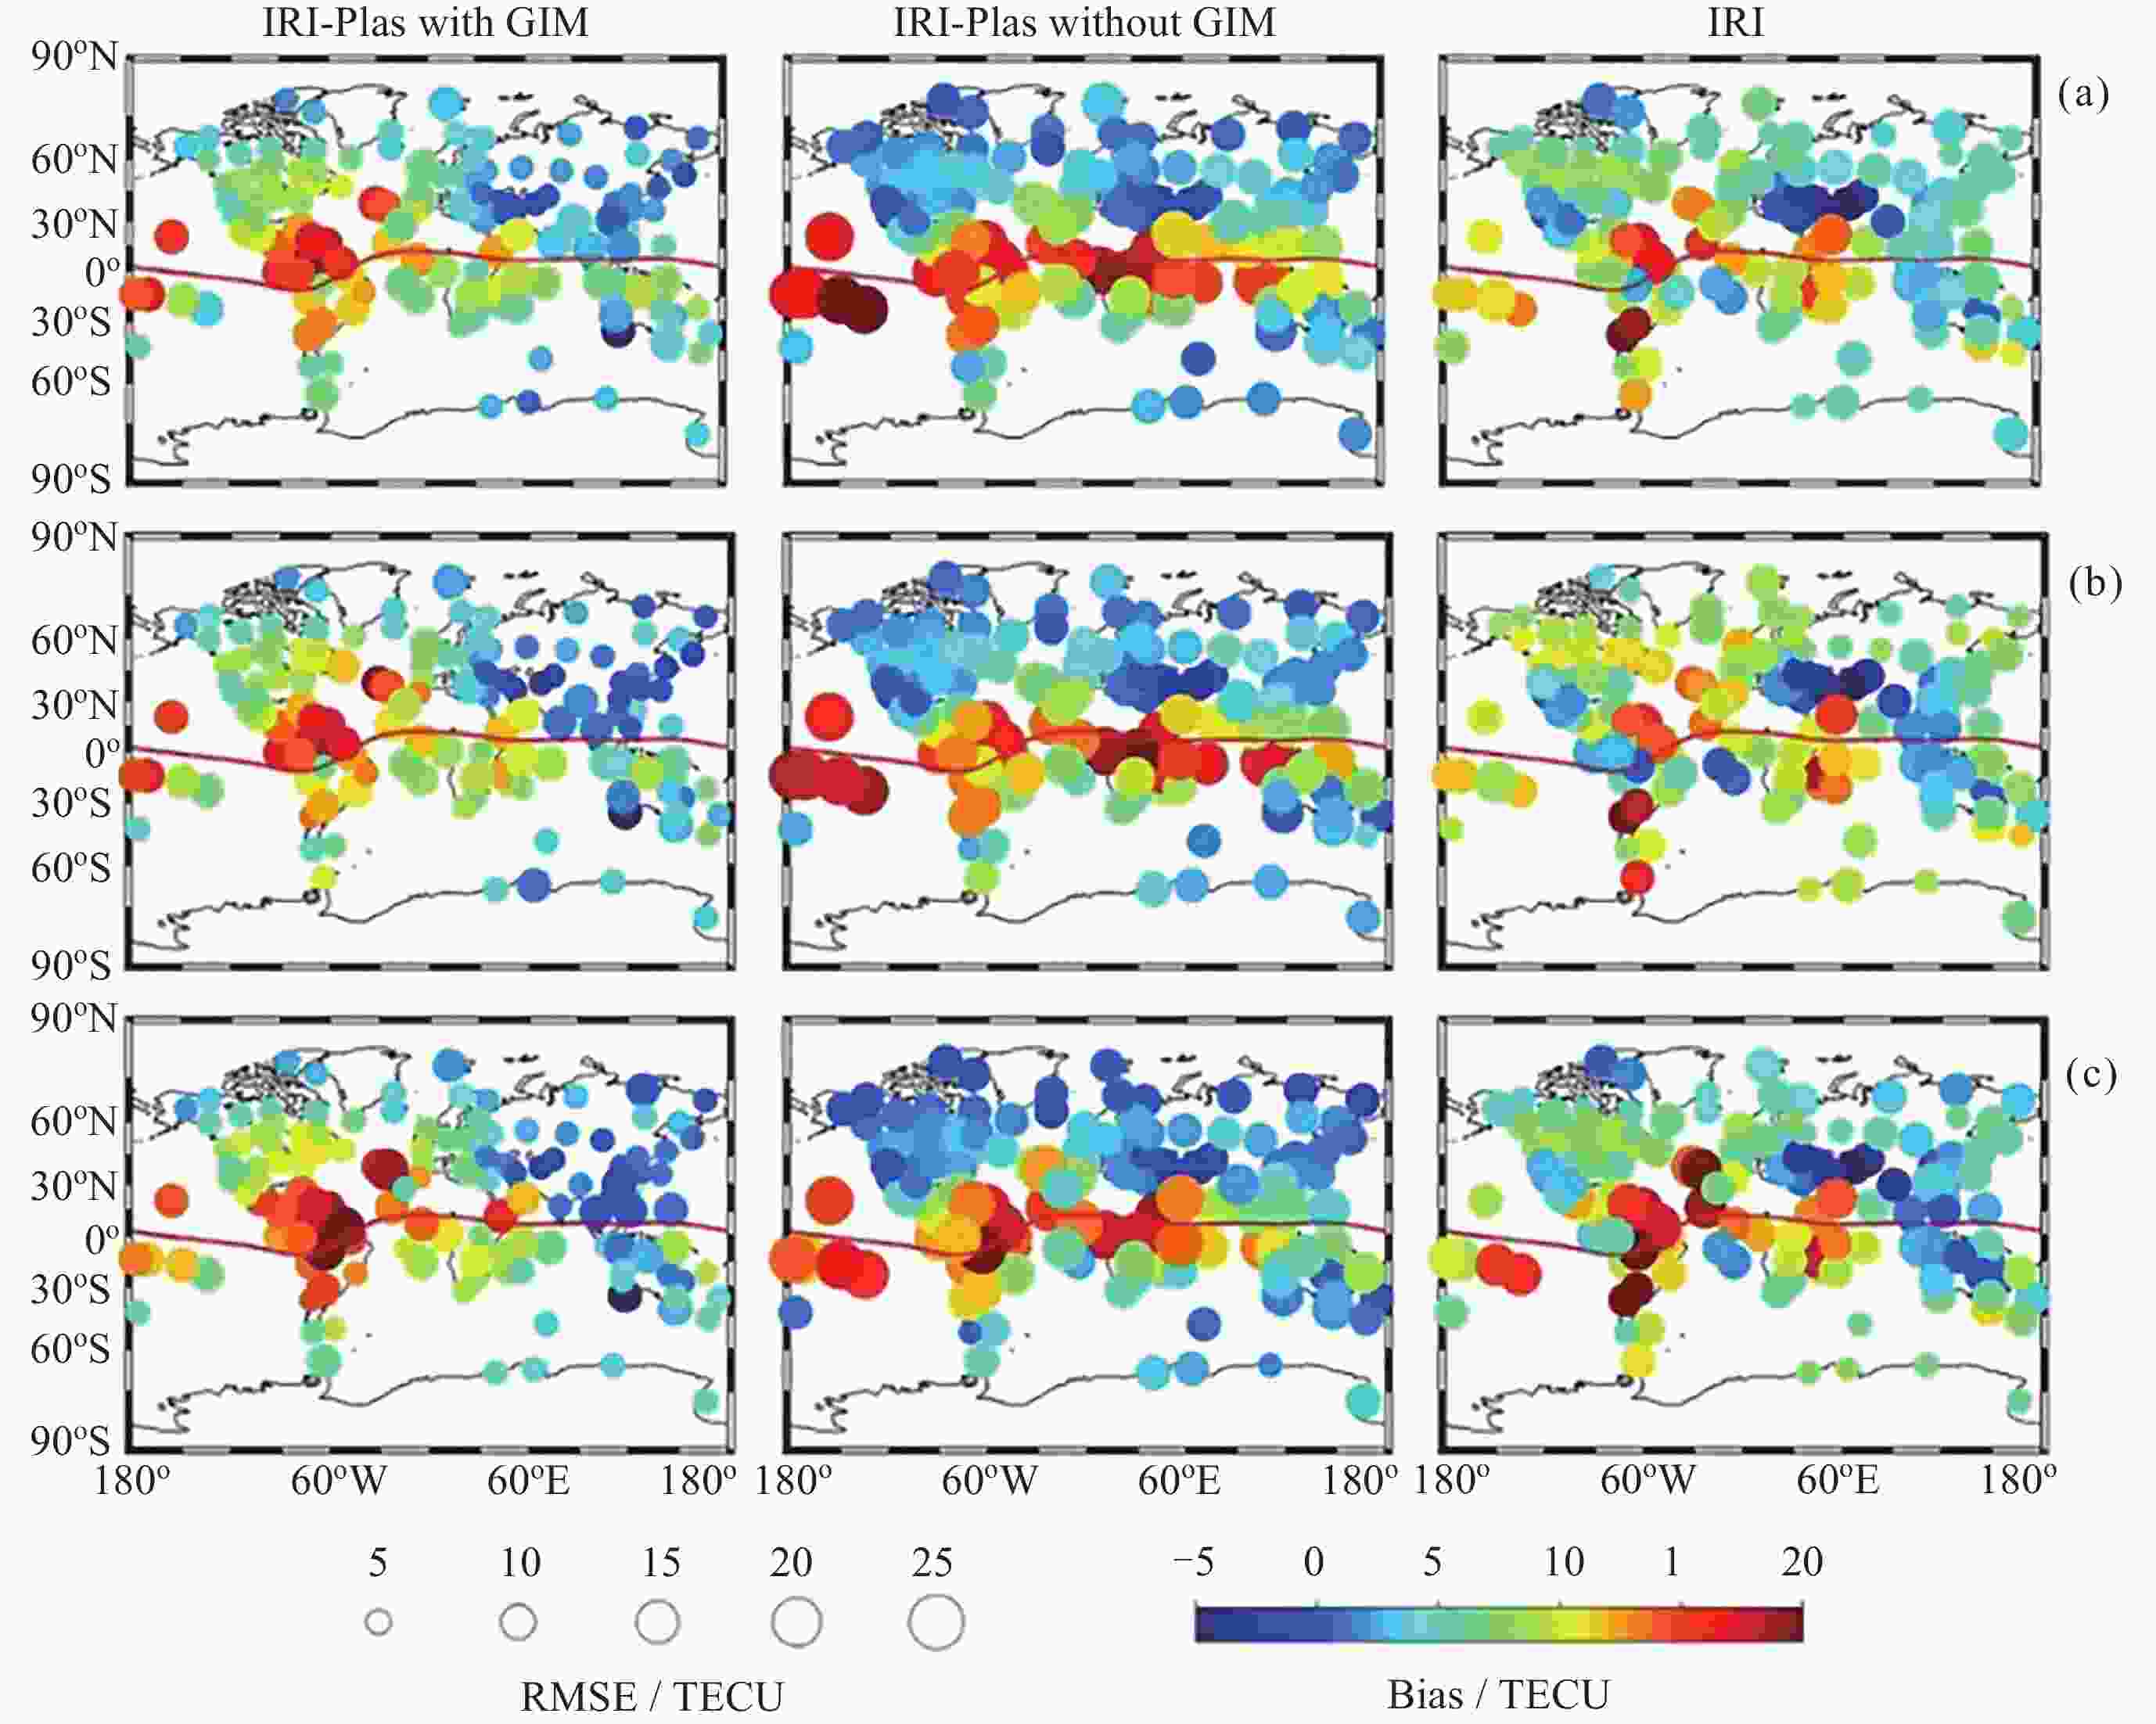
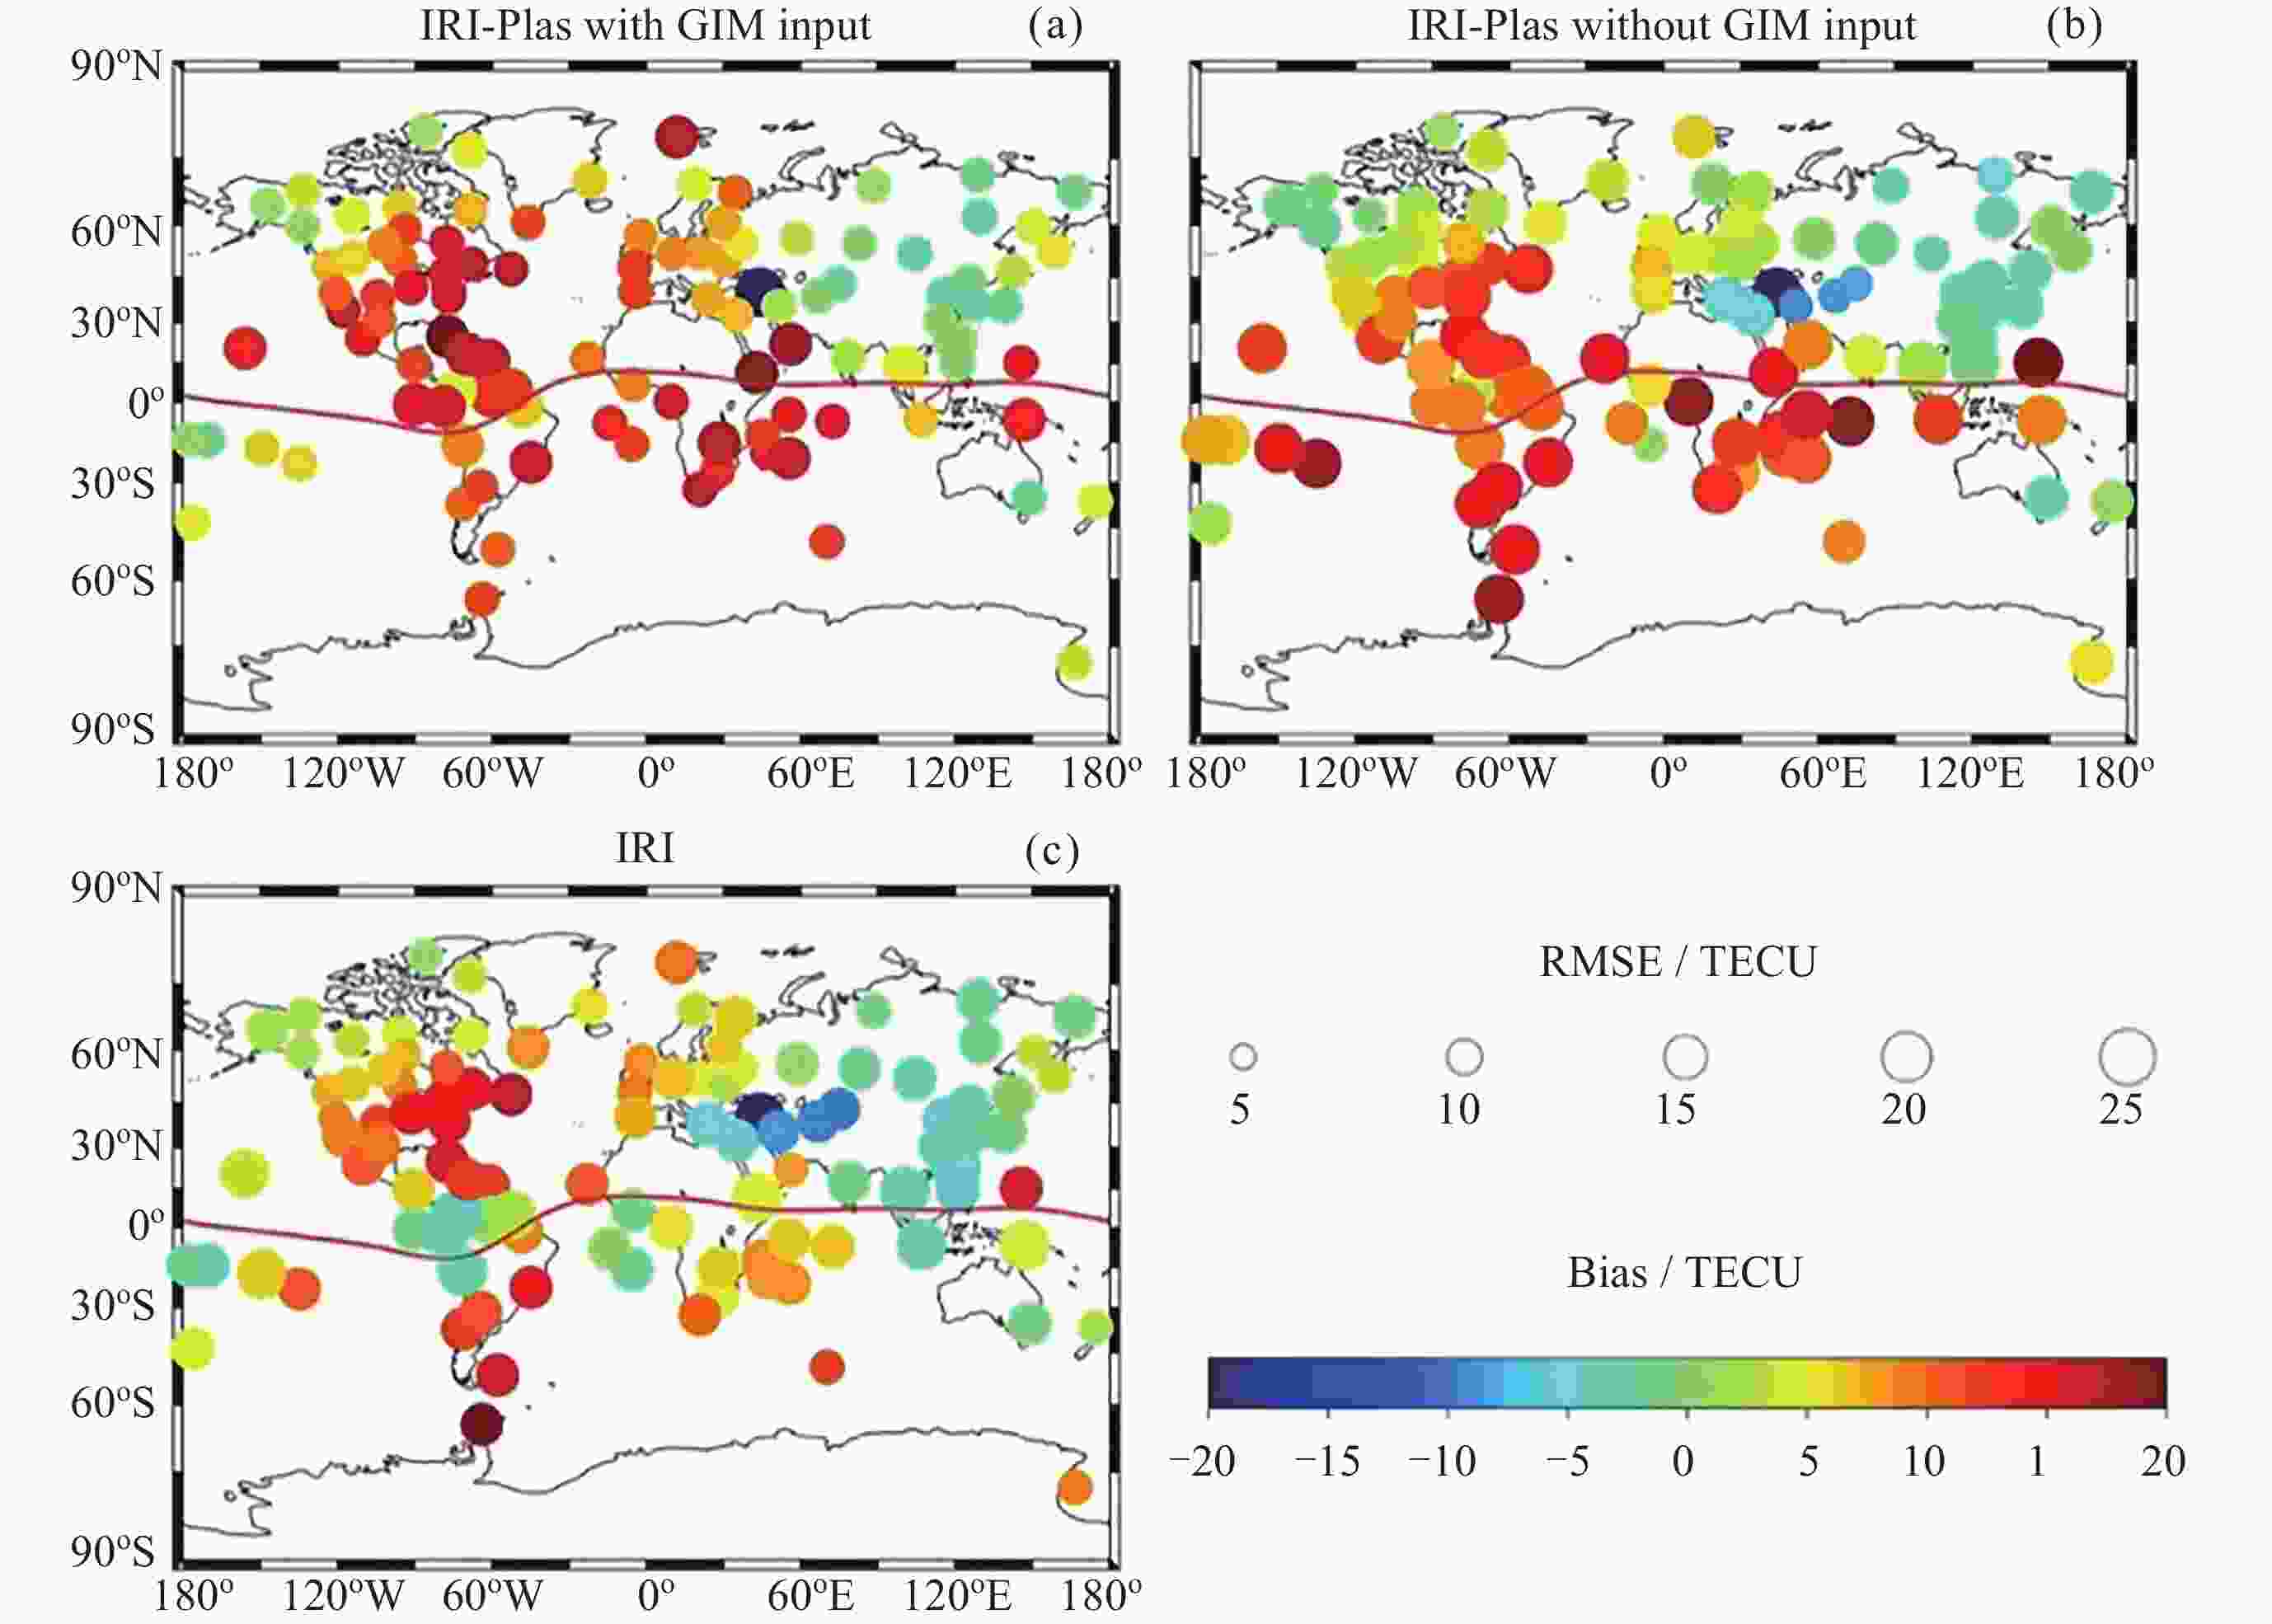
图 14 不同地磁活动情况下的全球误差均值分布. (a)为地磁平静日, (b)为地磁活动日, (c)为小磁暴日. 圆圈的颜色表示偏差值, 圆圈的大小表示均方根误差值
Figure 14. Global error distribution map under different geomagnetic condition. (a) Geomagnetic activity: quiet, (b) geomagnetic activity: active, (c) geomagnetic activity: weak storms. Bias is indicated by the color of the circle and root mean square error is indicated by the size of the circle
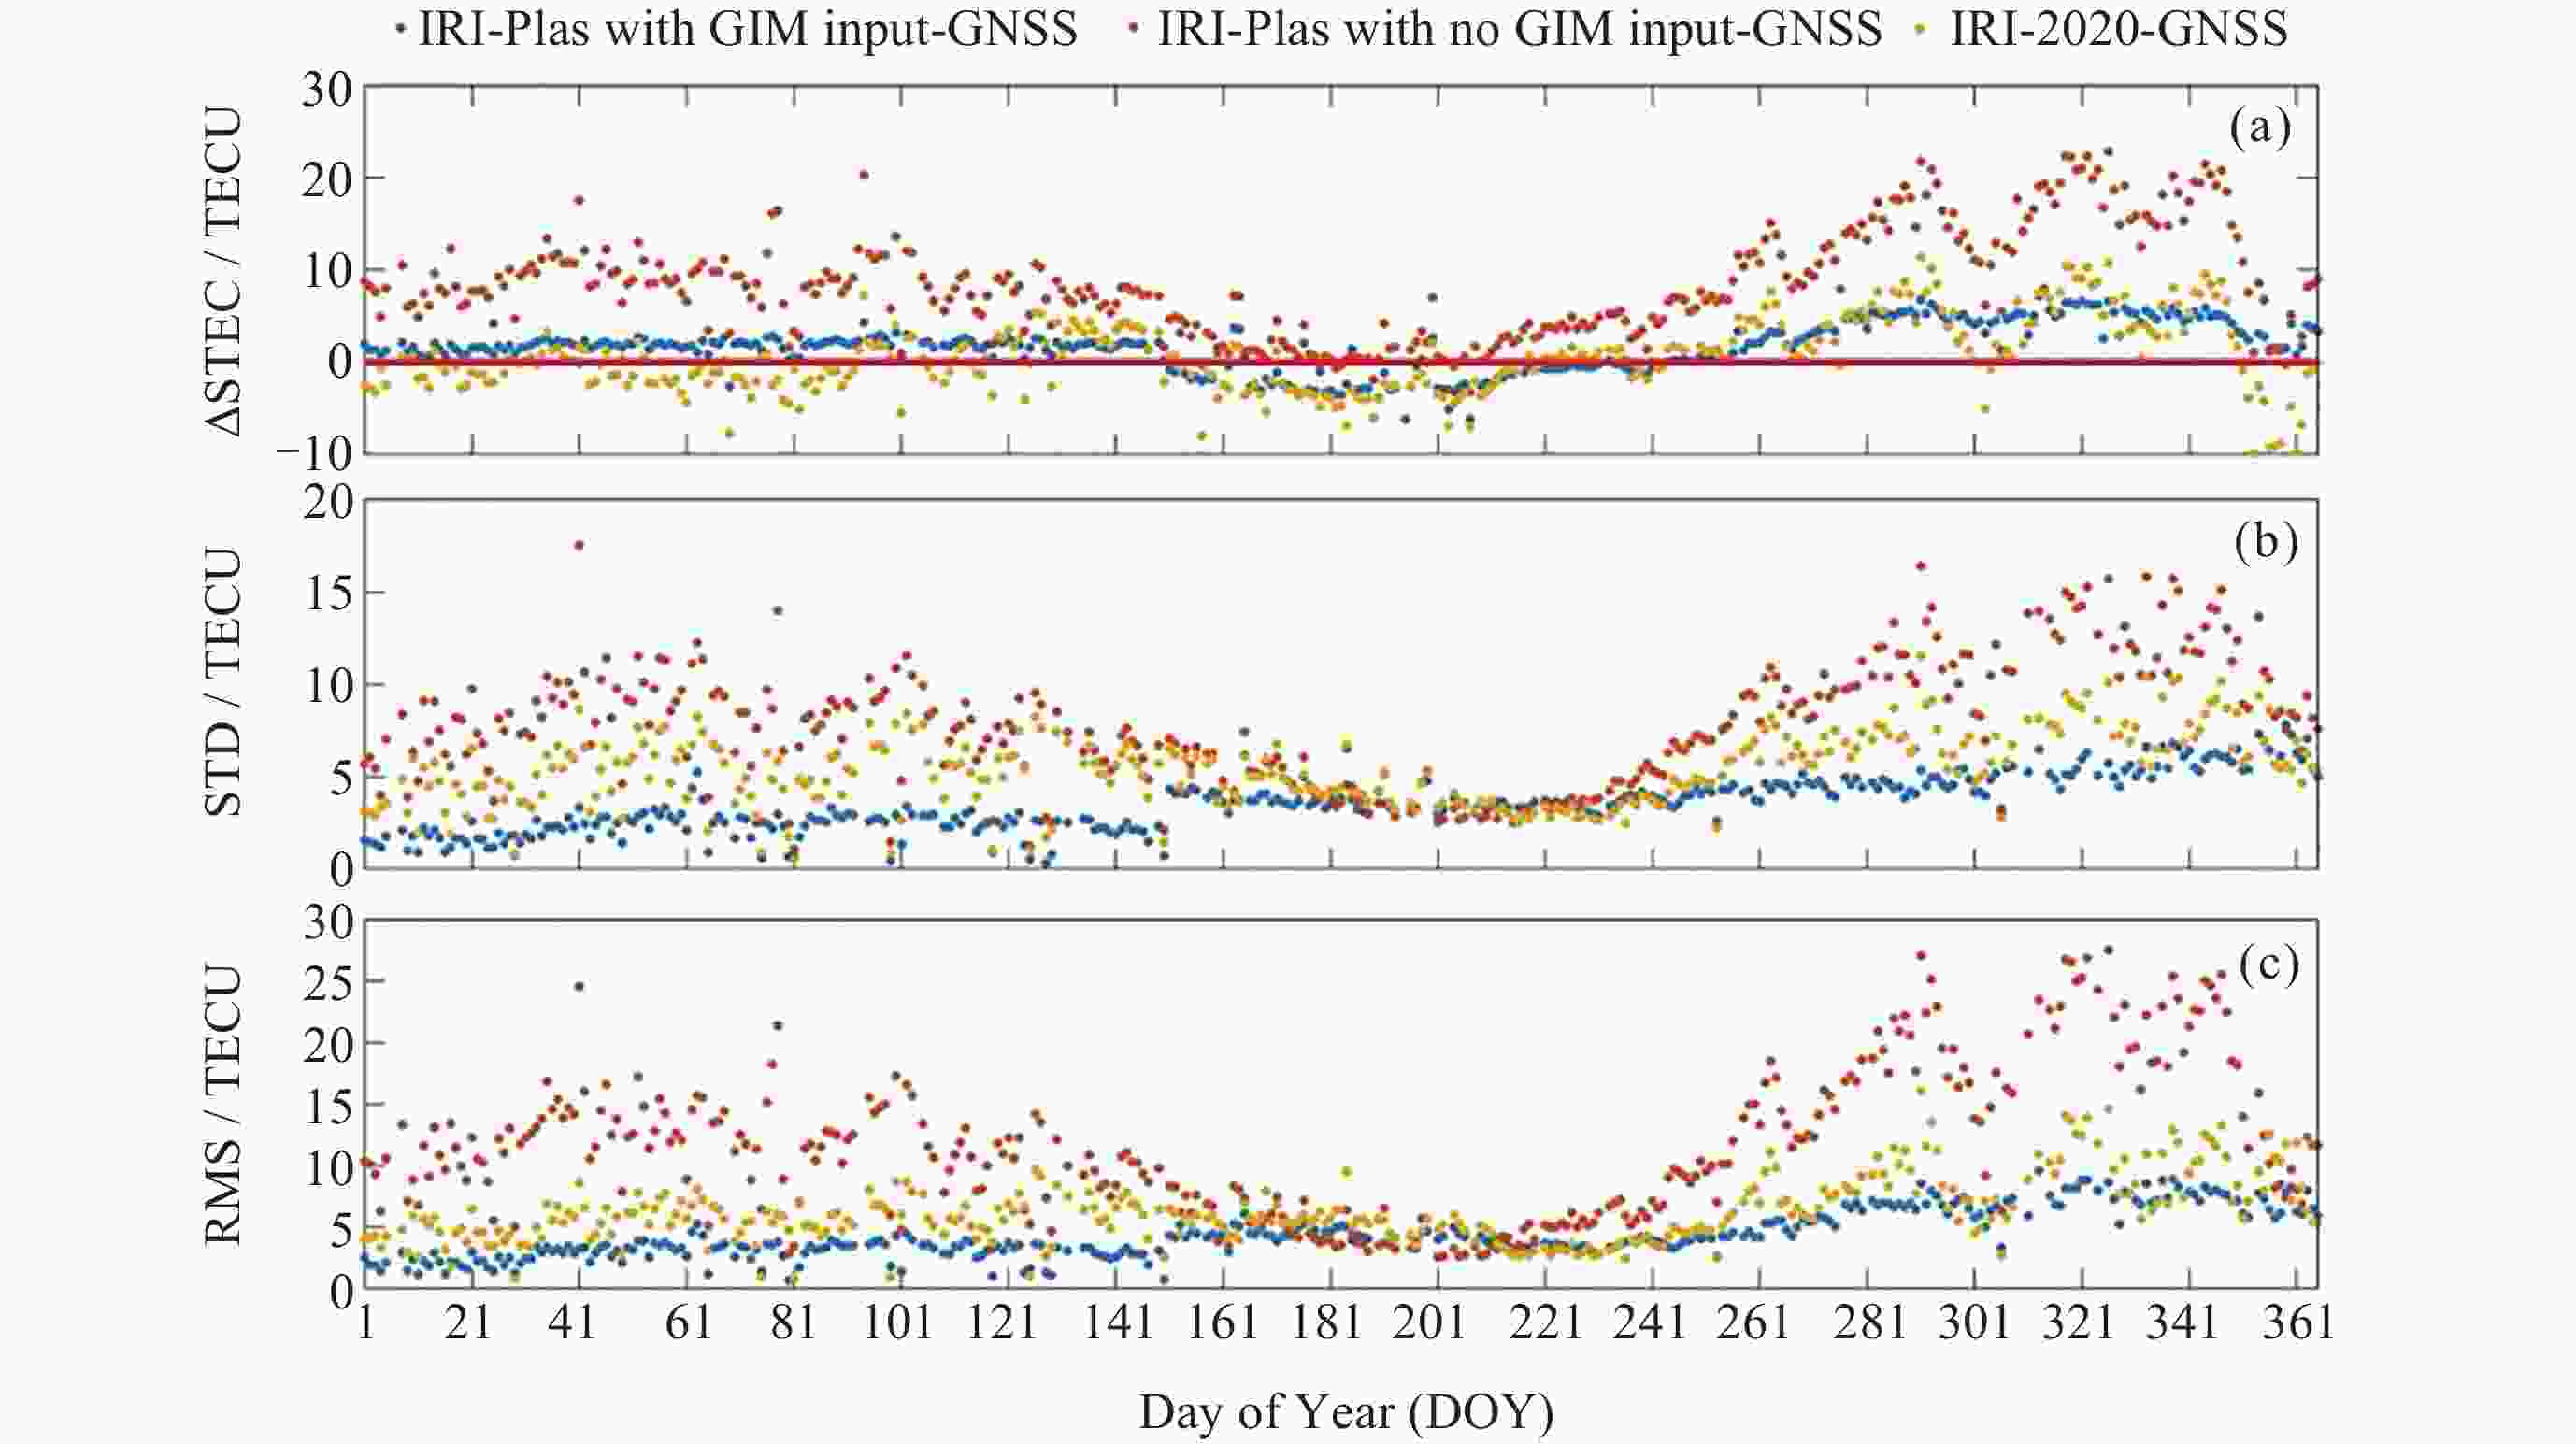
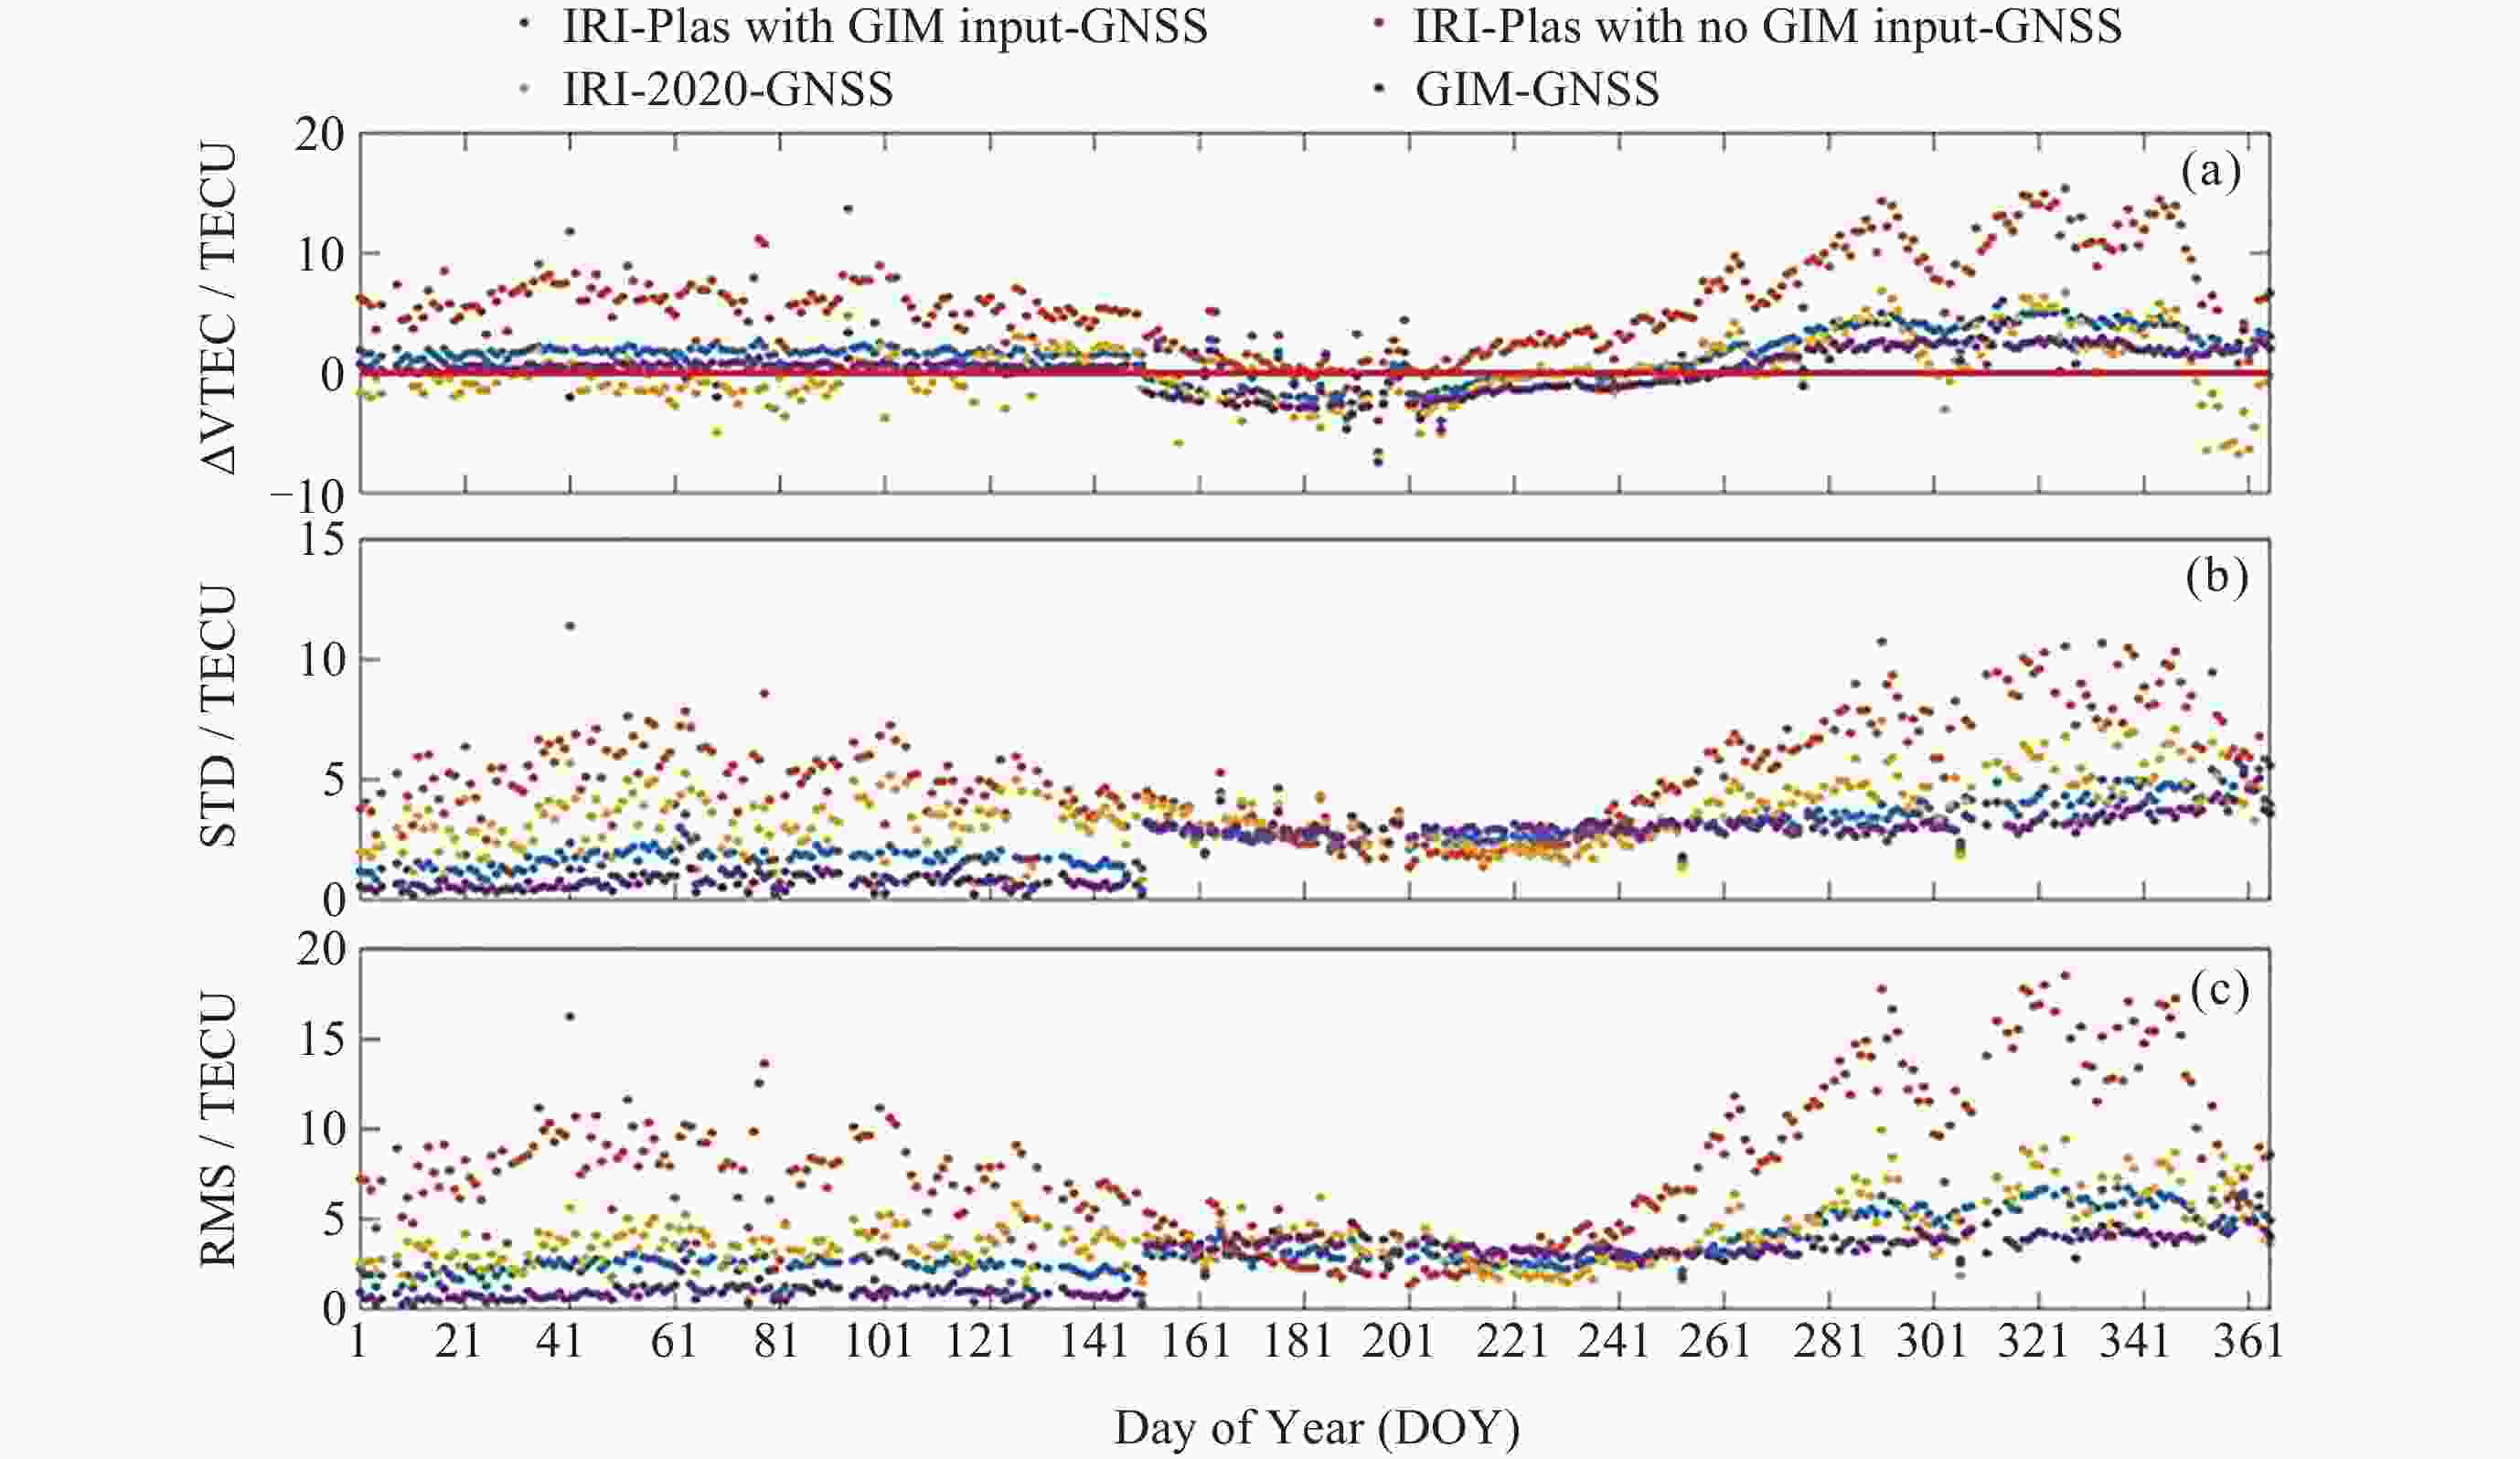
表 1 不同电离层经验模型与GNSS观测值偏差和均方根误差统计
Table 1. Statistical results of the differences between ionospheric empirical models derived from GNSS observations and calculated at 135 GNSS Sites
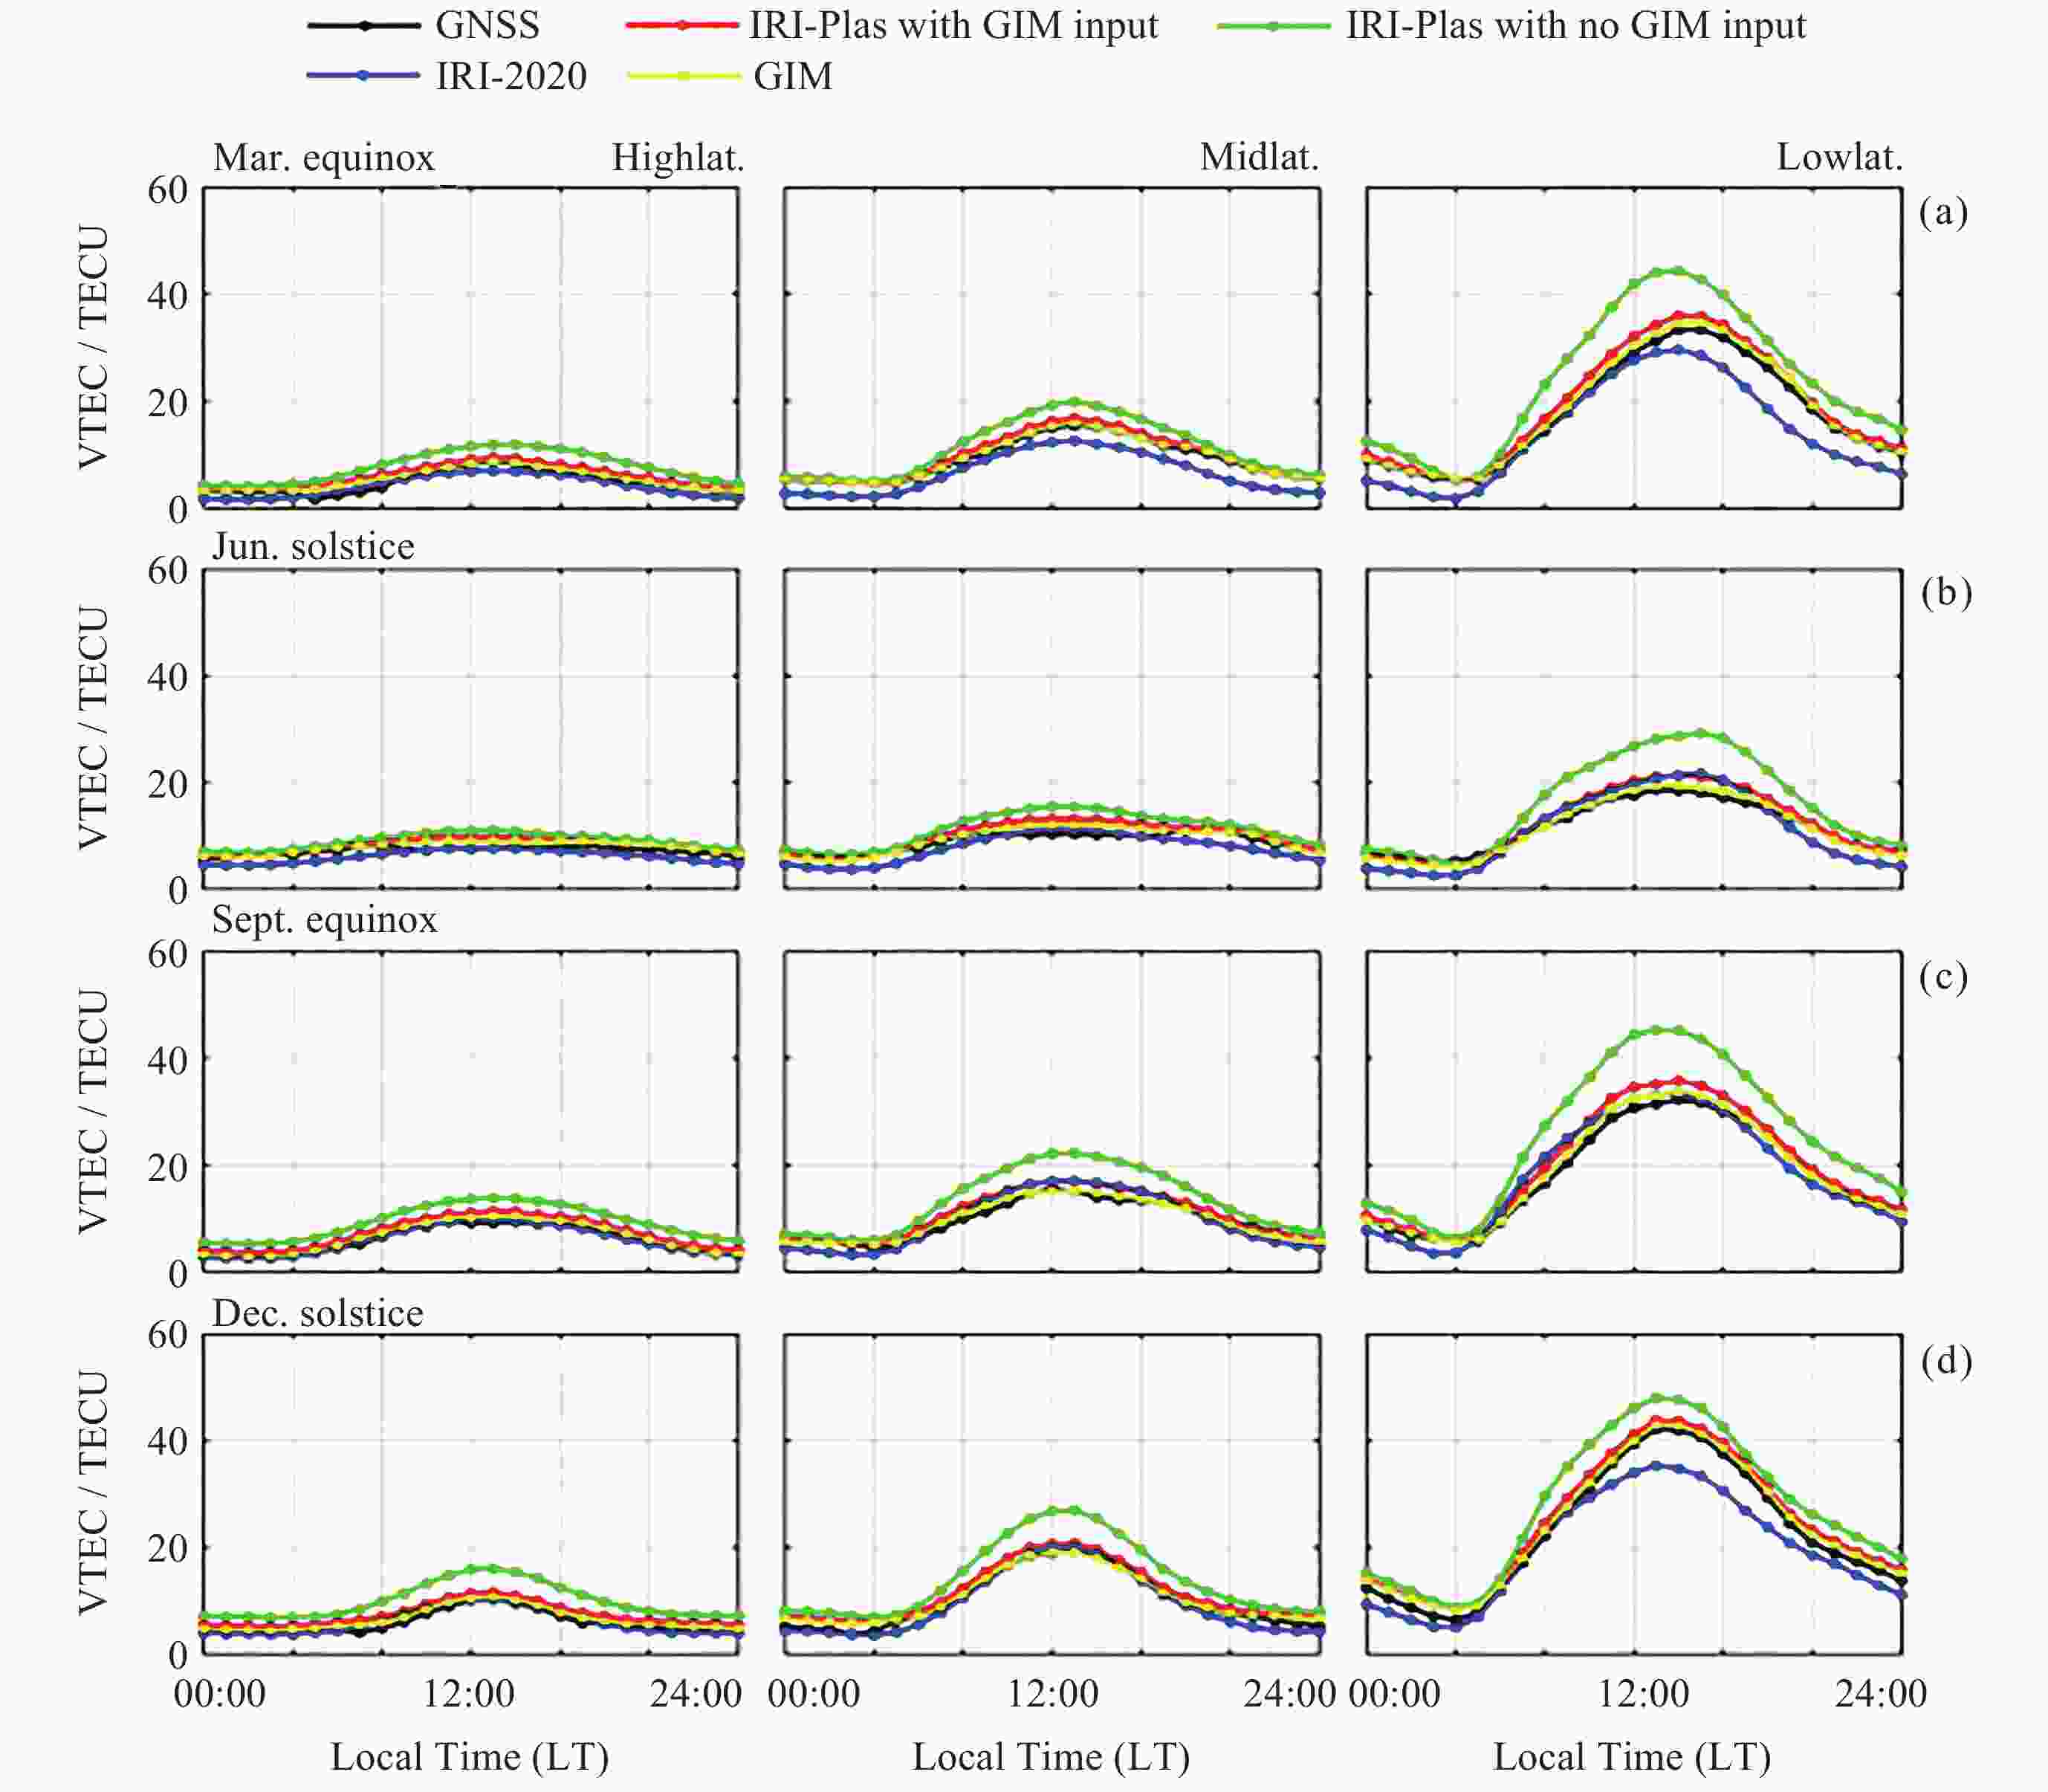
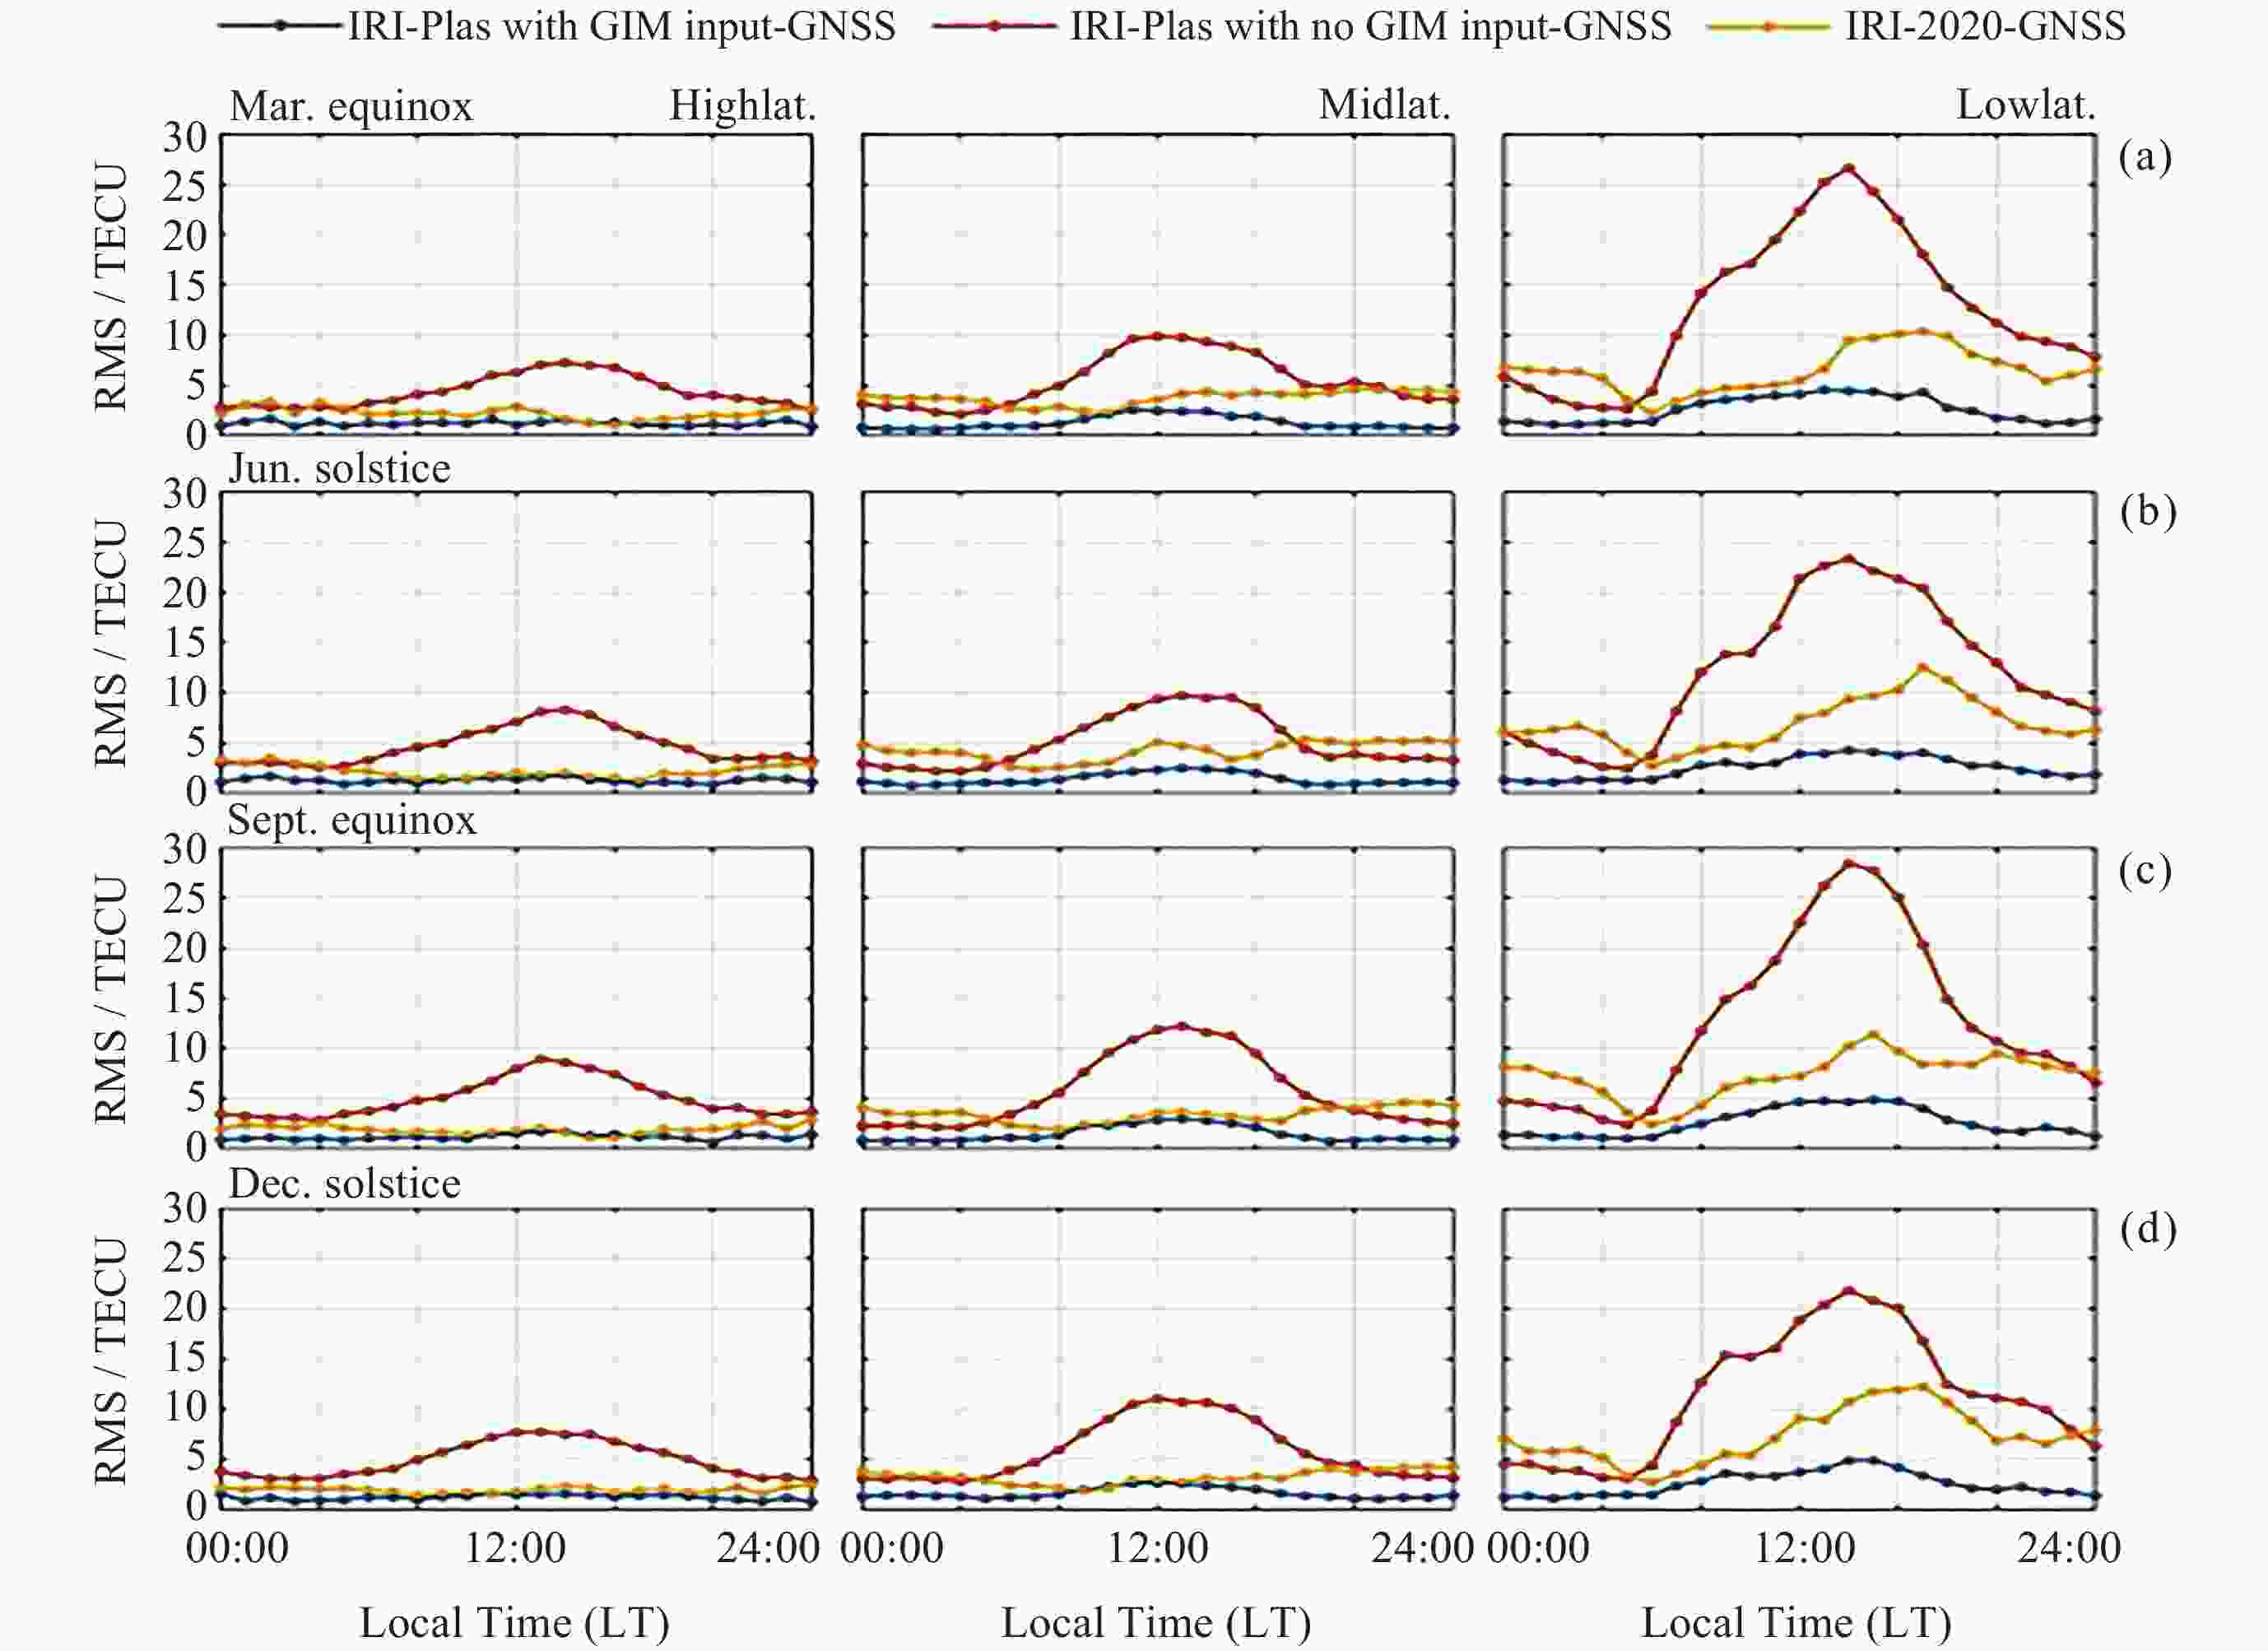
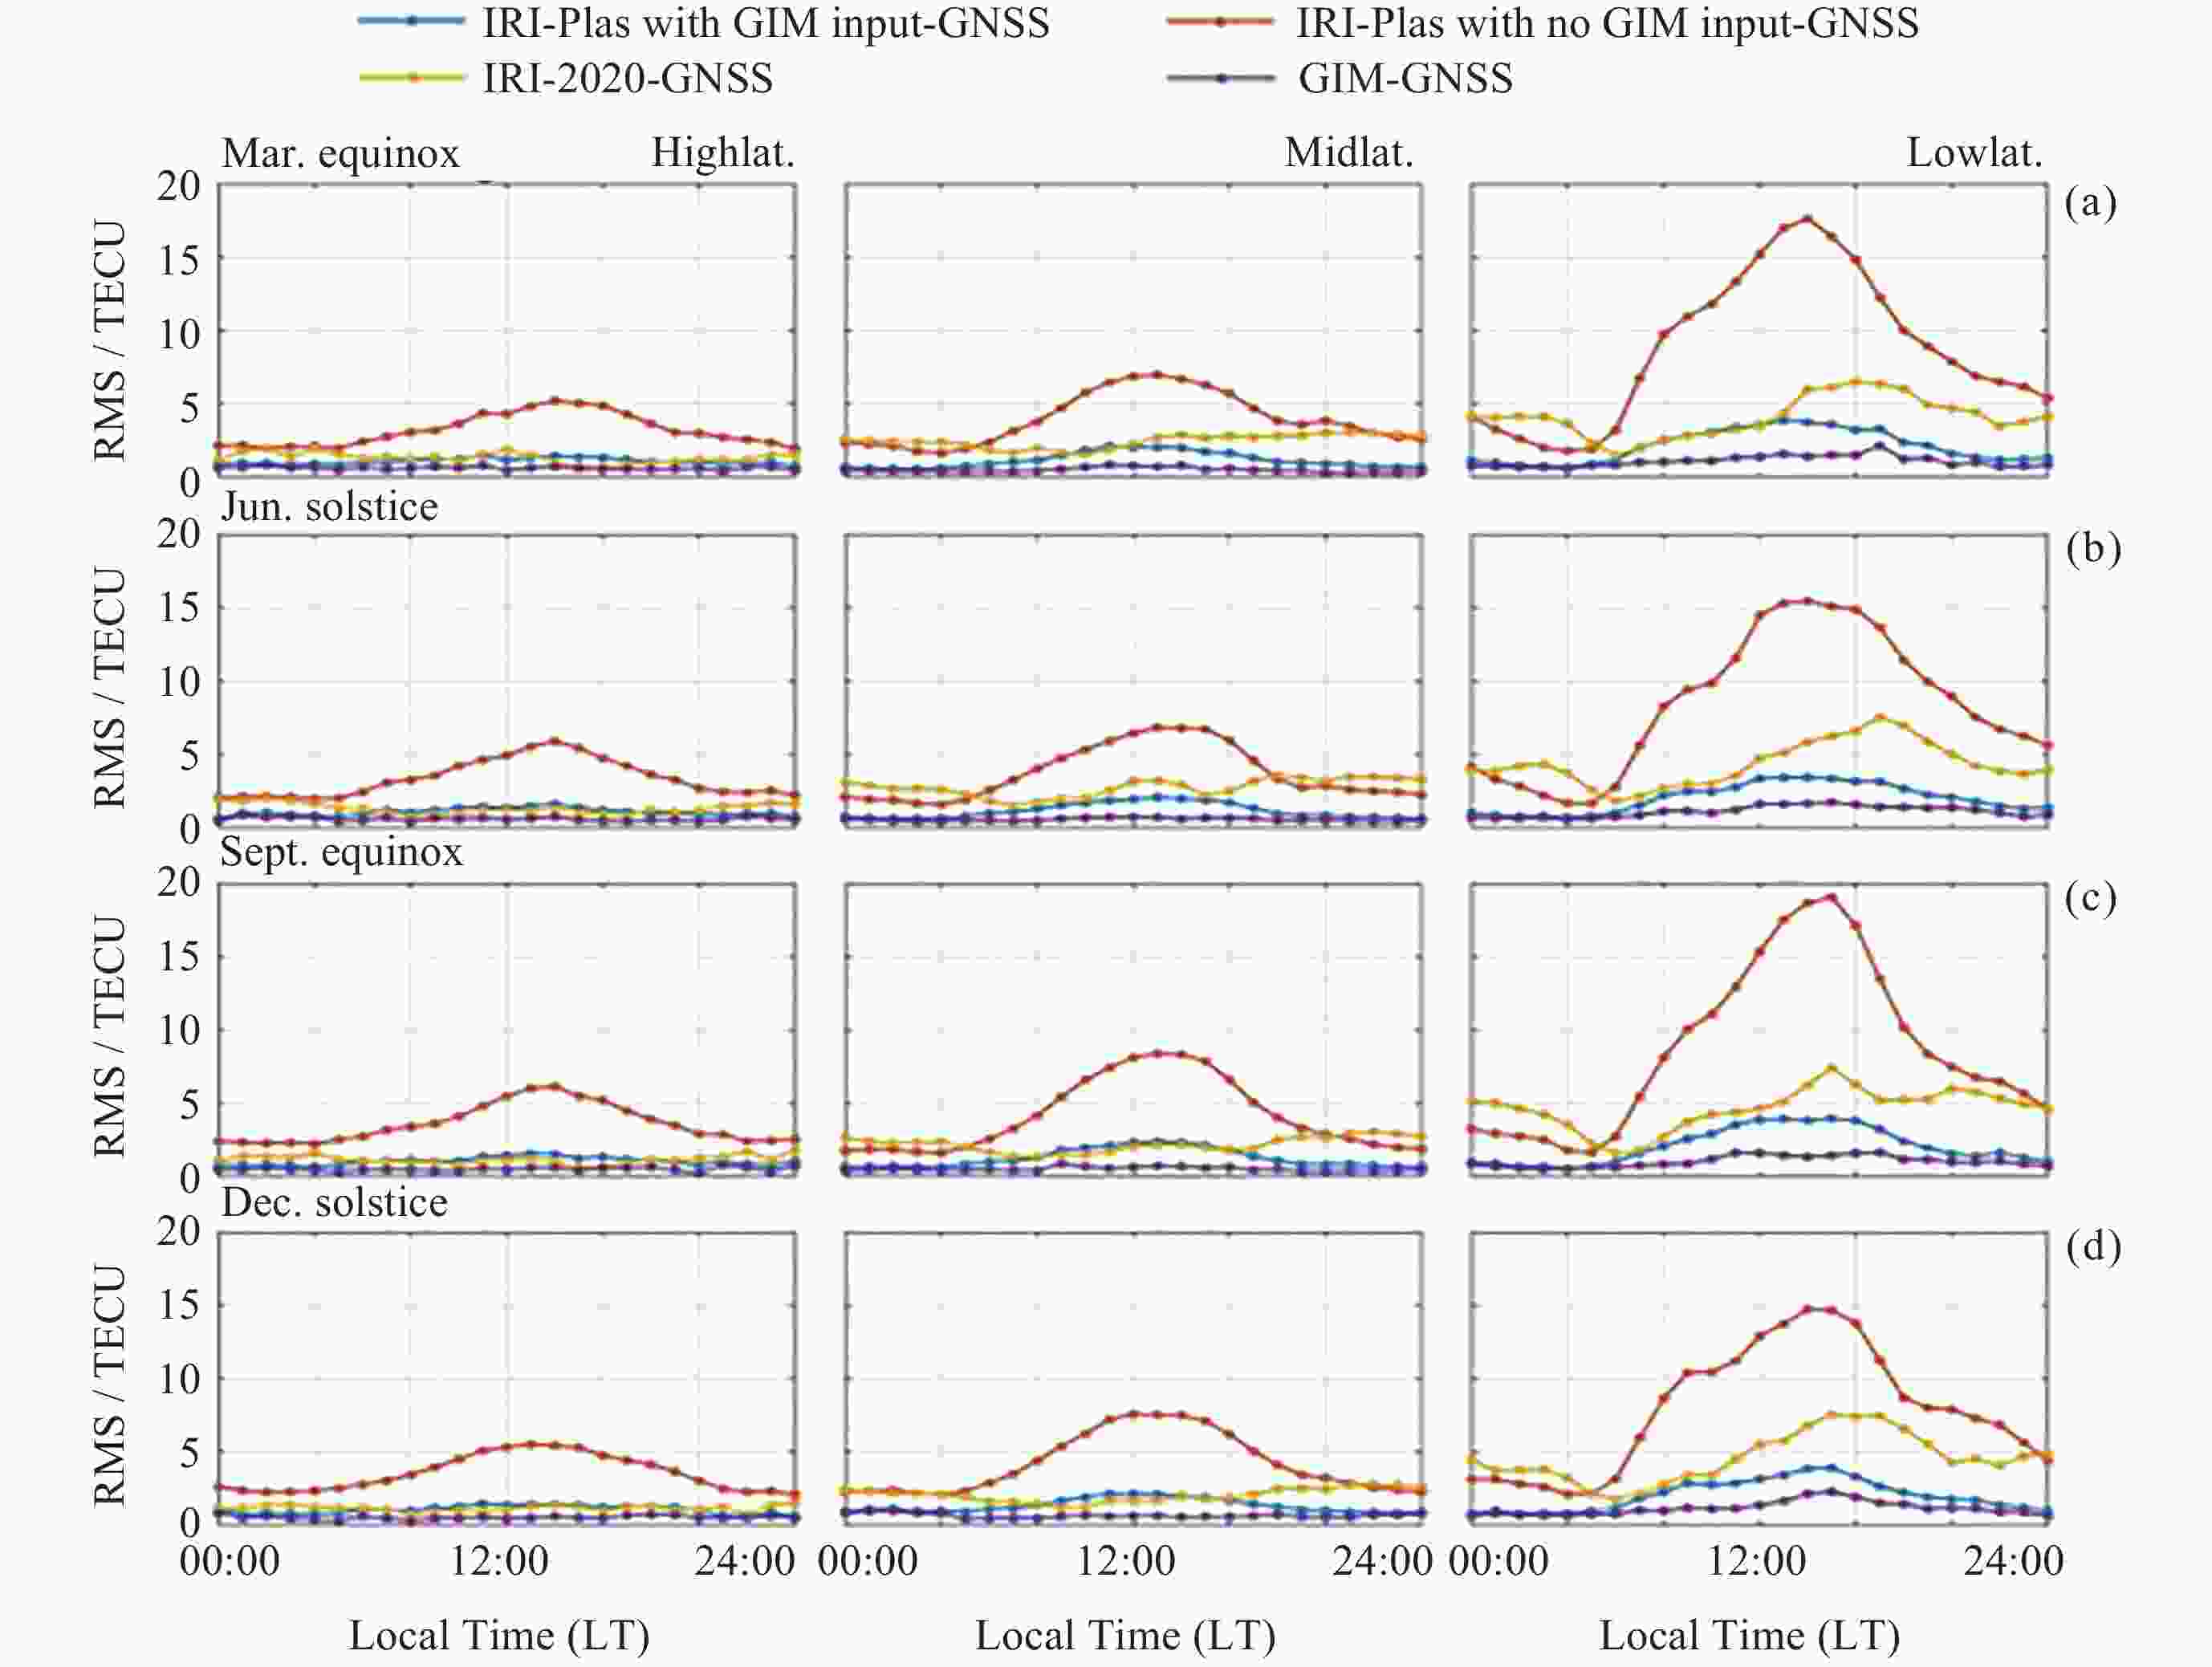
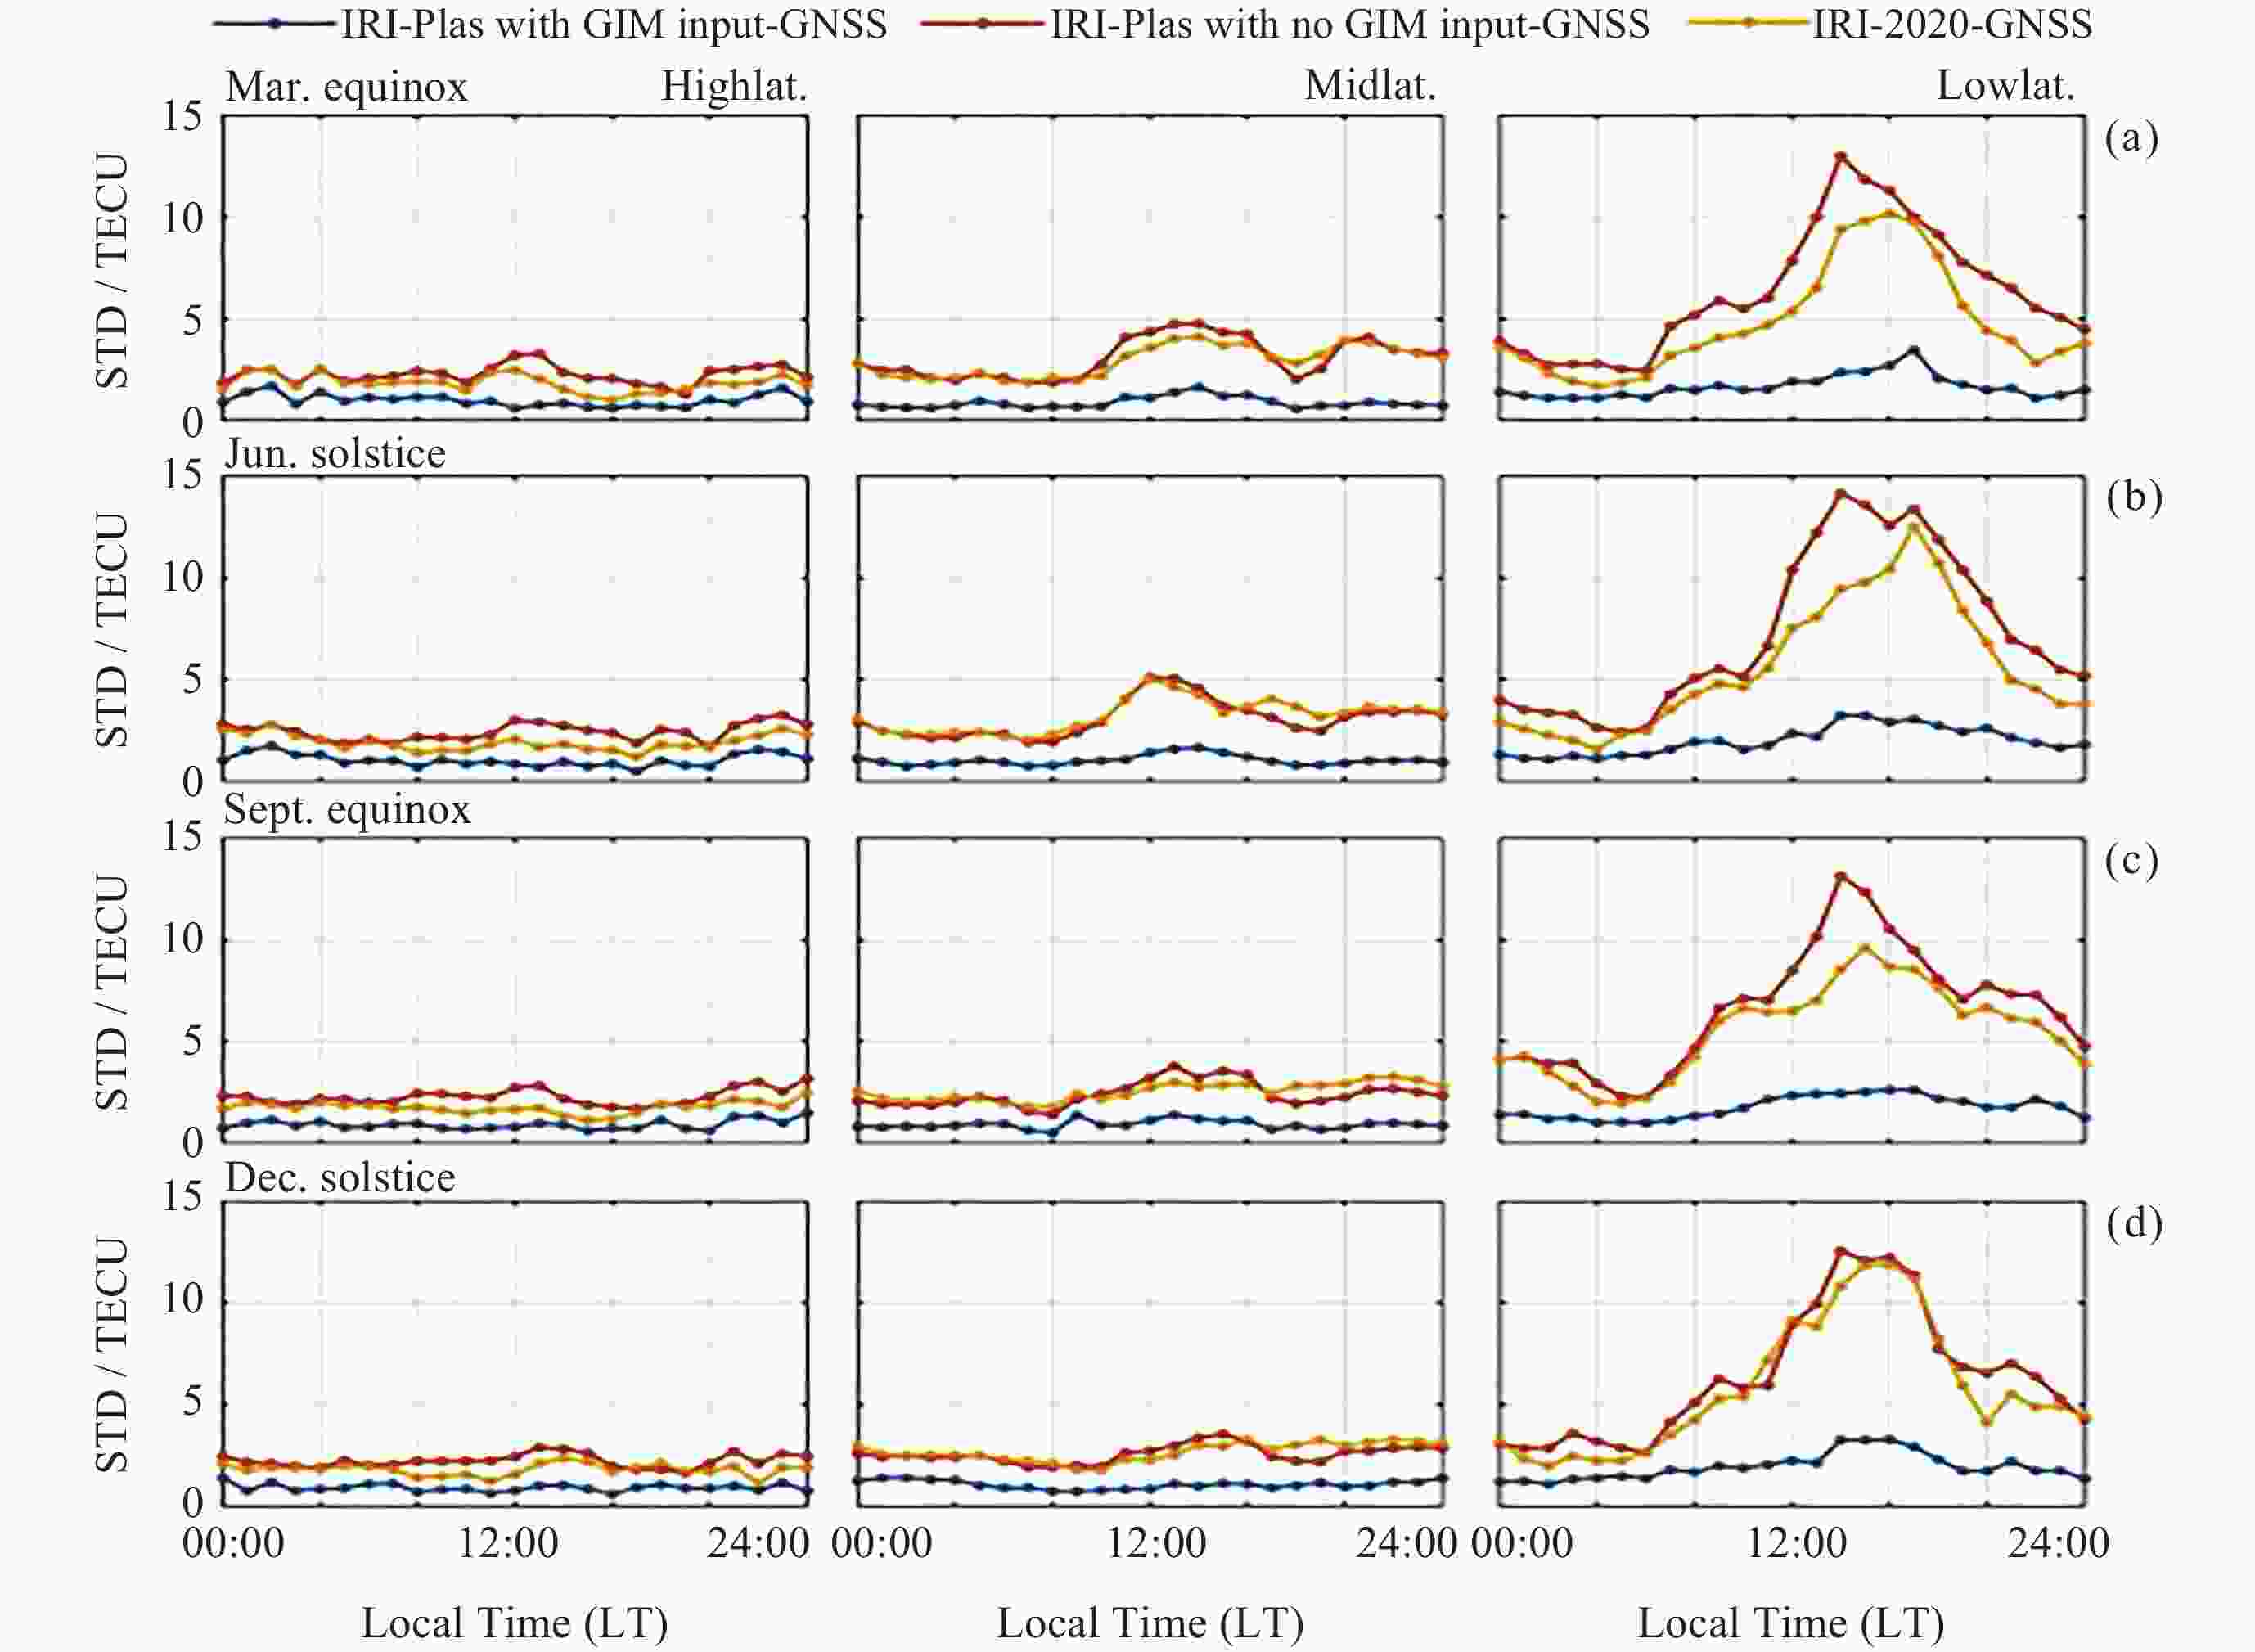
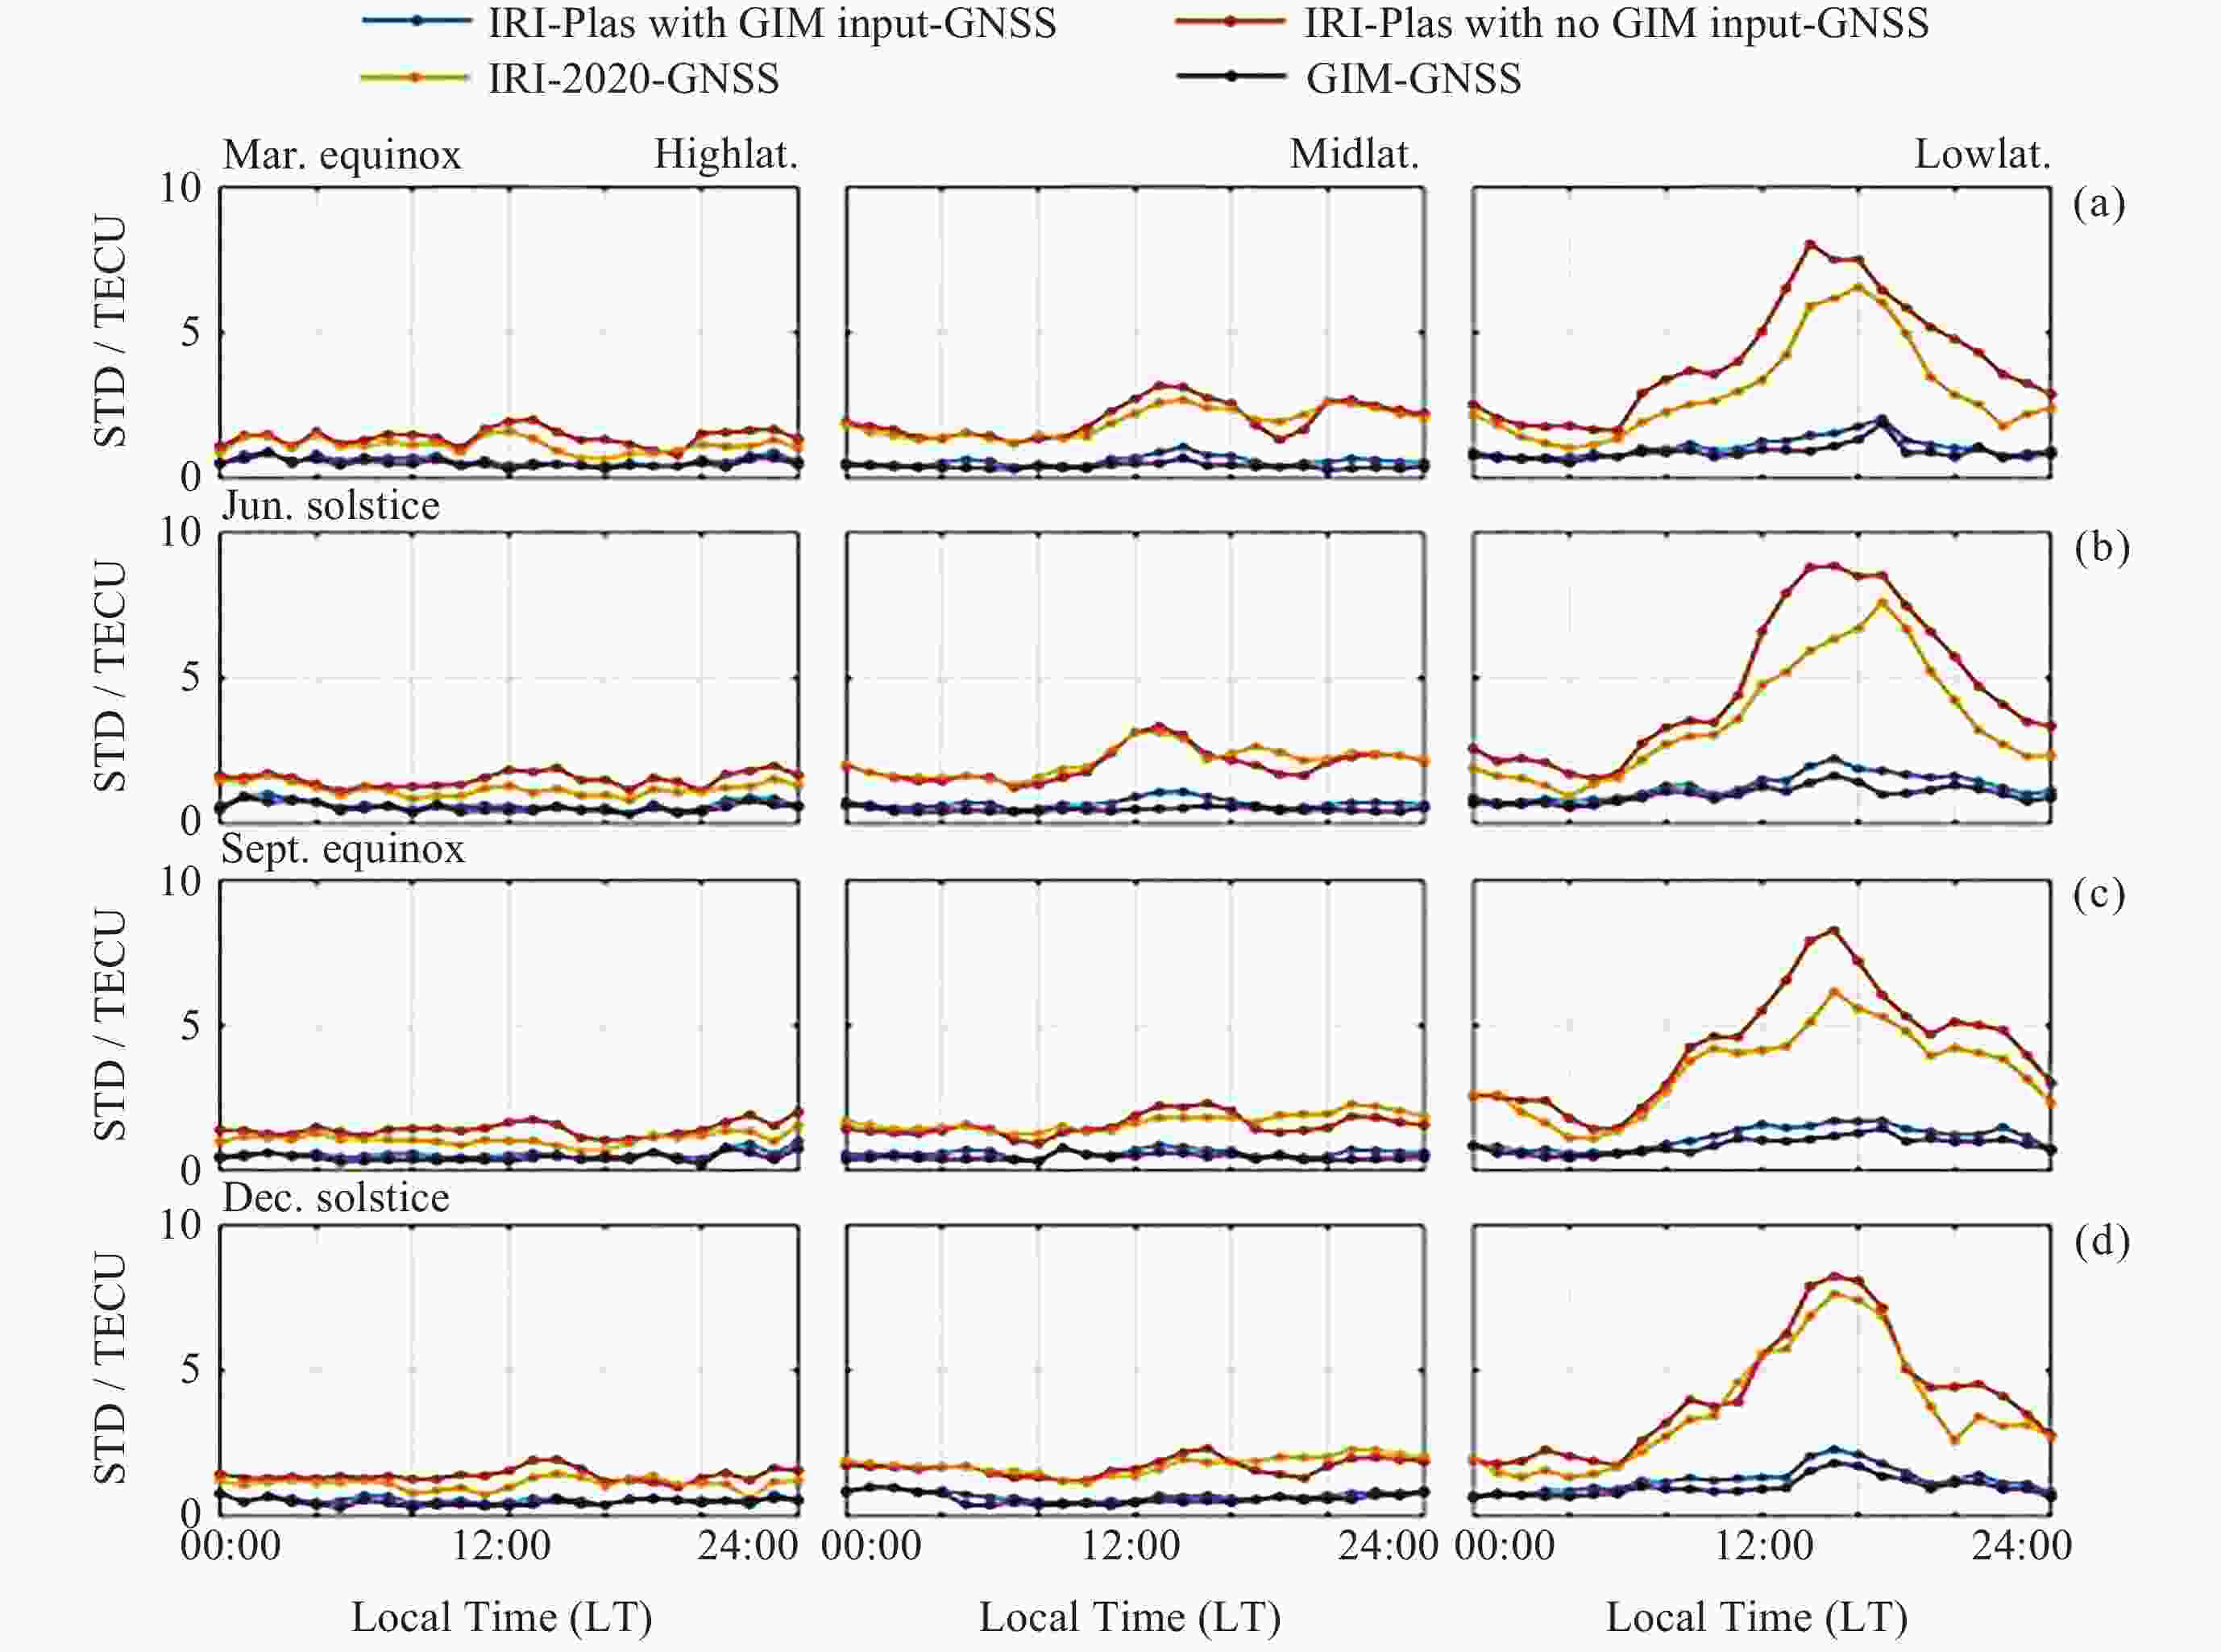
模型 Bias/TECU RMSE/TECU 均值 最大值 最小值 均值 最大值 最小值 IRI-Plas1 1.46 4.11 –0.88 10.22 14.74 7.30 IRI-Plas2 7.30 16.00 2.16 14.94 24.88 9.95 IRI 0.05 5.50 –4.82 11.96 18.39 8.33 注 上角标1表示同化GIM TEC, 上角标2表示未同化外部TEC. 表 2 不同模型与GNSS观测值偏差统计
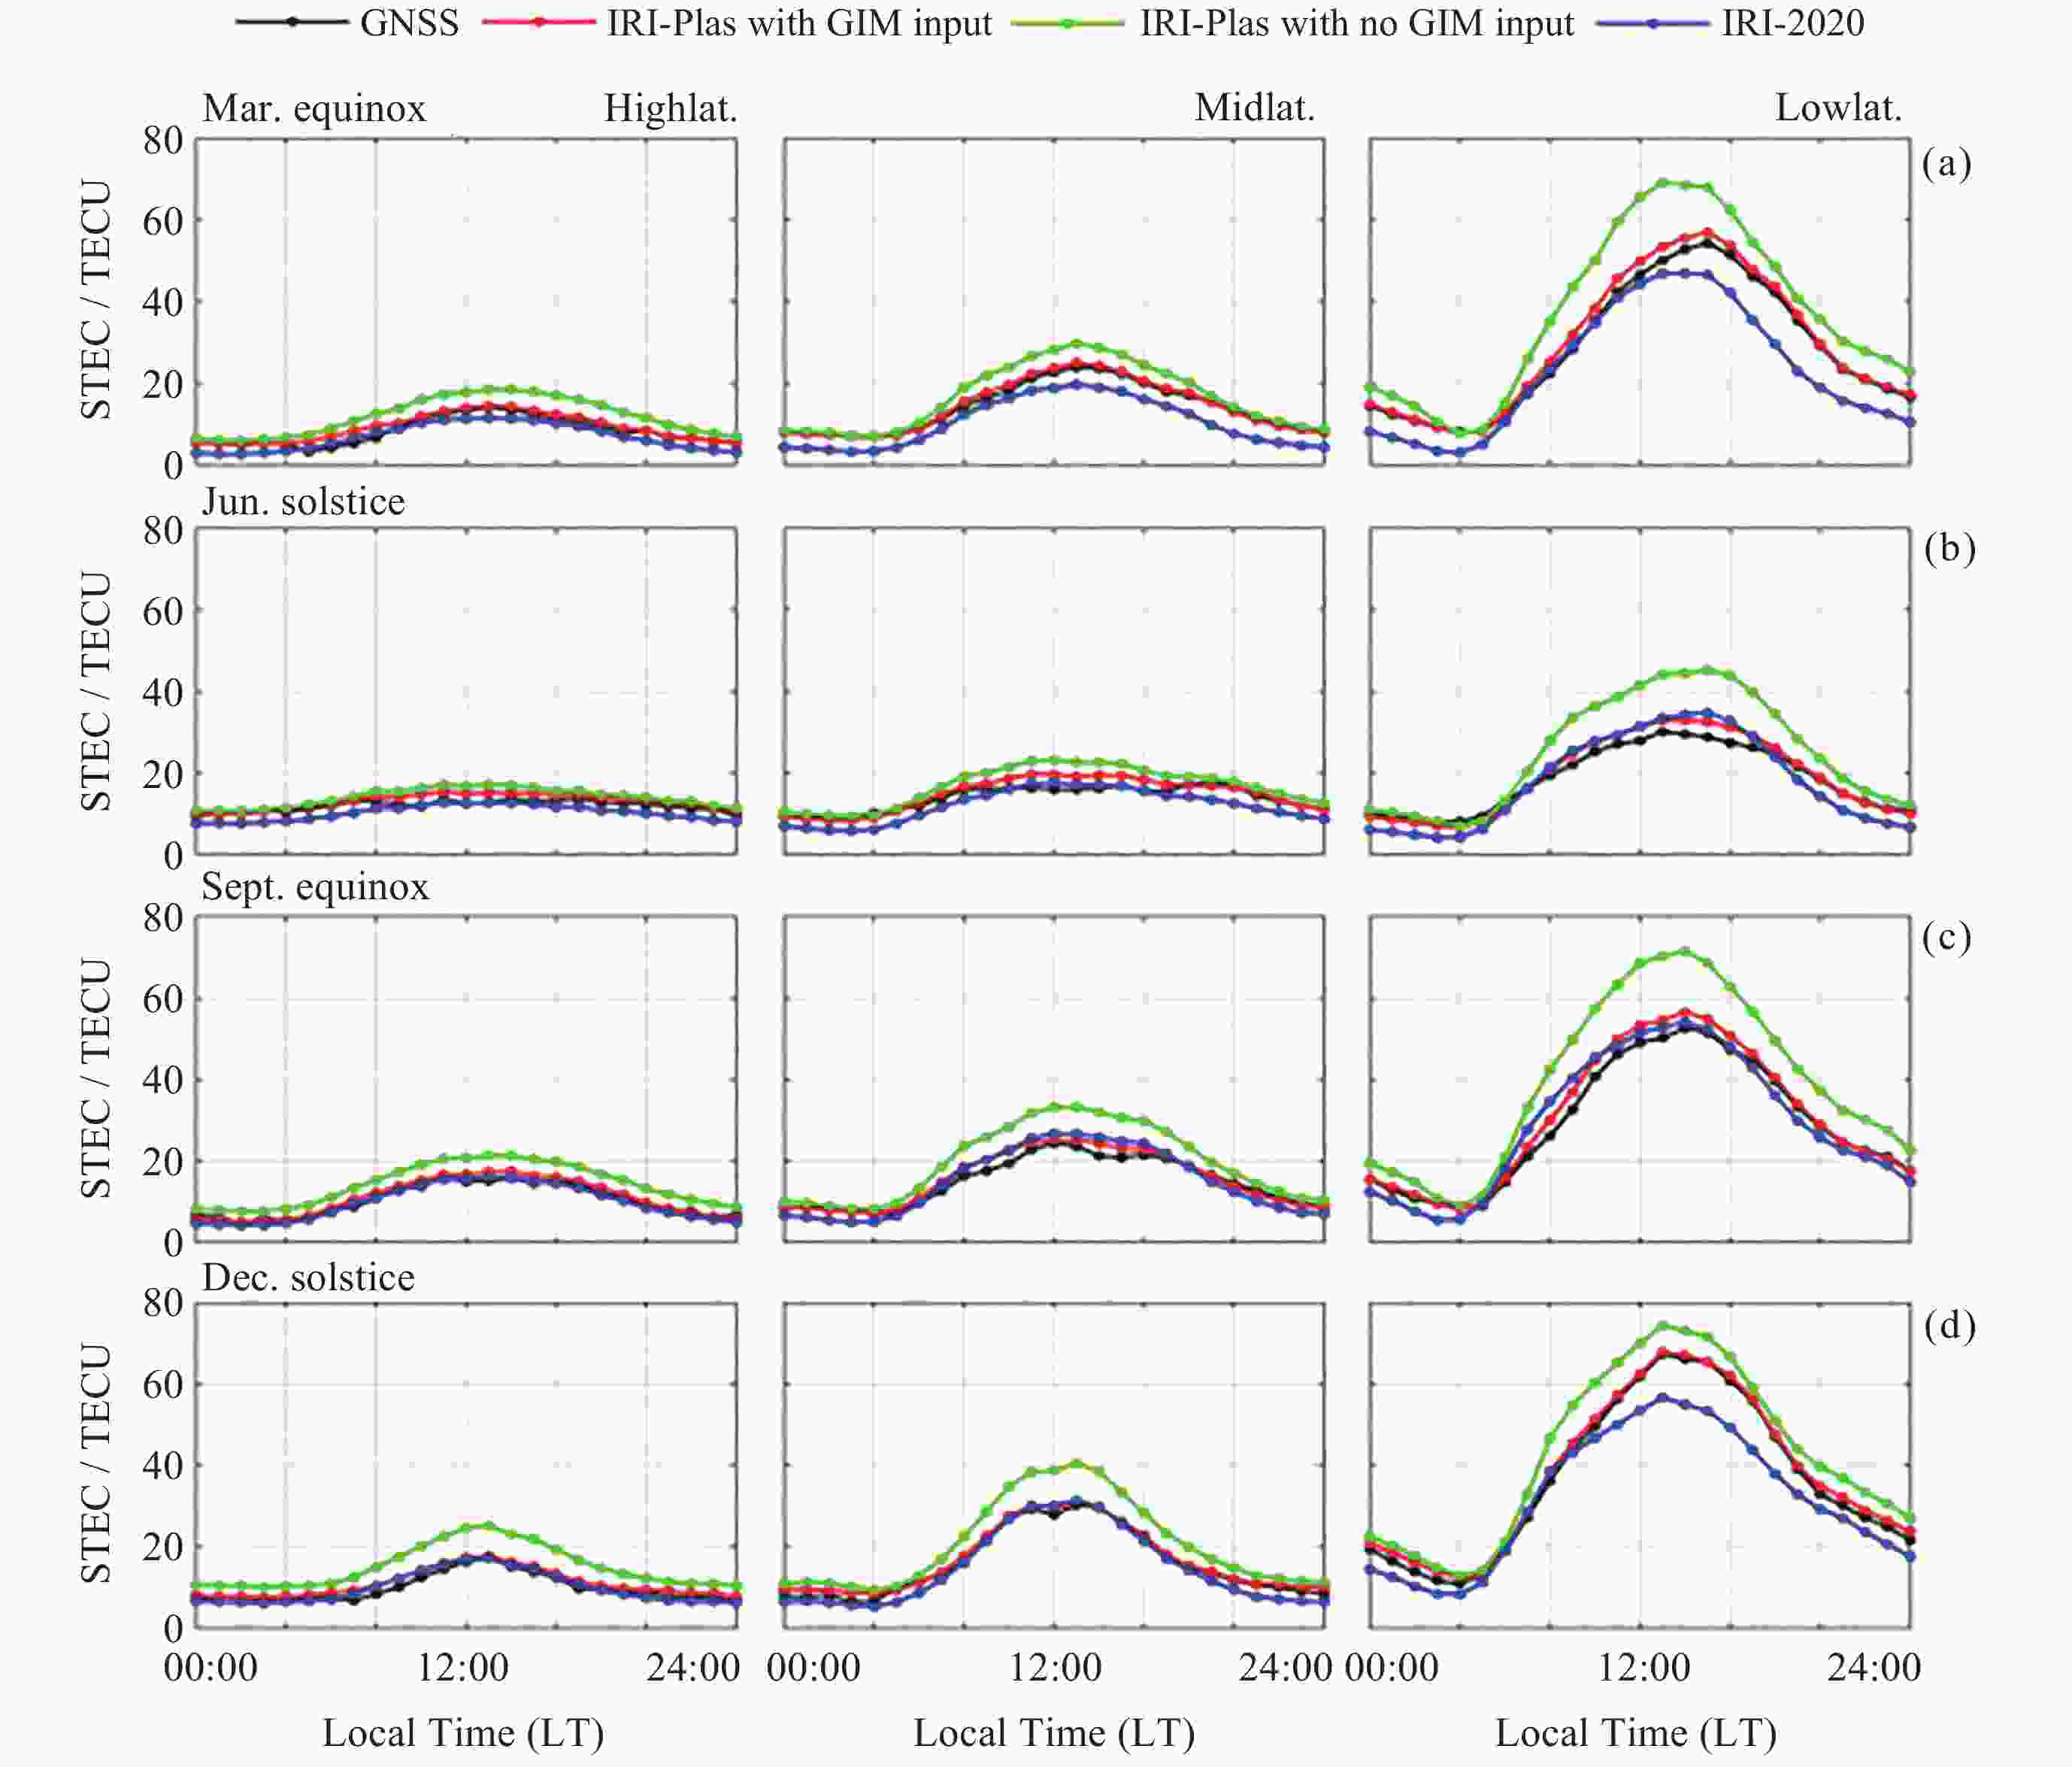
Table 2. Statistical values of the differences in TEC of different ionospheric models
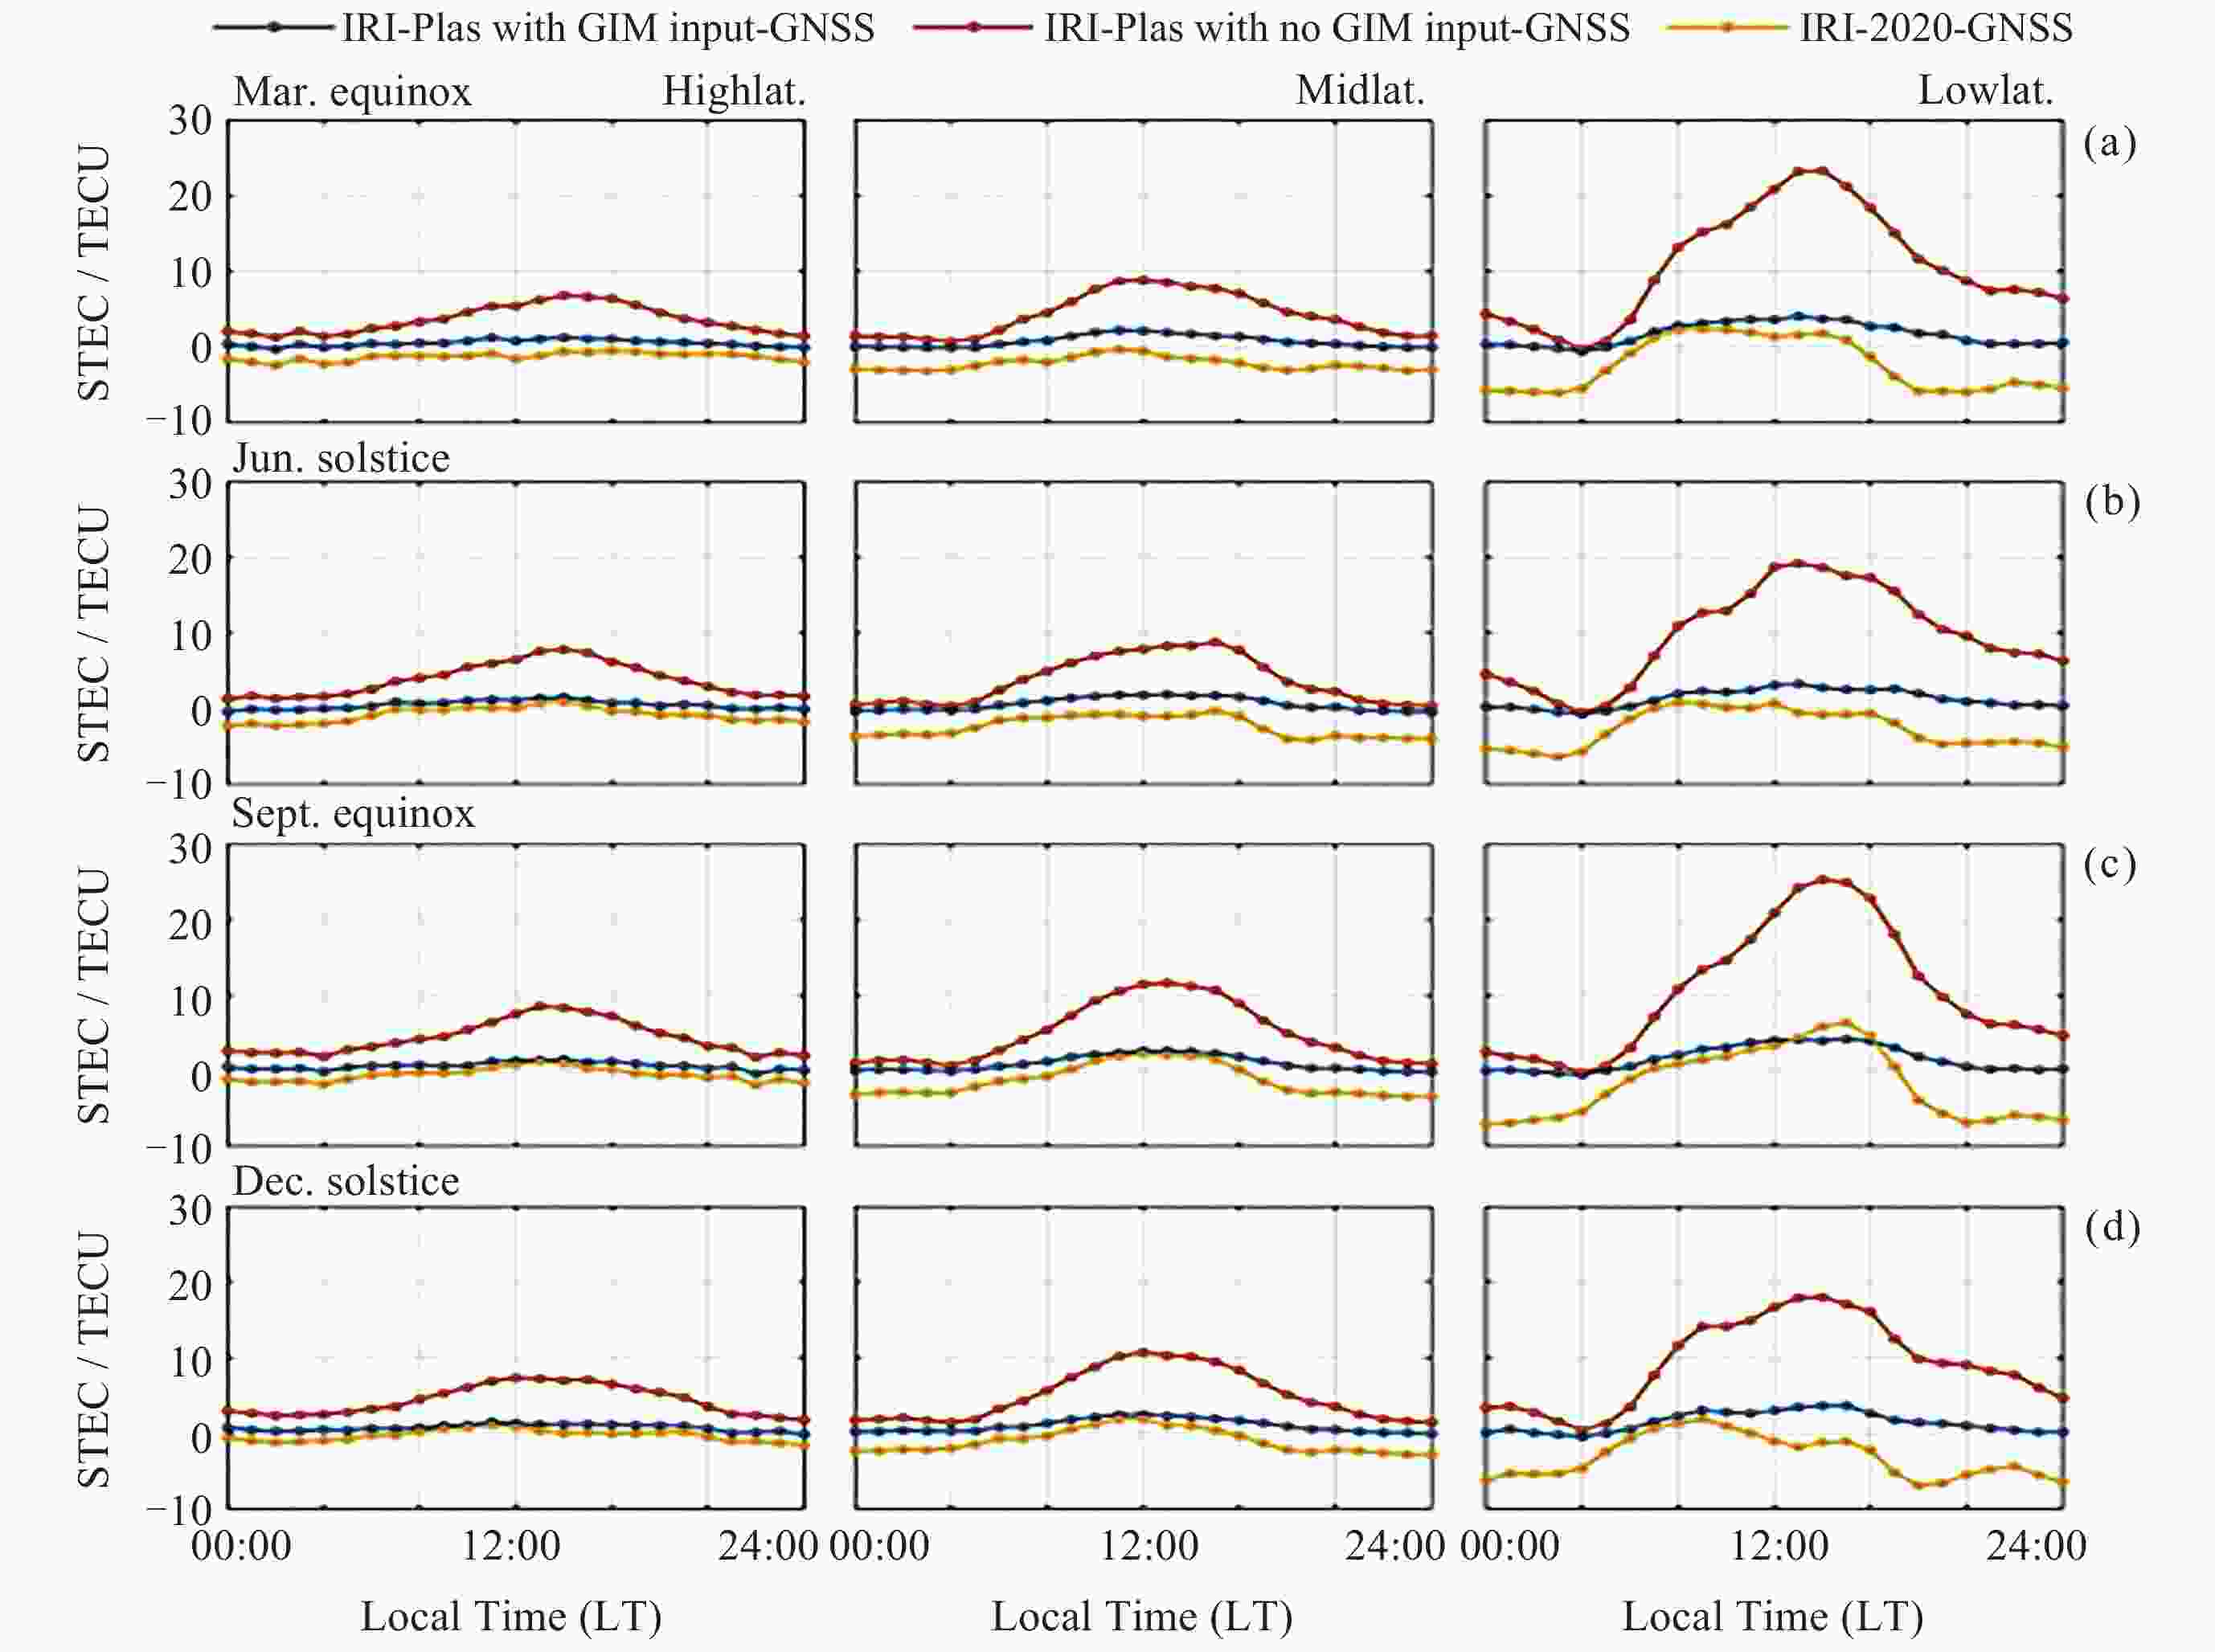
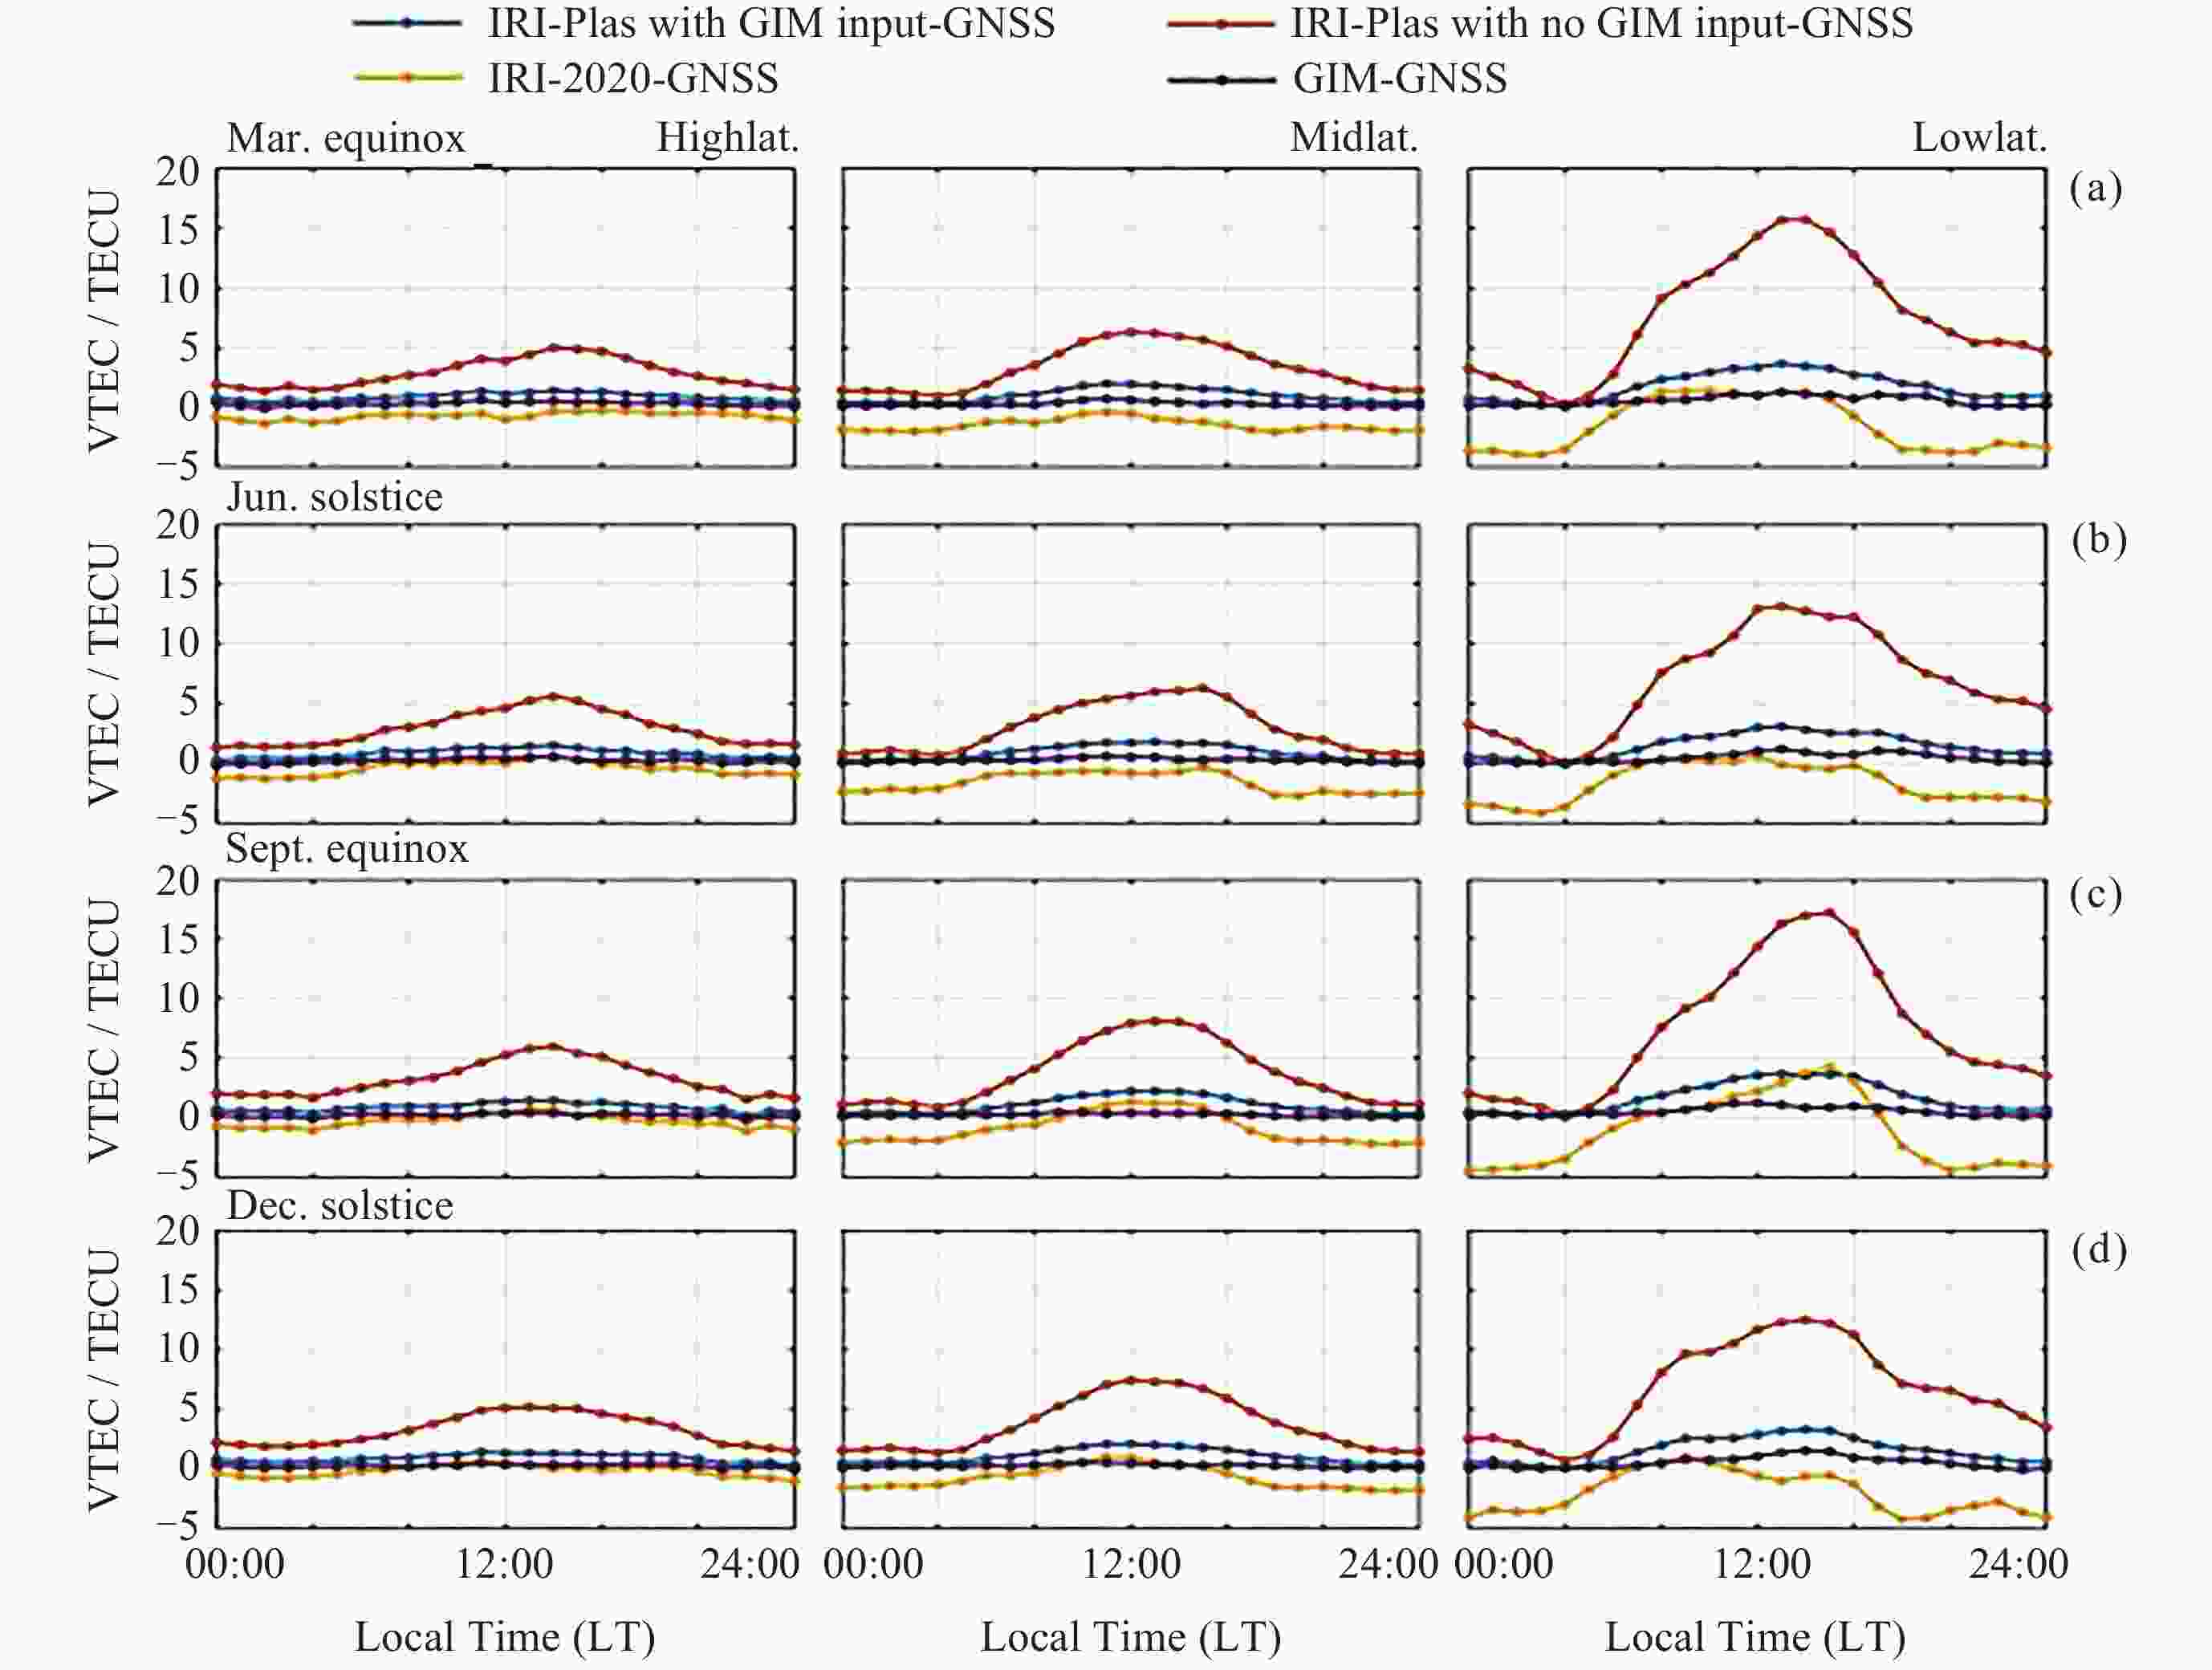
△TEC 分至点 STEC/TECU VTEC/TECU 最大值 最小值 均值 最大值 最小值 均值 IRI-Plas1—GNSS 春分 18.59 –5.47 1.10 12.08 –3.21 1.25 夏至 8.35 –7.70 0.87 6.53 –4.65 1.10 秋分 12.74 –6.34 1.19 10.10 –3.86 1.29 冬至 13.58 –5.19 1.11 9.74 –2.85 1.24 IRI-Plas2—GNSS 春分 53.22 –6.88 6.55 34.90 –4.13 4.77 夏至 52.02 –13.90 5.89 34.79 –8.99 4.35 秋分 52.64 –10.05 6.94 35.16 –5.72 5.02 冬至 42.95 –18.03 6.41 28.55 –11.10 4.69 IRI—GNSS 春分 26.62 –19.54 –2.12 17.38 –11.37 –1.38 夏至 23.81 –26.98 –2.22 15.69 –16.72 –1.45 秋分 27.35 –23.24 –1.33 18.58 –14.51 –0.88 冬至 19.14 –30.69 –1.69 13.31 –20.05 –1.11 注 上角标1表示同化GIM TEC, 上角标2表示未同化外部TEC. 表 3 不同地磁情况下电离层经验模型与GNSS观测值偏差和均方根误差统计
Table 3. Statistical results of the differences between ionospheric empirical models derived from GNSS observations and calculated under different geomagnetic condition
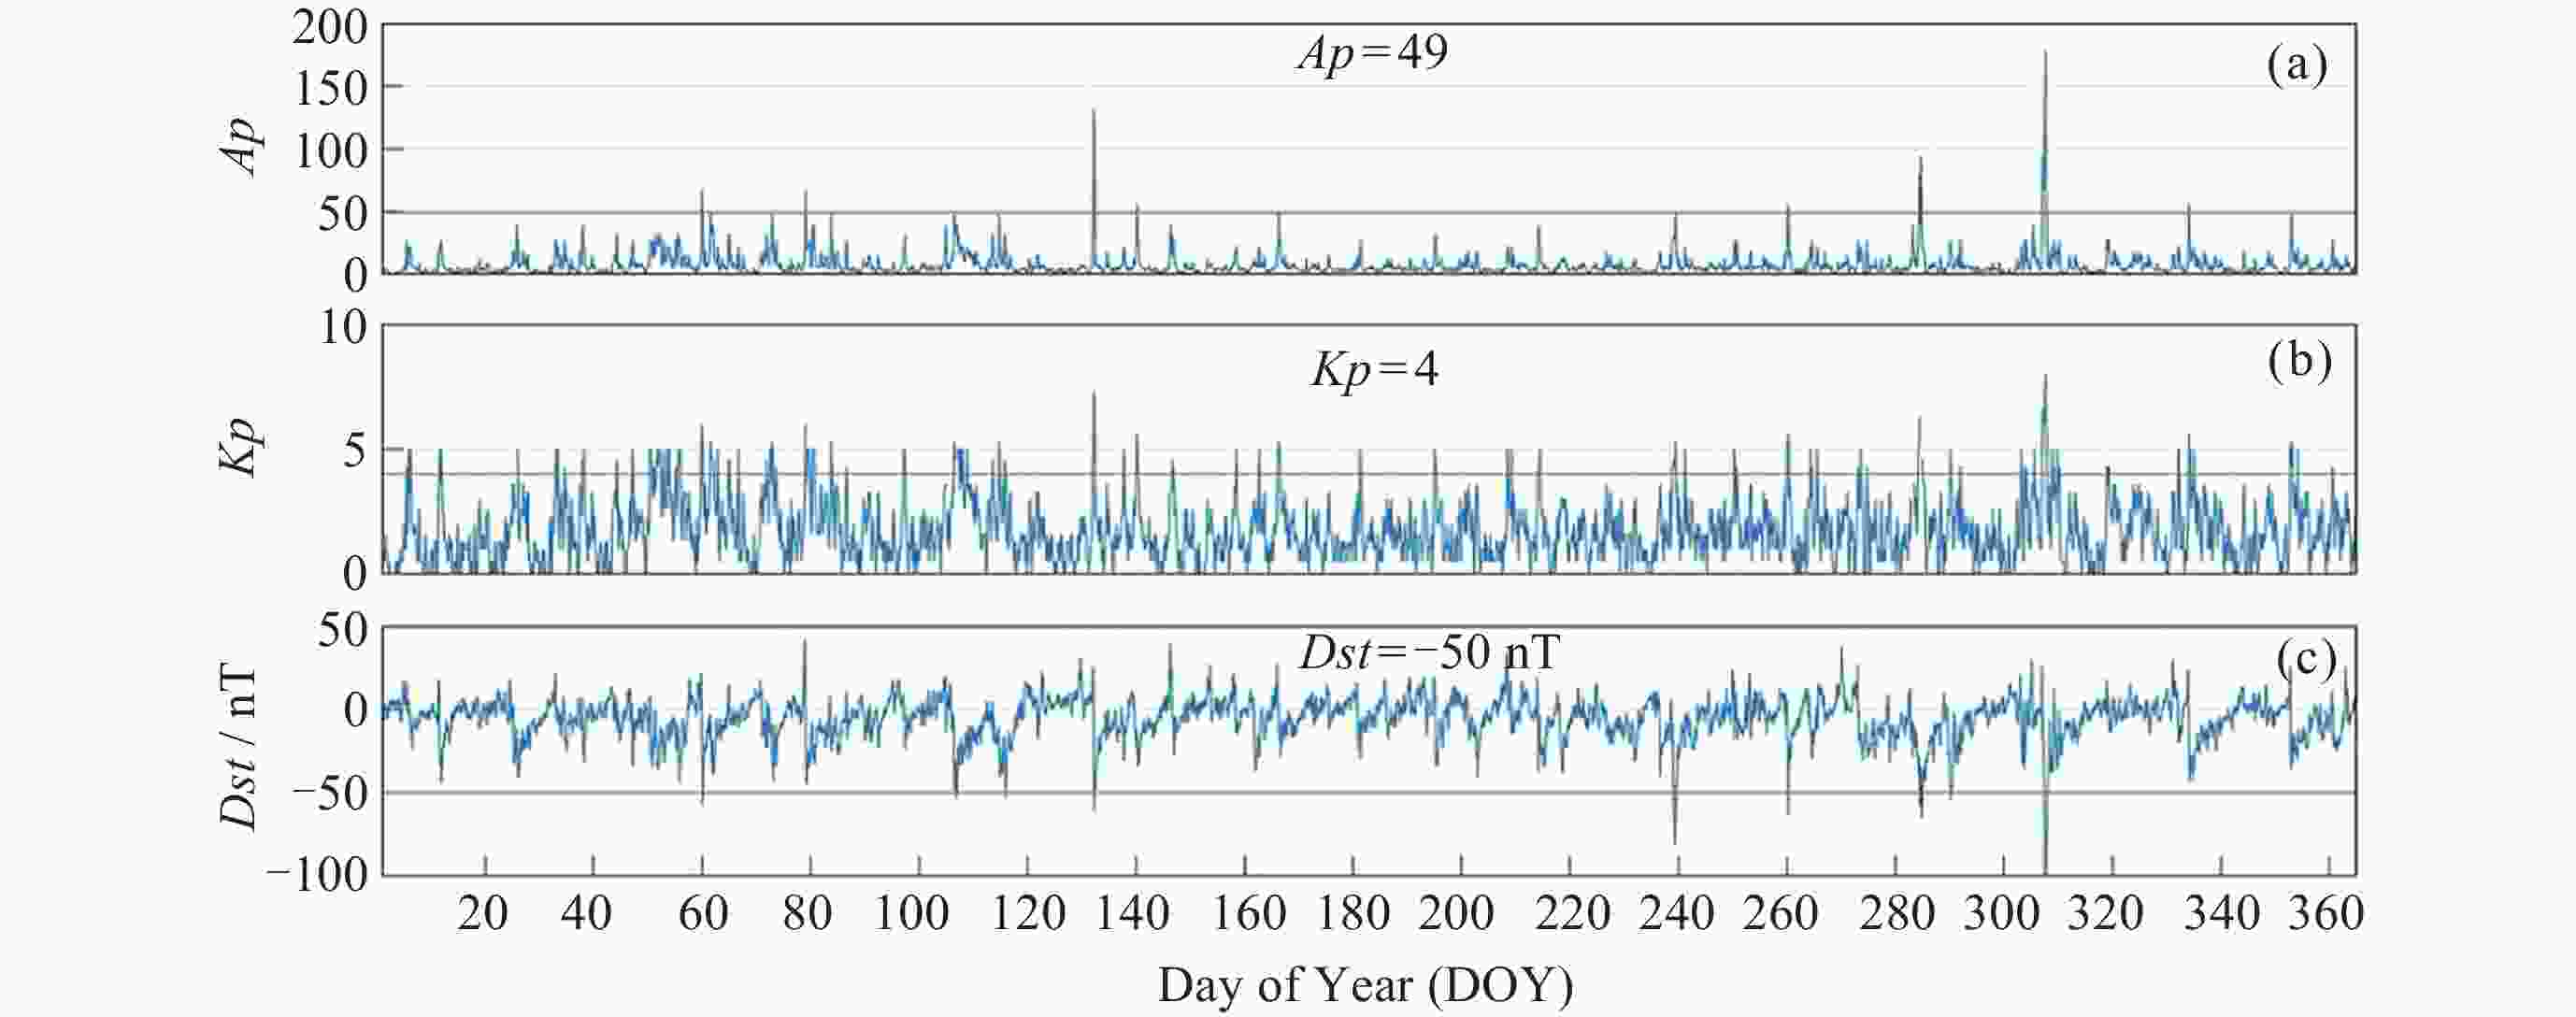
地磁活动 天数 模型 Bias/TECU RMSE/TECU 最大值 最小值 均值 最大值 最小值 均值 地磁平静日 302 IRI-Plas1 4.21 –0.85 1.49 14.70 7.28 10.26 IRI-Plas2 16.48 2.32 7.41 25.33 9.93 15.05 IRI 5.70 –4.62 0.19 18.39 8.50 11.94 地磁活动日 52 IRI-Plas1 3.87 –0.88 1.30 14.73 5.87 9.97 IRI-Plas2 14.75 1.28 6.54 22.88 9.17 14.28 IRI 4.12 –5.69 –0.85 17.93 7.35 11.90 小磁暴日 10 IRI-Plas1 5.07 –1.77 1.49 15.60 5.97 10.09 IRI-Plas2 19.29 2.05 7.82 27.55 8.88 15.32 IRI 6.95 –5.09 0.05 20.08 7.63 12.36 注 上角1表示同化GIM TEC, 上角2表示未同化外部TEC. -
[1] 袁运斌, 霍星亮, 张宝成. 近年来我国GNSS电离层延迟精确建模及修正研究进展[J]. 测绘学报, 2017, 46(10): 1364-1378 doi: 10.11947/j.AGCS.2017.20170349YUAN Yunbin, HUO Xingliang, ZHANG Baocheng. Research progress of precise models and correction for gnss ionospheric delay in China over recent years[J]. Acta Geodaetica et Cartographica Sinica, 2017, 46(10): 1364-1378 doi: 10.11947/j.AGCS.2017.20170349 [2] 聂文锋, 胡伍生, 潘树国, 等. 利用GPS双频数据进行区域电离层TEC提取[J]. 武汉大学学报·信息科学版, 2014, 39(9): 1022-1027NIE Wenfeng, HU Wusheng, PAN Shuguo, et al. Extraction of regional ionospheric TEC from GPS dual observation[J]. Geomatics and Information Science of Wuhan University, 2014, 39(9): 1022-1027 [3] BILITZA D, REINISCH B W, RADICELLA S M, et al. Improvements of the International Reference Ionosphere model for the topside electron density profile[J]. Radio Science, 2006, 41(5): RS5S15 [4] BILITZA D, BROWN S A, WANG M Y, et al. Measurements and IRI model predictions during the recent solar minimum[J]. Journal of Atmospheric and Solar-Terrestrial Physics, 2012, 86: 99-106 doi: 10.1016/j.jastp.2012.06.010 [5] BILITZA D, ALTADILL D, TRUHLIK V, et al. International Reference Ionosphere 2016: from ionospheric climate to real-time weather predictions[J]. Space Weather, 2017, 15(2): 418-429 doi: 10.1002/2016SW001593 [6] BILITZA D, PEZZOPANE M, TRUHLIK V, et al. The international reference ionosphere model: a review and description of an ionospheric benchmark[J]. Reviews of Geophysics, 2022, 60(4): e2022RG000792 doi: 10.1029/2022RG000792 [7] GULYAEVA T L, STANISLWSKA I, TOMASIK M. Ionospheric weather: cloning missed f0F2 observations for derivation of variability index[J]. Annales Geophysicae, 2008, 26(2): 315-321 doi: 10.5194/angeo-26-315-2008 [8] GULYAEVA T L, ARIKAN F, STANISLAWSKA I. Inter-hemispheric imaging of the ionosphere with the upgraded IRI-Plas model during the space weather storms[J]. Earth, Planets and Space, 2011, 63(8): 929-939 doi: 10.5047/eps.2011.04.007 [9] SHUBIN V N, GULYAEVA T L. Global mapping of total electron content from GNSS observations for updating IRI-Plas model[J]. Advances in Space Research, 2022, 69(1): 168-175 doi: 10.1016/j.asr.2021.09.032 [10] ADEBIYI S J, ADIMULA I A, OLADIPO O A, et al. Assessment of IRI and IRI-Plas models over the African equatorial and low-latitude region[J]. Journal of Geophysical Research: Space Physics, 2016, 121(7): 7287-7300 doi: 10.1002/2016JA022697 [11] CHEN B Y, WU L X, DAI W J, et al. A new parameterized approach for ionospheric tomography[J]. GPS Solutions, 2019, 23(4): 96 doi: 10.1007/s10291-019-0893-4 [12] OGWALA A, SOMOYE E O, PANDA S K, et al. Total electron content at equatorial and low-, middle- and high-latitudes in African longitude sector and its comparison with IRI-2016 and IRI-PLAS 2017 models[J]. Advances in Space Research, 2021, 68(5): 2160-2176 doi: 10.1016/j.asr.2020.07.013 [13] LIU J L, JIA X L, ZHU Y X, et al. Comparing GNSS TEC data from the African continent with IRI-2016, IRI-Plas, and NeQuick predictions[J]. Advances in Space Research, 2022, 69(7): 2852-2864 doi: 10.1016/j.asr.2022.01.008 [14] ATICI R. Comparison of GPS TEC with modelled values from IRI 2016 and IRI-PLAS over Istanbul, Turkey[J]. Astrophysics and Space Science, 2018, 363(11): 231 doi: 10.1007/s10509-018-3457-0 [15] ARIKAN F, SHUKUROV S, TUNA H, et al. Performance of GPS slant total electron content and IRI-Plas-STEC for days with ionospheric disturbance[J]. Geodesy and Geodynamics, 2016, 7(1): 1-10 doi: 10.1016/j.geog.2015.12.009 [16] 李博峰, 葛海波, 沈云中. 无电离层组合、Uofc和非组合精密单点定位观测模型比较[J]. 测绘学报, 2015, 44(7): 734-740 doi: 10.11947/j.AGCS.2015.20140161LI Bofeng, GE Haibo, SHEN Yunzhong. Comparison of Ionosphere-free, Uofc and uncombined PPP observation models[J]. Acta Geodaetica et Cartographica Sinica, 2015, 44(7): 734-740 doi: 10.11947/j.AGCS.2015.20140161 [17] REN X D, ZHANG X H, XIE W L, et al. Global ionospheric modelling using multi-GNSS: BeiDou, Galileo, GLONASS and GPS[J]. Scientific Reports, 2016, 6: 33499 doi: 10.1038/srep33499 [18] 张小红, 李星星, 李盼. GNSS精密单点定位技术及应用进展[J]. 测绘学报, 2017, 46(10): 1399-1407 doi: 10.11947/j.AGCS.2017.20170327ZHANG Xiaohong, LI Xingxing, LI Pan. Review of GNSS PPP and its application[J]. Acta Geodaetica et Cartographica Sinica, 2017, 46(10): 1399-1407 doi: 10.11947/j.AGCS.2017.20170327 [19] 周锋. 多系统GNSS非差非组合精密单点定位相关理论和方法研究[D]. 上海: 华东师范大学, 2018ZHOU Feng. Theory and Methodology of Multi-GNSS Undifferenced and Uncombined Precise Point Positioning[D]. Shanghai: East China Normal University, 2018 [20] ZHOU F, DONG D N, LI W W, et al. GAMP: an open-source software of multi-GNSS precise point positioning using undifferenced and uncombined observations[J]. GPS Solutions, 2018, 22(2): 33 doi: 10.1007/s10291-018-0699-9 [21] 朱军桃, 刘玉升, 林知宇, 等. 2018-08-25~29期间全球电离层TEC对地磁暴的响应分析[J]. 大地测量与地球动力学, 2022, 42(7): 661-668,674ZHU Juntao, LIU Yusheng, LIN Zhiyu, et al. Response analysis of global ionospheric TEC to geomagnetic storms from August 25~29, 2018[J]. Journal of Geodesy and Geodynamics, 2022, 42(7): 661-668,674 [22] 蔡昌盛, 高井祥, 李征航. 利用GPS监测电离层总电子含量的季节性变化[J]. 武汉大学学报·信息科学版, 2006, 31(5): 451-453,465CAI Changsheng, GAO Jingxiang, LI Zhenghang. Monitoring seasonal variations of ionospheric TEC using GPS measurements[J]. Geomatics and Information Science of Wuhan University, 2006, 31(5): 451-453,465 [23] 陈亚楠, 徐继生. 顶部电离层离子密度经度结构的特征及其随季节、太阳活动和倾角的变化[J]. 地球物理学报, 2015, 58(6): 1843-1852 doi: 10.6038/cjg20150601CHEN Yanan, XU Jisheng. Longitudinal structure of plasma density and its variations with season, solar activity and dip in the topside ionosphere[J]. Chinese Journal of Geophysics, 2015, 58(6): 1843-1852 doi: 10.6038/cjg20150601 [24] REN Z P, WAN W X, LIU L B, et al. Longitudinal variations of electron temperature and total ion density in the sunset equatorial topside ionosphere[J]. Geophysical Research Letters, 2008, 35(5): L05108 [25] 尹汇民, 孔建, 安家春, 等. 2017年9月强磁暴及引发的电离层扰动[J]. 地球物理学进展, 2021, 36(1): 96-104 doi: 10.6038/pg2021DD0484YIN Huimin, KONG Jian, AN Jiachun, et al. Strong geomagnetic storm and induced ionospheric disturbance in September 2017[J]. Progress in Geophysics, 2021, 36(1): 96-104 doi: 10.6038/pg2021DD0484 -
-


 金俐君 女, 1999年7月出生于湖北省荆门市, 硕士毕业于中南大学地球科学与信息物理学院, 主要研究方向为电离层建模. E-mail:

 下载:
下载:
