


全日面机器学习耀斑业务预报
doi: 10.11728/cjss2025.01.2024-0021 cstr: 32142.14.cjss.2024-0021
-
 李铭 男, 1997年5月出生于河北省张家口市, 现为中国科学院国家空间科学中心特别研究助理, 主要研究方向为深度学习在太阳爆发预报建模中的应用. E-mail: liming01@nssc.ac.cn
 -
 崔延美 女, 1980年1月出生于山东省德州市, 现为中国科学院国家空间科学中心副研究员, 硕士生导师, 主要研究方向为空间环境预报、空间灾害性天气事件建模与预报等. E-mail: ymcui@nssc.ac.cn
作者简介:
通讯作者:
Machine Learning Solar Full Disk Flare Operational Forecasting
-
摘要: 太阳耀斑预报是空间环境预报中的一项重要内容. 目前所构建的深度学习耀斑预报模型大都是基于活动区磁图构建的. 受到投影效应的影响, 这类模型仅能对太阳中心区域的活动区进行预报, 难以满足全日面耀斑业务预报的需求. 基于太阳活动传统参量, 研究统计了活动区磁类型、面积, 耀斑爆发历史以及F10.7与耀斑发生的关系, 利用全连接神经网络构建了适用于全日面活动区的太阳耀斑业务预报模型, 该模型可以预报未来48 h内活动区≥M级耀斑的爆发情况. 该模型与已往搭建的深度学习预报模型进行比较, 结果表明本文建立的业务预报模型预报性能略优. 同时, 结果表明投影效应对本研究搭建的耀斑预报模型影响不大. 该模型为耀斑业务预报提供了有效工具.Abstract: Solar flare forecasting is an essential component in space environment forecasting. Most of the deep learning flare forecasting models constructed are based on the magnetograms of active regions. Affected by the projection effect, these models can only forecast the active region in the center of the Sun. It is difficult to meet the need of operational flare forecasting of the solar full disk. Based on the traditional solar activity parameters, in this study, the relationships between the magnetic type of the active region, area of the active region, the history of the flare outburst, the 10 cm radio flux and flares from January 1996 to December 2022 were statistically analyzed. By using the fully connected neural network, an operational flare forecasting model for solar full disk active regions was constructed. This model can forecast the eruption of the M-class or above flares of the full solar disk active regions in the next 48 h. The F1 score of the model is 0.4304, the TSS is 0.3689, and the HSS is 0.3906. The model is compared with the deep learning flare forecasting model constructed in the previous work, and the results show that the operational forecasting model constructed in this paper has a better forecasting performance. Meanwhile, in order to explore the influence of the projection effect, the solar full disk active regions flare forecasting model constructed was tested for test data within 30 degrees from the center of the solar disk, within the interval from 30 degrees to 60 degrees, and over 60 degrees, respectively. The results show that the projection effect has little influence on the flare forecast model constructed in this study. The model can be used to forecast flare in the active region of the full solar disk, and provide an effective tool for operational solar flare forecasting.
-
Key words:
- Flare /
- Operational forecasting /
- Machine learning /
- Solar full disk active regions
-

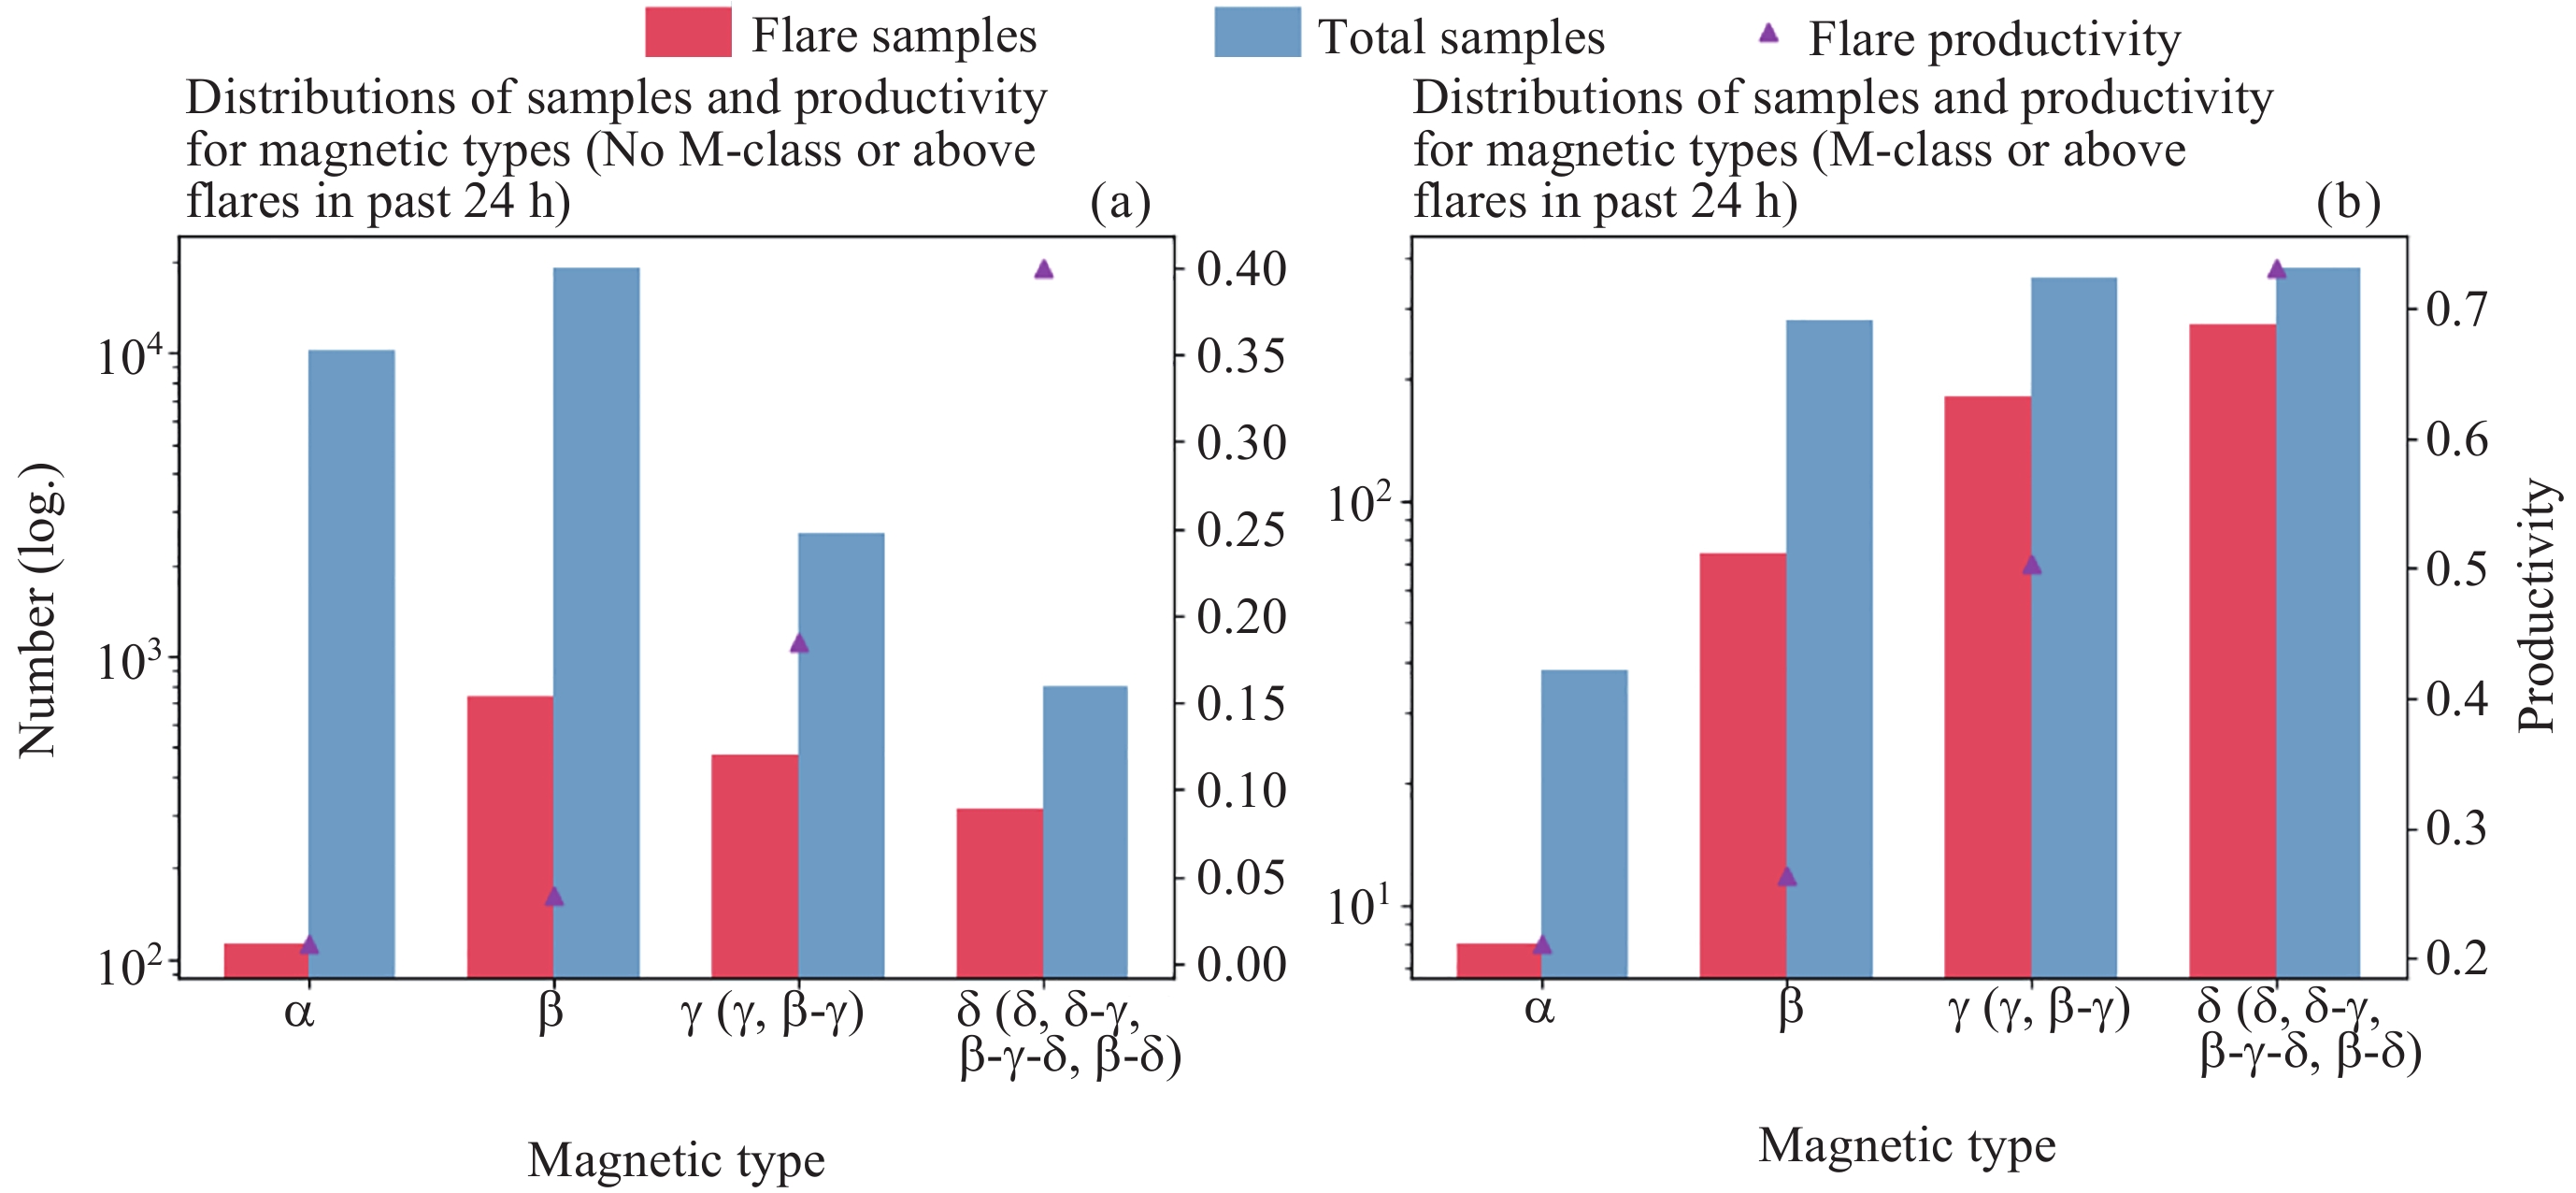
图 1 考虑耀斑爆发历史的活动区磁类型与耀斑爆发的统计关系
Figure 1. Statistical relationship considering the history of flare eruptions between the magnetic types of active regions and flares

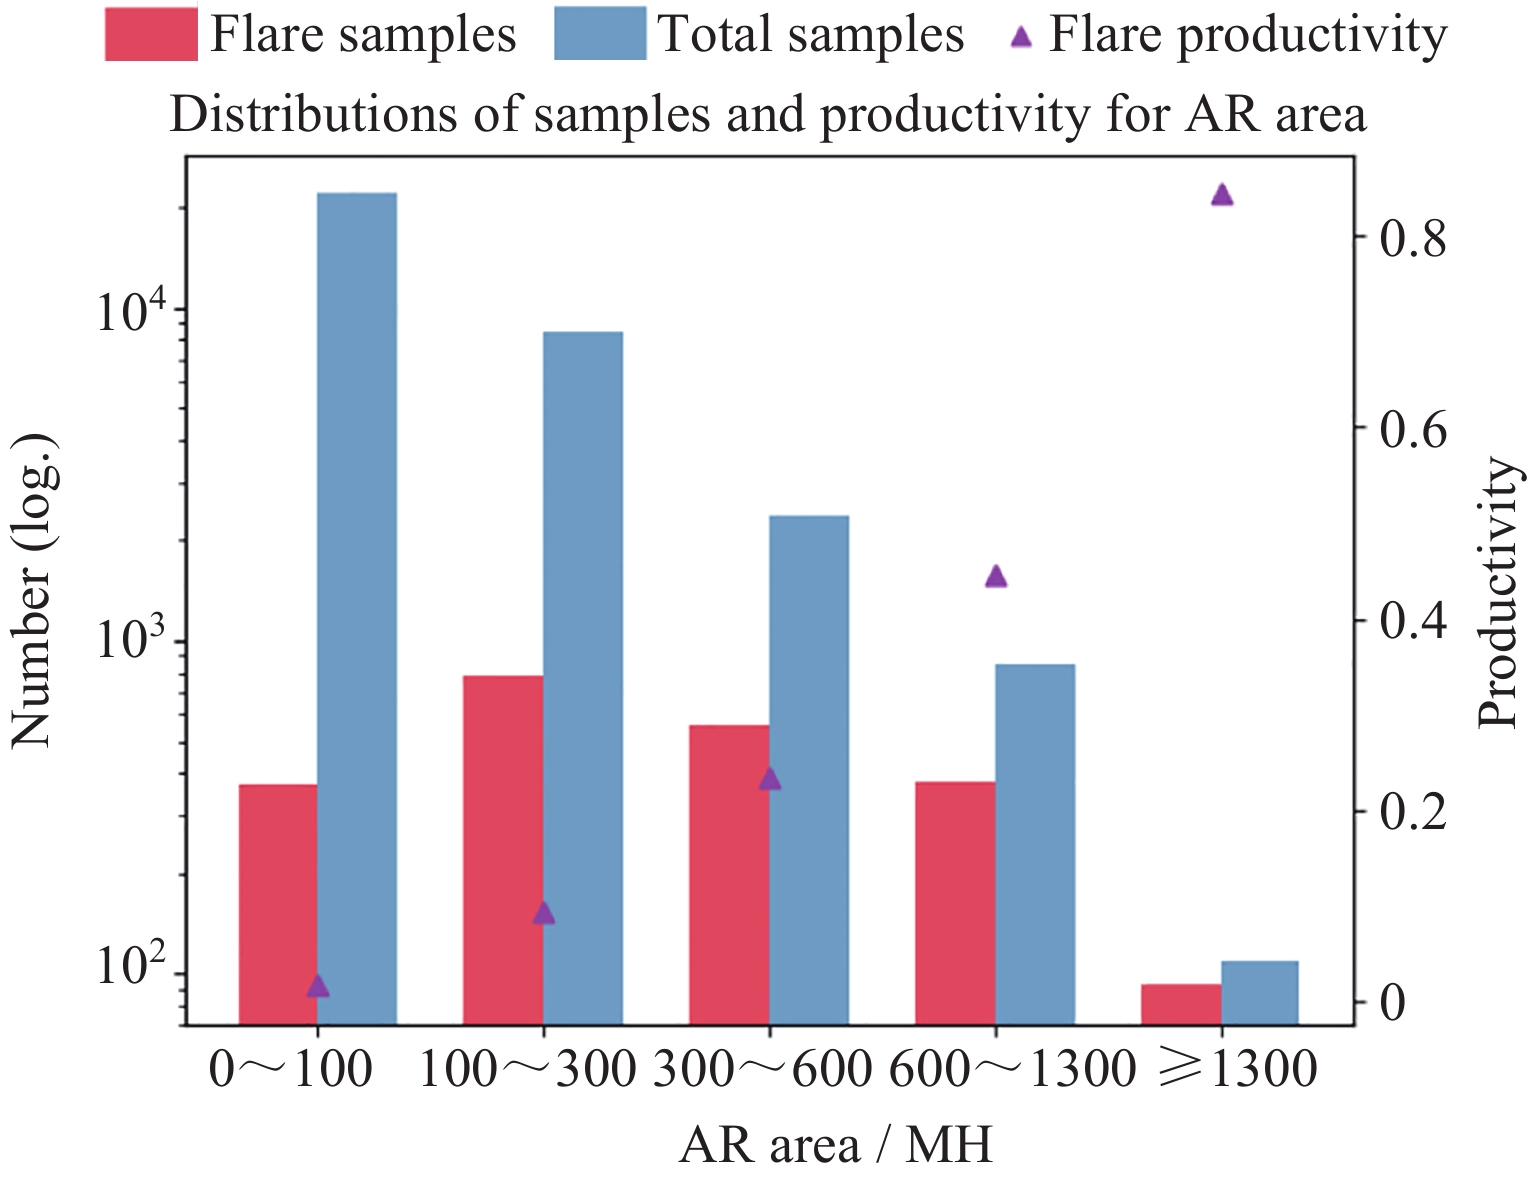
图 2 活动区面积与耀斑爆发的统计关系
Figure 2. Statistical relationship between the area of Active Regions (ARs) and flares

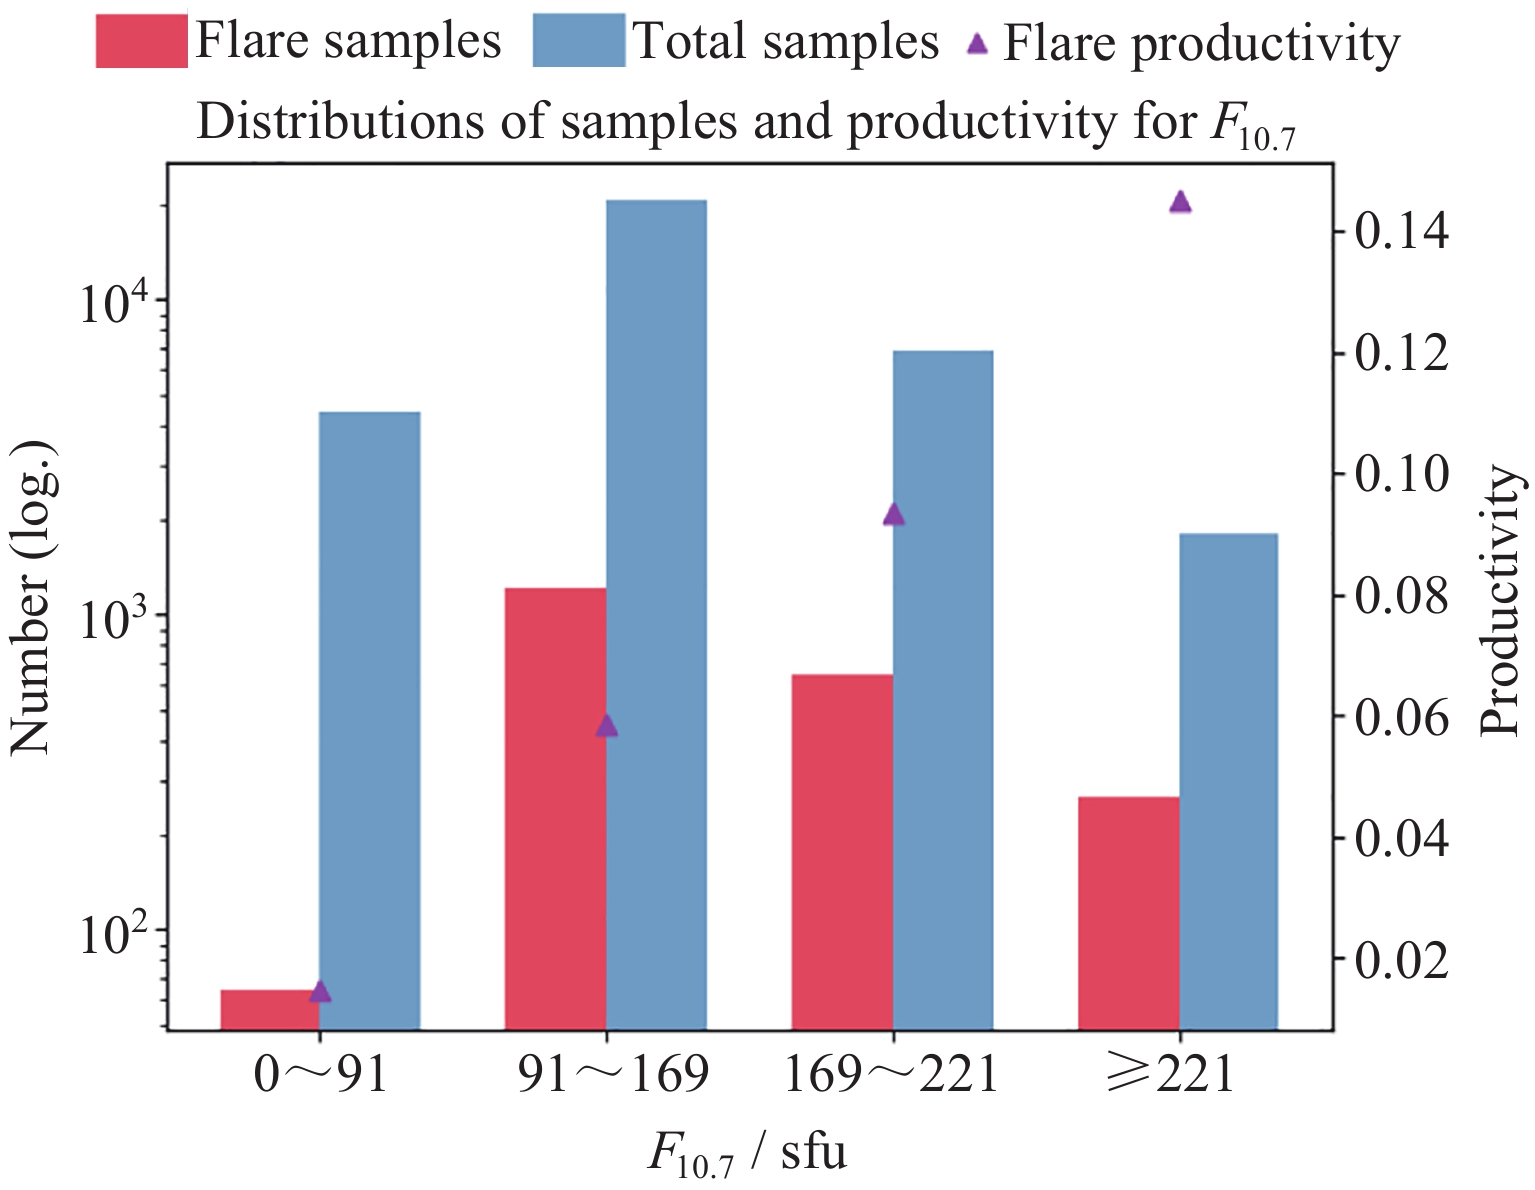
图 3 F10.7指数与耀斑爆发的统计关系
Figure 3. Statistical relationship between F10.7 index and flares

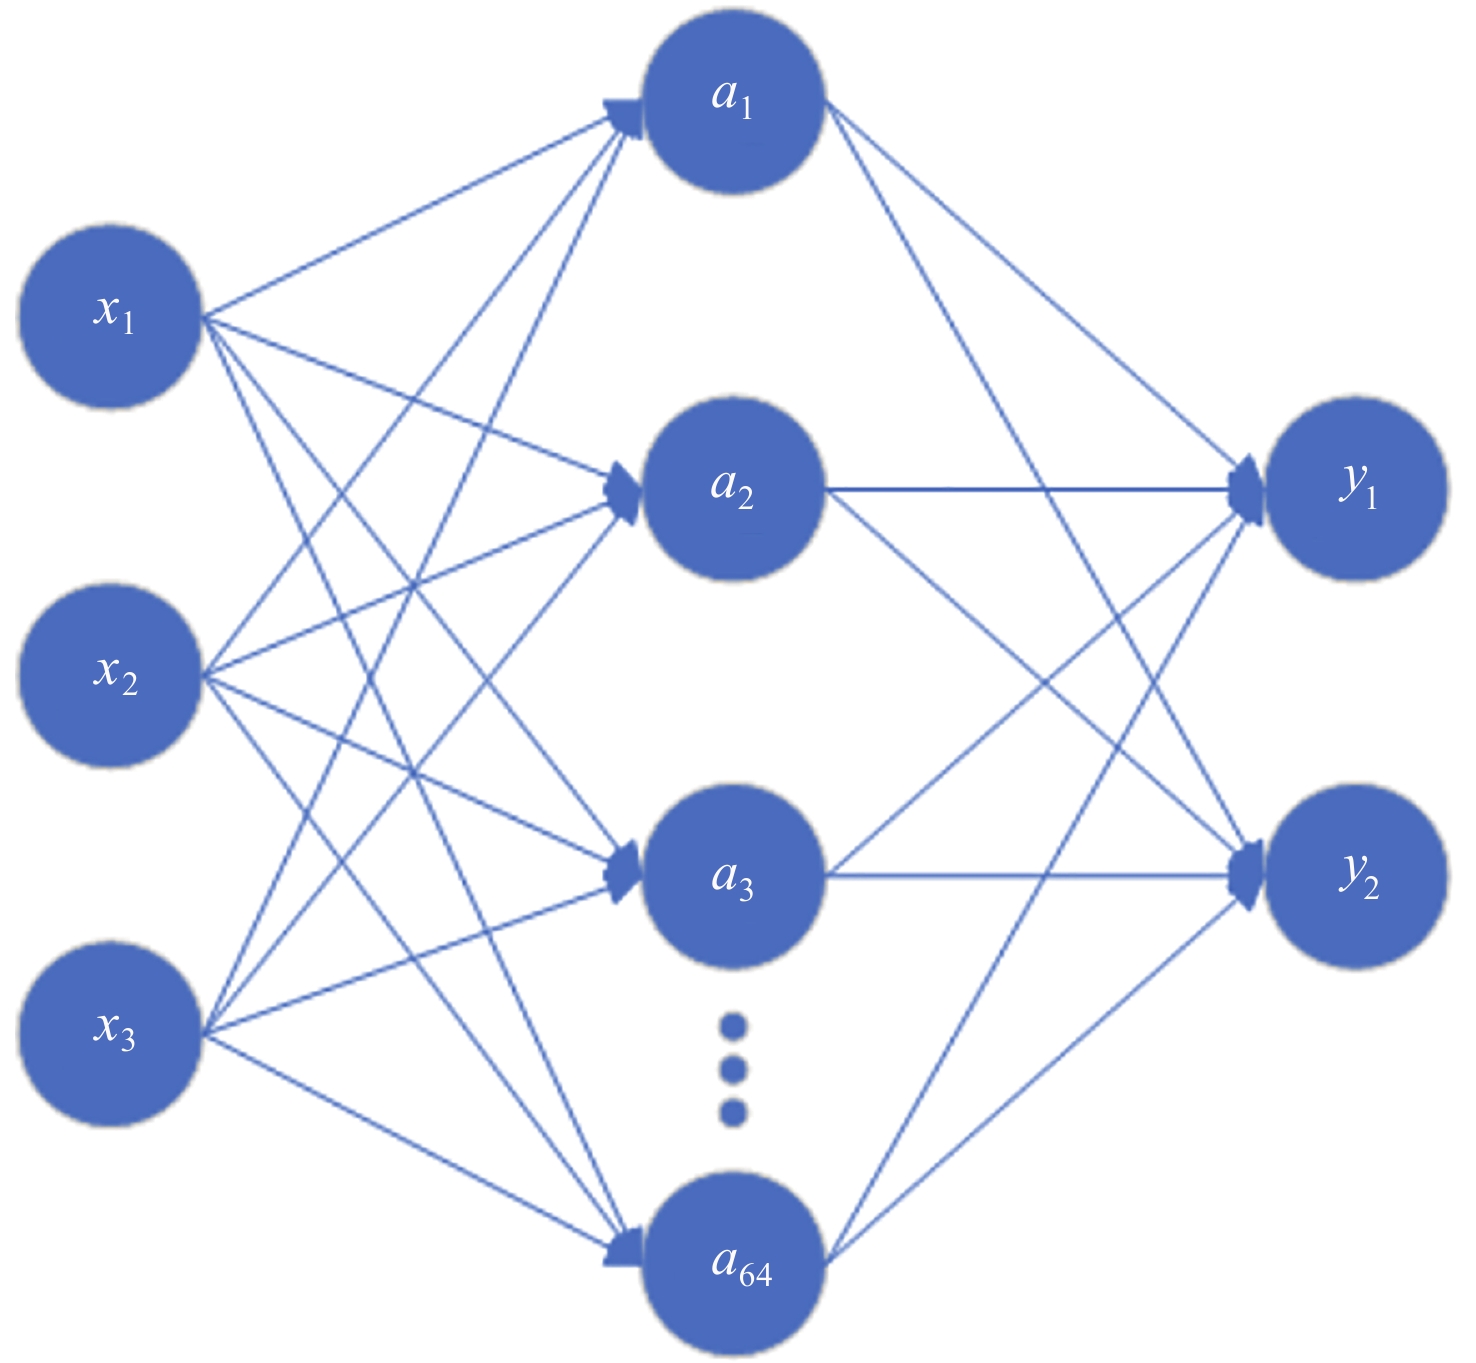
图 4 全连接神经网络结构. 该网络由输入层、隐藏层和输出层组成. $ {x}_{1} $~$ {x}_{3} $表示网络的三个输入参量, $ {a}_{1} $~$ {a}_{64} $表示神经网络隐藏层中的64个神经元, $ {y}_{1} $和$ {y}_{2} $表示网络的两个输出
Figure 4. Structure of fully connected neural network. The network consists of input, hidden and output layers. x1~x3 denote the three input parameters of the network, $ {a}_{1} $~$ {a}_{64} $ denote the 64 neurons in the hidden layer of the neural network, and $ {y}_{1} $ and $ {y}_{2} $ denote the two outputs of the network
表 1 考虑耀斑爆发历史后的活动区磁类型与耀斑爆发的统计关系
Table 1. Statistical relationship between the magnetic types of active regions and flares considering the history of flare eruptions
磁类型 过去24 h内未
爆发≥M级耀斑过去24 h内
爆发≥M级耀斑总样本数 耀斑样本数 耀斑发生率 总样本数 耀斑样本数 耀斑发生率 α 10275 112 0.0109 38 8 0.2105 β 19008 743 0.0391 281 74 0.2633 γ (γ, β-γ) 2559 472 0.1844 357 180 0.5042 δ (δ, δ-γ, β-γ-δ, β-δ) 791 316 0.3995 375 274 0.7307  下载: 导出CSV
表 2 活动区面积与耀斑爆发的统计关系
Table 2. Statistical relationship between the area of active regions and flares
面积/MH 总样本数 耀斑样本数 耀斑发生率 0~100 21979 368 0.0167 100~300 8397 788 0.0938 300~600 2354 553 0.2349 600~1300 845 378 0.4473 ≥1300 109 92 0.8440
下载: 导出CSV
表 3 F10.7指数与耀斑爆发的统计关系
Table 3. Statistical relationship between F10.7 index and flares
F10.7/sfu 总样本数 耀斑样本数 耀斑发生率 0~91 4386 64 0.0146 91~169 20602 1211 0.0588 169~221 6849 640 0.0934 ≥221 1821 264 0.1450
下载: 导出CSV
表 4 数据集分布情况
Table 4. Distribution of data sets
训练集 验证集 测试集 耀斑样本数 1484 350 581 非耀斑样本数 20836 5388 7752 总样本数 22320 5738 8333
下载: 导出CSV
表 5 全连接神经网络超参数设置
Table 5. Hyperparameter settings for fully connected neural networks
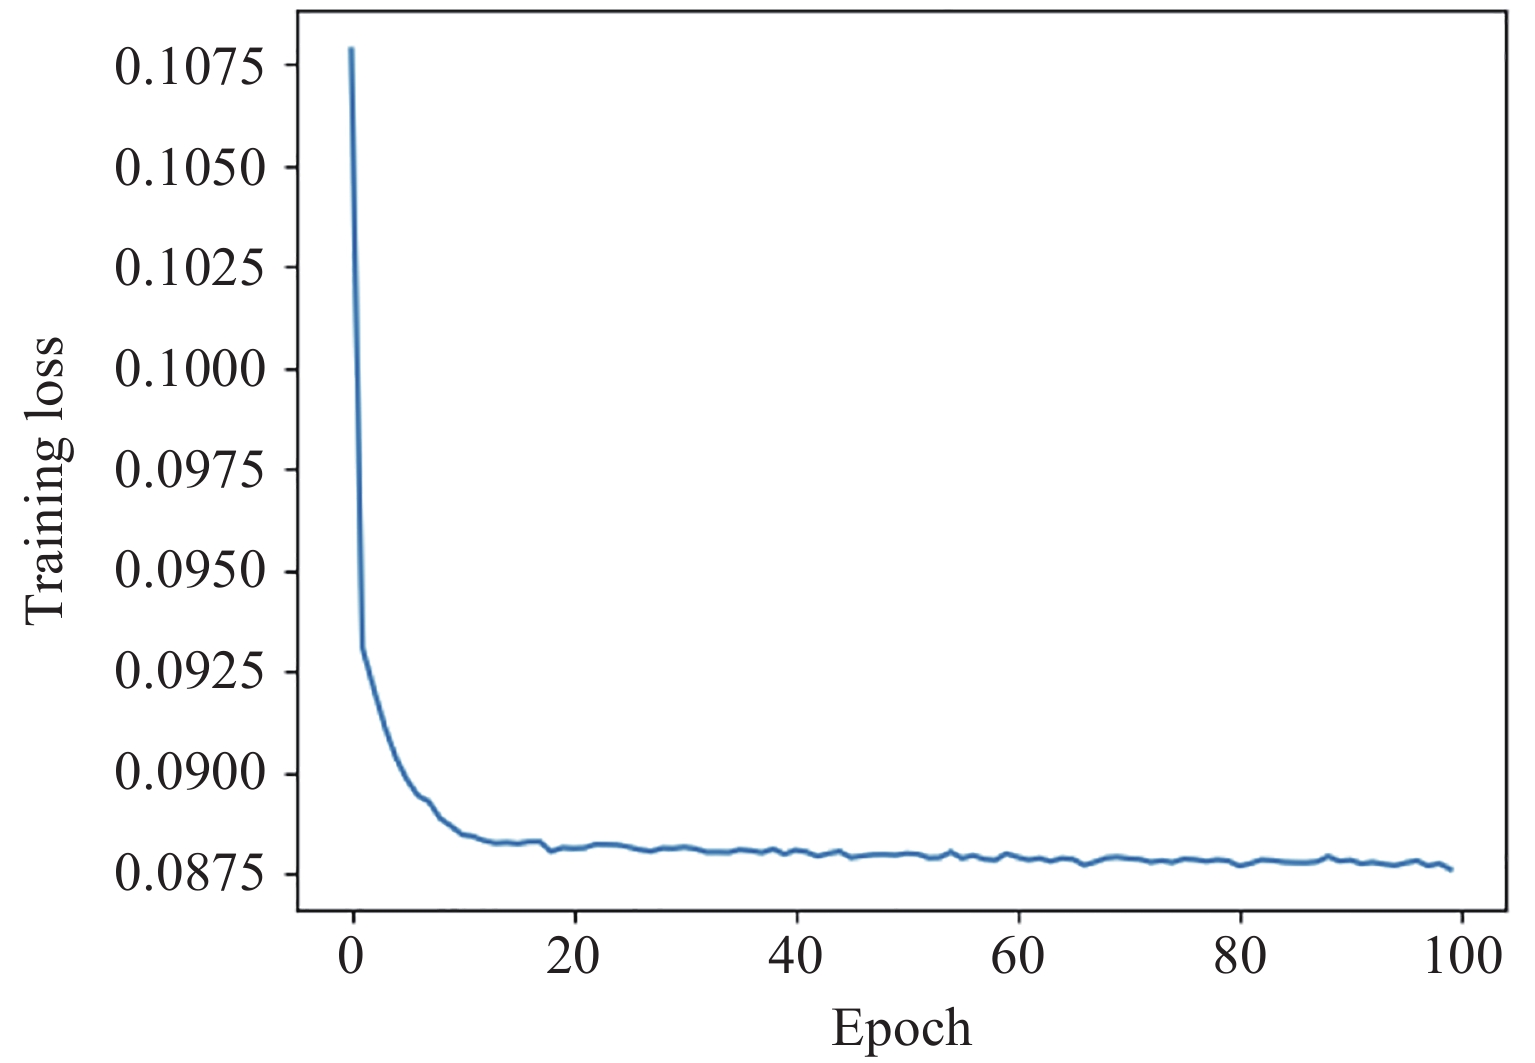
超参数名称 设置值 Epoch 100 隐藏层数量 1 隐藏层中神经元数量 64 优化算法 Adam 隐藏层激活函数 Relu 输出层激活函数 Sigmoid 损失函数 二元交叉熵
下载: 导出CSV
表 6 全日面活动区预报模型的二分类混淆矩阵
Table 6. Binary confusion matrices for active region forecasting models of the full solar disk
预测 观测 真 假 真 235 ($ {N}_{\mathrm{T}\mathrm{P}} $) 346 ($ {N}_{\mathrm{F}\mathrm{P}} $) 假 276 ($ {N}_{\mathrm{F}\mathrm{N}} $) 7476 ($ {N}_{\mathrm{T}\mathrm{N}} $)
下载: 导出CSV
表 7 评价指标及其对应得分
Table 7. Evaluation metrics and corresponding scores
评价
指标计算公式 预报
模型F1
分数$ \dfrac{2 P\times R}{P+R} $ 0.4304 P $ \dfrac{{N}_{\mathrm{T}\mathrm{P}}}{{N}_{\mathrm{T}\mathrm{P}}+{N}_{\mathrm{F}\mathrm{P}}} $ 0.4599 R $ \dfrac{{N}_{\mathrm{T}\mathrm{P}}}{{N}_{\mathrm{T}\mathrm{P}}+{N}_{\mathrm{F}\mathrm{N}}} $ 0.4045 ACC $ \dfrac{{N}_{\mathrm{T}\mathrm{P}}+{N}_{\mathrm{T}\mathrm{N}}}{{N}_{\mathrm{T}\mathrm{P}}+{N}_{\mathrm{F}\mathrm{P}}+{N}_{\mathrm{F}\mathrm{N}}+{N}_{\mathrm{T}\mathrm{N}}} $ 0.9245 CSI $ \dfrac{{N}_{\mathrm{T}\mathrm{P}}}{{N}_{\mathrm{T}\mathrm{P}}+{N}_{\mathrm{F}\mathrm{P}}+{N}_{\mathrm{F}\mathrm{N}}} $ 0.2472 FAR $ \dfrac{{N}_{\mathrm{F}\mathrm{P}}}{{N}_{\mathrm{T}\mathrm{P}}+{N}_{\mathrm{F}\mathrm{P}}} $ 0.5401 TSS $ \dfrac{{N}_{\mathrm{T}\mathrm{P}}}{{N}_{\mathrm{T}\mathrm{P}}+{N}_{\mathrm{F}\mathrm{N}}}-\dfrac{{N}_{\mathrm{F}\mathrm{P}}}{{N}_{\mathrm{F}\mathrm{P}}+{N}_{\mathrm{T}\mathrm{N}}} $ 0.3689 HSS $ \dfrac{2[\left({N}_{\mathrm{T}\mathrm{P}}\times {N}_{\mathrm{T}\mathrm{N}}\right)-\left({N}_{\mathrm{F}\mathrm{N}}\times {N}_{\mathrm{F}\mathrm{P}}\right)]}{({N}_{\mathrm{T}\mathrm{P}}+{N}_{\mathrm{F}\mathrm{N}})({N}_{\mathrm{F}\mathrm{N}}+{N}_{\mathrm{T}\mathrm{N}})+({N}_{\mathrm{T}\mathrm{P}}+{N}_{\mathrm{F}\mathrm{P}})({N}_{\mathrm{F}\mathrm{P}}+{N}_{\mathrm{T}\mathrm{N}})} $ 0.3906
下载: 导出CSV
表 8 模型预报性能比较
Table 8. Comparison of model forecast performance
指标 LO≤30° 30°<LO≤60° LO>60° $ {N}_{\mathrm{T}\mathrm{P}} $ 93 88 54 $ {N}_{\mathrm{F}\mathrm{P}} $ 114 126 106 $ {N}_{\mathrm{F}\mathrm{N}} $ 138 96 42 $ {N}_{\mathrm{T}\mathrm{N}} $ 3122 2680 1674 F1分数 0.4247 0.4422 0.4219
下载: 导出CSV
表 9 相同数据源模型预报性能比较
Table 9. Comparison of model forecast performance in the same data source
指标 Fusion model 2 全日面活动区模型 $ {N}_{\mathrm{T}\mathrm{P}} $ 16 19 $ {N}_{\mathrm{F}\mathrm{P}} $ 32 40 $ {N}_{\mathrm{F}\mathrm{N}} $ 57 54 $ {N}_{\mathrm{T}\mathrm{N}} $ 800 792 F1分数 0.2645 0.2879 P 0.3333 0.3220 R 0.2192 0.2603 ACC 0.9017 0.8961 CSI 0.1524 0.1681 FAR 0.6667 0.6780 TSS 0.1807 0.2122 HSS 0.2142 0.2325
下载: 导出CSV
-
[1] LI M, CUI Y M, LUO B X, et al. Knowledge-informed deep neural networks for solar flare forecasting[J]. Space Weather, 2022, 20(8): e2021SW002985 doi: 10.1029/2021SW002985 [2] WOODS T N, KOPP G, CHAMBERLIN P C. Contributions of the solar ultraviolet irradiance to the total solar irradiance during large flares[J]. Journal of Geophysical Research: Space Physics, 2006, 111(A10): A10S14 [3] HUANG X, WANG H N, XU L, et al. Deep learning based solar flare forecasting model. I. results for line-of-sight magnetograms[J]. The Astrophysical Journal, 2018, 856(1): 7 doi: 10.3847/1538-4357/aaae00 [4] 李蓉, 黄鑫. 一种黑子特征自动提取的太阳耀斑模型[J]. 中国科学: 物理学 力学 天文学, 2018, 48 (11): 119601LI Rong, HUANG Xin. Solar flare forecasting model based on automatic feature extraction of sunspots[J]. Scientia Sinica Physica, Mechanica & Astronomica, 2018, 48 (11): 119601 [5] NISHIZUKA N, SUGIURA K, KUBO Y, et al. Deep Flare Net (DeFN) model for solar flare prediction[J]. The Astrophysical Journal, 2018, 858(2): 113 doi: 10.3847/1538-4357/aab9a7 [6] LIU H, LIU C, WANG J T L, et al. Predicting solar flares using a long short-term memory network[J]. The Astrophysical Journal, 2019, 877(2): 121 doi: 10.3847/1538-4357/ab1b3c [7] SUN H, MANCHESTER W, JIAO Z B, et al. Interpreting LSTM prediction on solar flare eruption with time-series clustering[OL]. arXiv preprint arXiv: 1912.12360, 2019 [8] CHEN Y, MANCHESTER W B, HERO A O, et al. Identifying solar flare precursors using time series of SDO/HMI images and SHARP parameters[J]. Space Weather, 2019, 17(10): 1404-1426 doi: 10.1029/2019SW002214 [9] GUASTAVINO S, MARCHETTI F, BENVENUTO F, et al. Implementation paradigm for supervised flare forecasting studies: a deep learning application with video data[J]. Astronomy & Astrophysics, 2022, 662: A105 [10] LI M, CUI Y M, LUO B X, et al. Deep neural networks of solar flare forecasting for complex active regions[J]. Frontiers in Astronomy and Space Sciences, 2023, 10: 1177550 doi: 10.3389/fspas.2023.1177550 [11] MILLER R W. WOLF—A computer expert system for sunspot classification and solar flare prediction[M]//HECK A, MURTAGH F. Knowledge-Based Systems in Astronomy. Berlin, Heidelberg: Springer, 1989 [12] 李蓉, 崔延美. 结合支持向量机和近邻法的太阳耀斑预报方法[J]. 计算机工程与设计, 2009, 30(15): 3605-3607,3611LI Rong, CUI Yanmei. Solar flare forecasting method of combining support vector machine with nearest neighbors[J]. Computer Engineering and Design, 2009, 30(15): 3605-3607,3611 [13] SHAUN BLOOMFIELD D, HIGGINS P A, JAMES MCATEER R T, et al. Toward reliable benchmarking of solar flare forecasting methods[J]. The Astrophysical Journal Letters, 2012, 747(2): L41 doi: 10.1088/2041-8205/747/2/L41 [14] 周志华. 机器学习[M]. 北京: 清华大学出版社, 2016ZHOU Zhihua. Machine Learning[M]. Beijing: Tsinghua University Press, 2016 [15] ROSENBLATT F. The perceptron: a probabilistic model for information storage and organization in the brain[J]. Psychological Review, 1958, 65(6): 386-408 doi: 10.1037/h0042519 [16] BENGIO Y. Practical recommendations for gradient-based training of deep architectures[M]//MONTAVON G, ORR G B, MÜLLER K R. Neural Networks: Tricks of the Trade: 2nd ed. Berlin, Heidelberg: Springer, 2012: 437-478 [17] GOUTTE C, GAUSSIER E. A probabilistic interpretation of precision, recall and F-Score, with implication for evaluation[C]//Proceedings of the 27th European Conference on IR Research on Advances in Information Retrieval. Santiago de Compostela, Spain: Springer, 2005 [18] DONALDSON R, DYER R M, KRAUS M J. An objective evaluator of techniques for predicting severe weather events [C]// 9th Conference on Severe Local Storms, Texas: American Meteorological Society, 1975: 321-326 [19] HEIDKE P. Berechnung des erfolges und der güte der windstärkevorhersagen im sturmwarnungsdienst[J]. Geografiska Annaler, 1926, 8(4): 301-349 doi: 10.1080/20014422.1926.11881138 [20] HANSSEN A W, KUIPERS W J A. On the relationship between the frequency of rain and various meteorological parameters[J]. Koninklijk Nederlands Meteorologisch Instituut., 1965, 81: 2-15 -
-

 下载:
下载:

计量
- 文章访问数: 847
- HTML全文浏览量: 483
- PDF下载量: 99
-
被引次数:
0(来源:Crossref)
0(来源:其他)

