


基于激光雷达的中低纬地区上空钠层月变化特征
doi: 10.11728/cjss2025.03.2024-0064 cstr: 32142.14.cjss.2024-0064
-
 柴薇薇 女, 汉族, 1999年6月出生于河南省驻马店市, 现为海南师范大学物理与电子工程学院在读学生, 物理学硕士研究生, 研究方向为激光雷达. E-mail: cww0066@163.com
 -
 张铁民 男, 汉族, 1968年7月出生于吉林省吉林市, 现为海南师范大学物理与电子工程学院物理学教授, 硕士生导师, 主要从事激光雷达、光电子材料与器件等方向. E-mail: 060049@hainnu.edu.cn
作者简介:
通讯作者:
Monthly Variations Characteristics of Sodium Layer over Mid-low Latitudes Based on Lidar
-
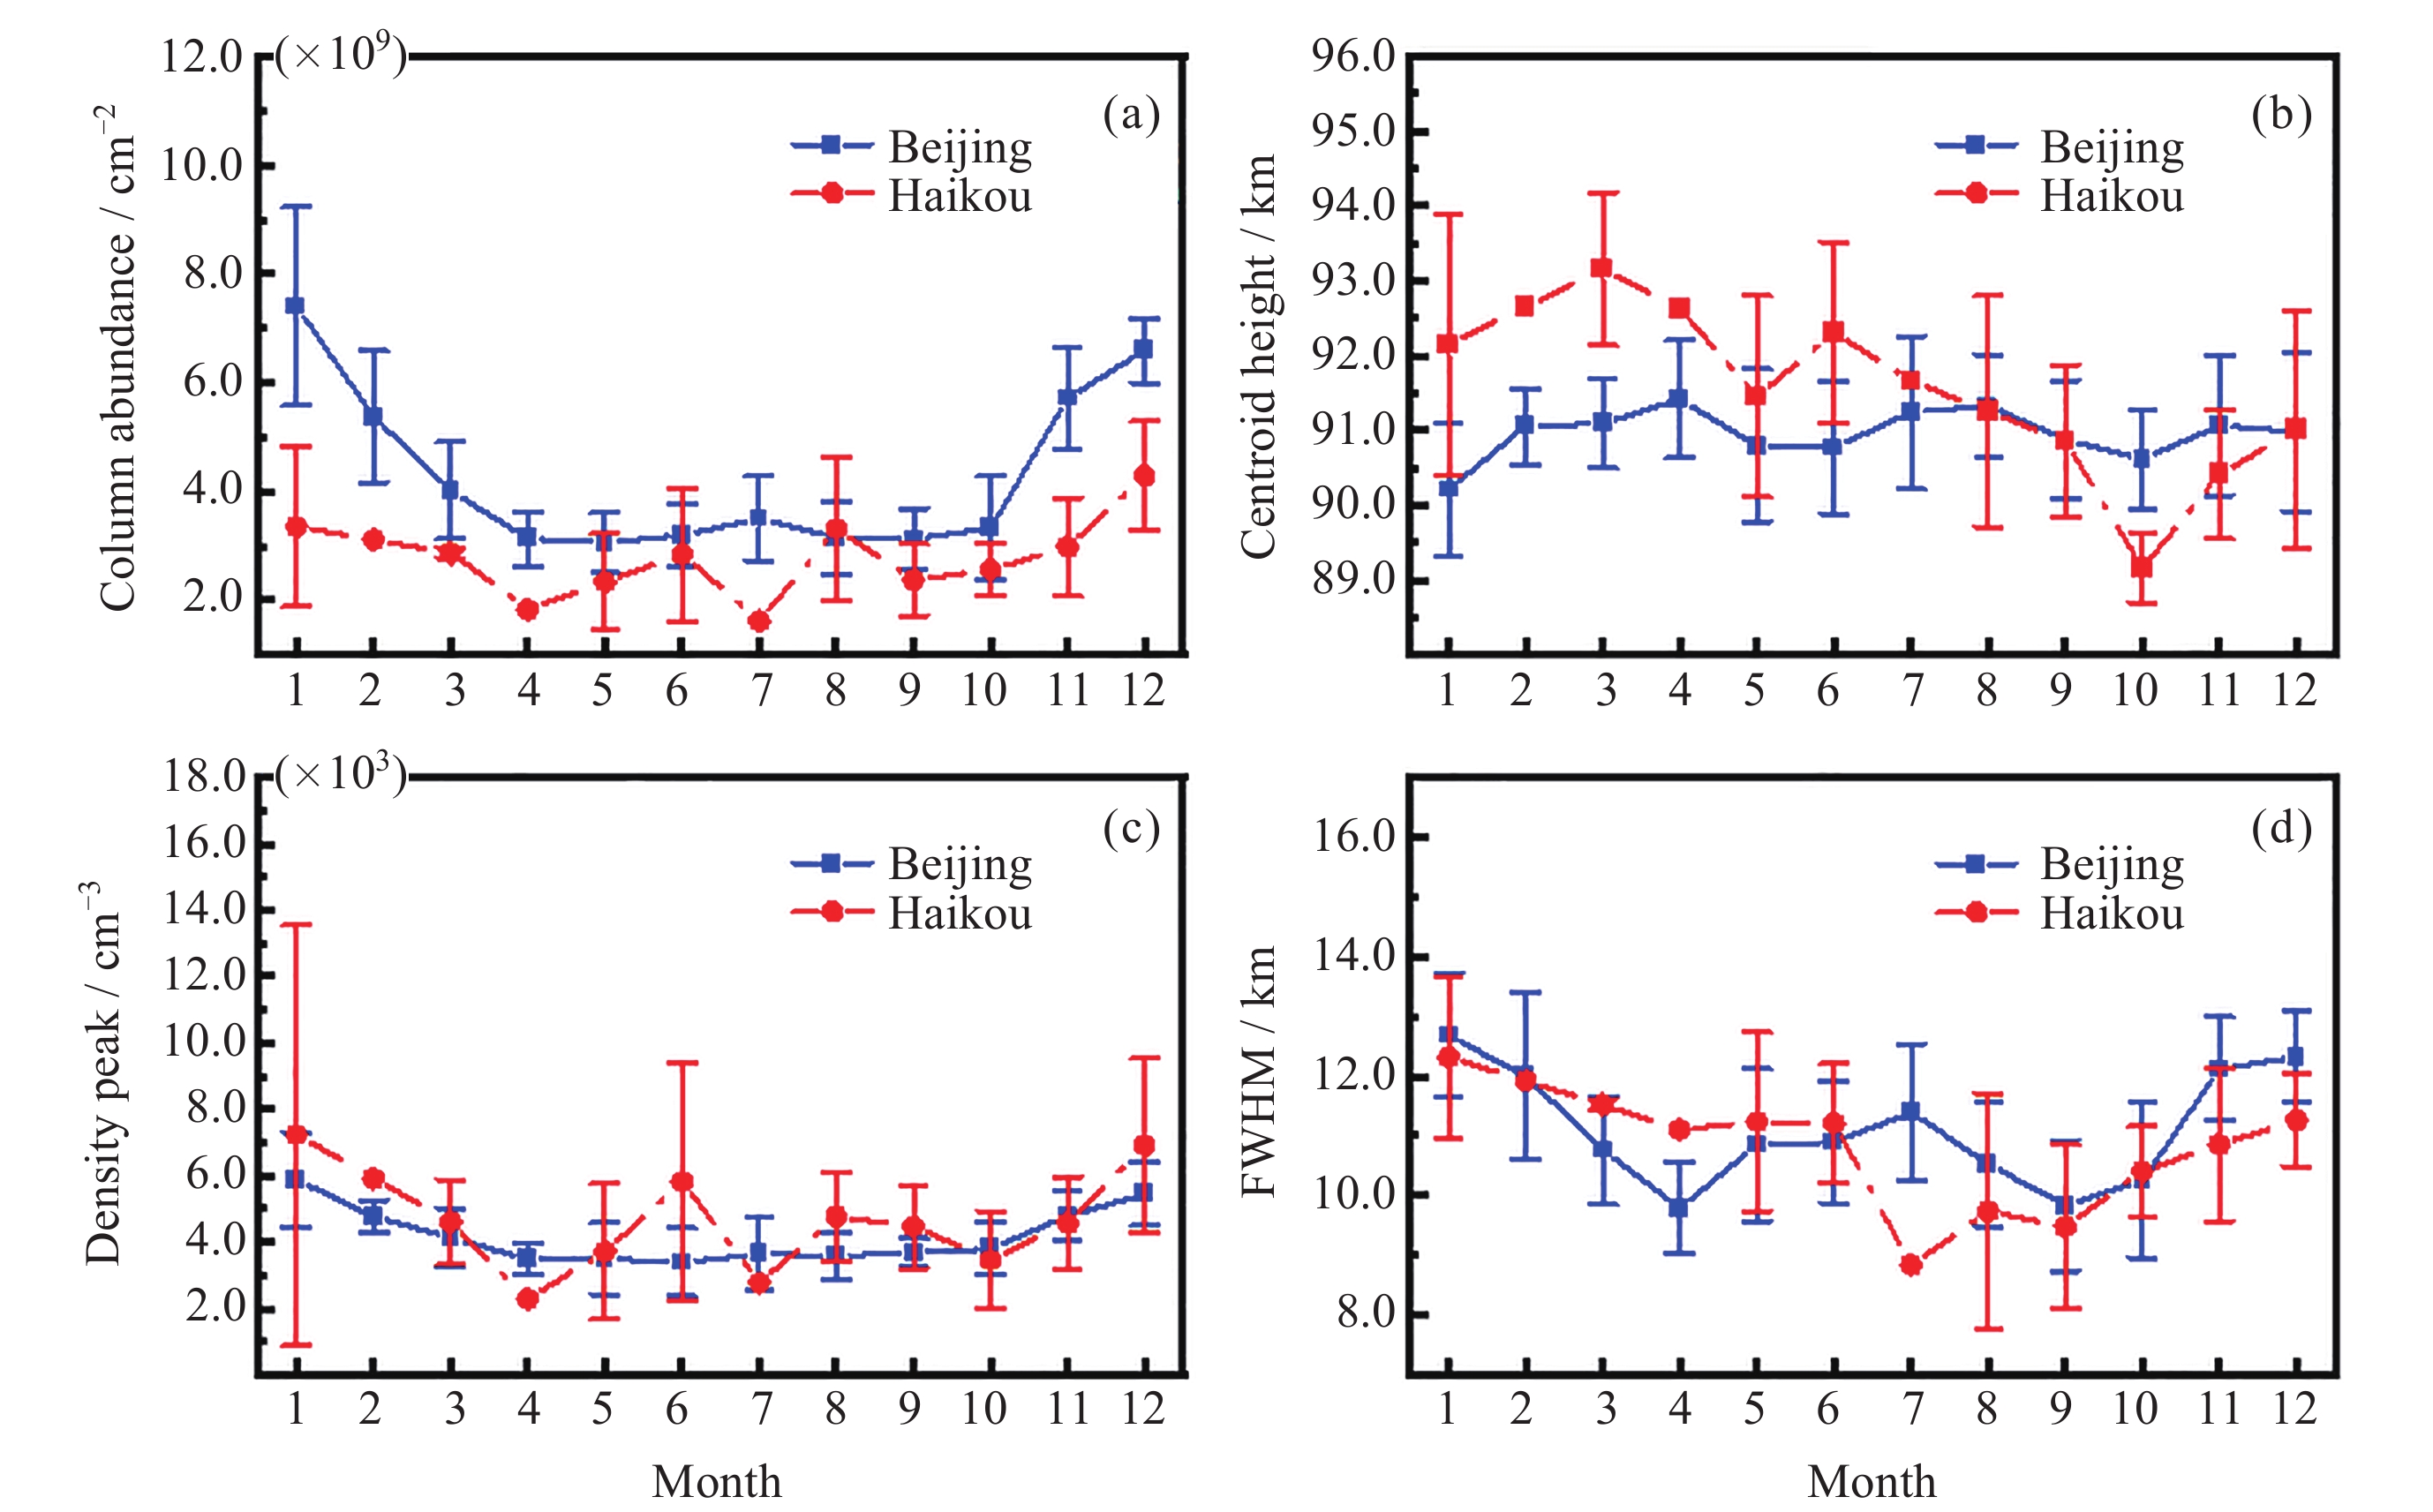
摘要: 2020年在不同纬度地区使用相同设备的钠荧光激光雷达对钠层同时进行观测. 使用观测所获得的钠层回波光子数据进行反演计算, 在不剔除钠层特殊事件的情况下探讨其地理性差异. 研究显示, 除8月外, 中纬度地区北京(40.5°N, 116.0°E)柱密度月平均值均高于低纬度地区海口(20.0°N, 110.3°E). 2020年北京和海口发生突发钠层事件概率分别为5.3%和44.9%, 双钠层事件概率分别为5.3%和4.3%; 其中, 北京突发钠层密度峰值高度均处于较高海拔位置, 强度因子可达到全年最大值10.6. 海口突发钠层月平均绝对密度峰值均高于北京, 峰值高度则反之. 两地对比发现, 北京上空钠层月变化相对于海口地区较为规律, 北京双钠层事件较为集中, 其中在5月较为频繁. 两地双钠层中第二钠层平均峰值高度均位于110 km附近.Abstract: In 2020, the same equipment and the same laser parameters of sodium fluorescence lidar were used to simultaneously observe the sodium layer over different latitudes. This paper systematically explores the monthly characteristics of the overall sodium layer in two regions in 2020 through the sodium layer echo photon data obtained from the observation, and inverts and analyses the raw data to reveal the geographic differences of the sodium layer at different latitudes. It is found that except August, the average monthly column abundance in Beijing (40.5°N, 116.0°E) at mid-latitude is higher than that in Haikou (20.0°N, 110.3°E) at low latitude. According to the statistics of special events in 2020, the probability of Sporadic Sodium Layer (SSL) events in Beijing and Haikou is 5.3% and 44.9% respectively, and the probability of Double Sodium Layer (DSL) events is 5.3% and 4.3% respectively; the peak altitude of SSL events in Beijing is located at a higher height throughout the year, and strength factor of SSL reaches the maximum value of 10.6 throughout the year. By comparing the ionosphere data by an ionosonde operated at Danzhou, China (19.5°N, 109.1°E), it is found that SSL events above 96.0 km in Haikou have a high correlation with Sporadic E layer (Es). Monthly average peak value of the SSL events in Haikou is higher than that in Beijing, and the peak altitude is the opposite. Comparison between two regions shows that without excluding the special events, the monthly trend of sodium layer in Beijing is more regular than that in Haikou. SSL events in Haikou are more frequent, DSL events are more concentrated in Beijing, and they are extremely frequent in May, which may be the result of the modulation of Es and other factors. The average peak altitude of the secondary sodium layer of DSL events in both regions are located near 110 km. This work can further refine our understanding of the behavioral characteristics of sodium layers, providing reference data and conclusions for future research on sodium layers.
-
Key words:
- Sodium layer /
- Lidar /
- Density peak value /
- Sporadic sodium layer /
- Double sodium layer
-
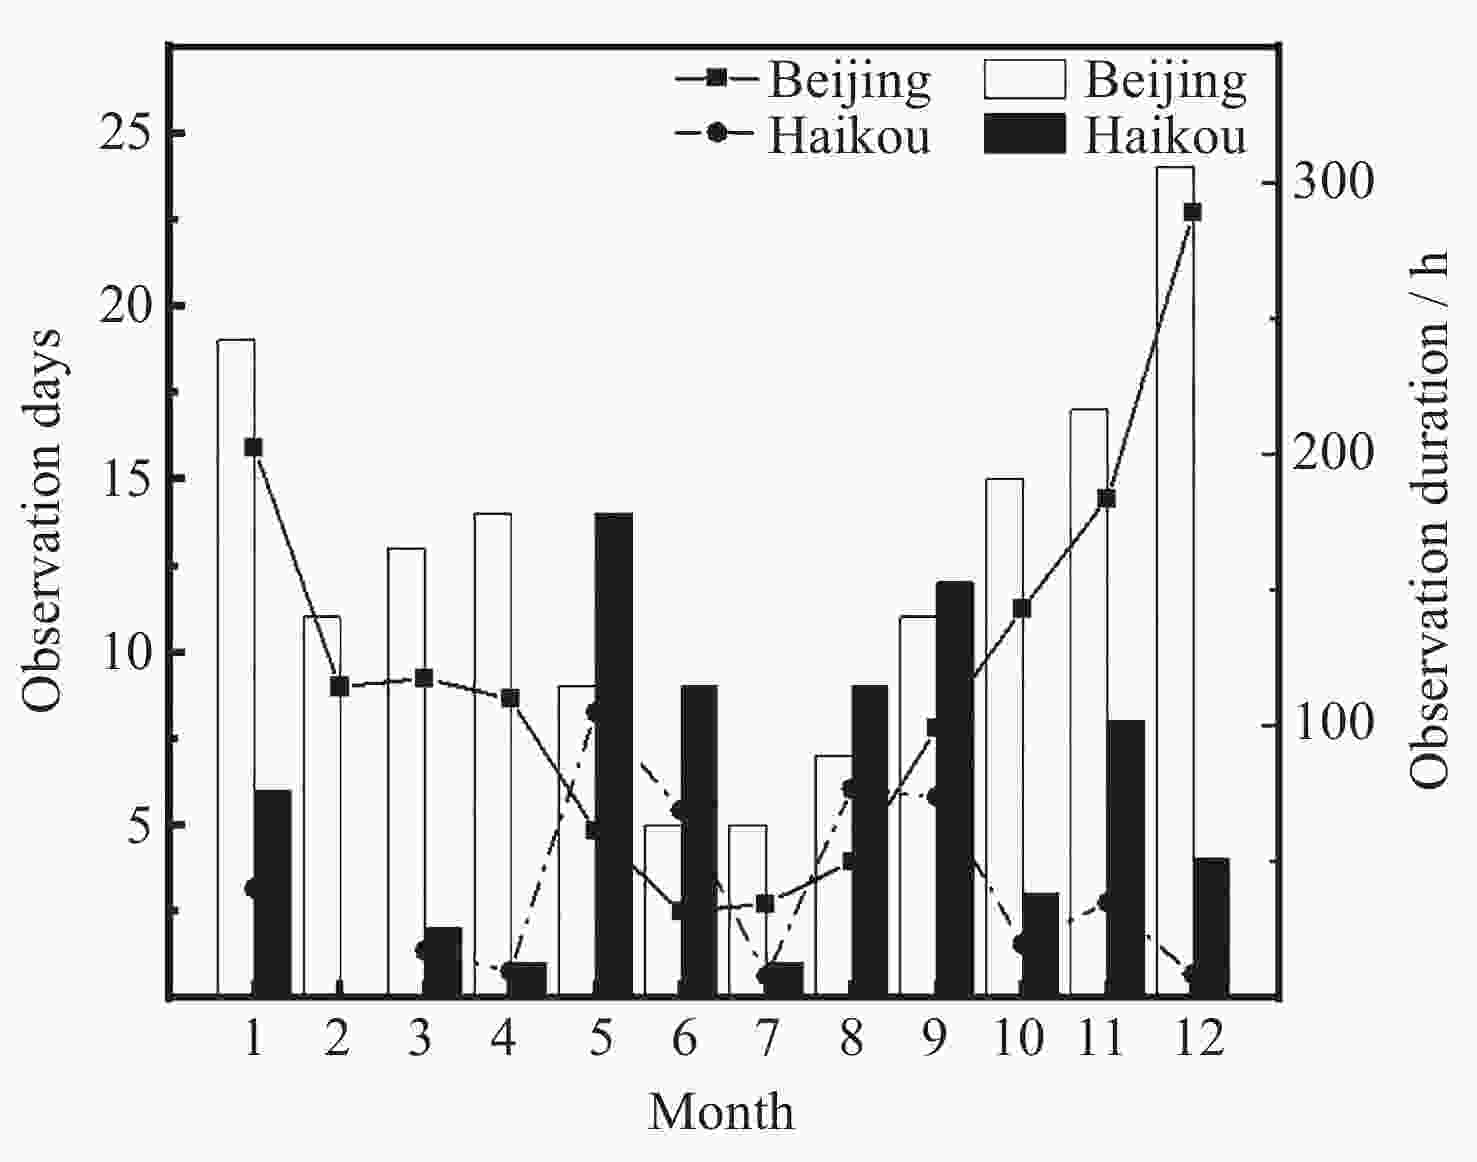
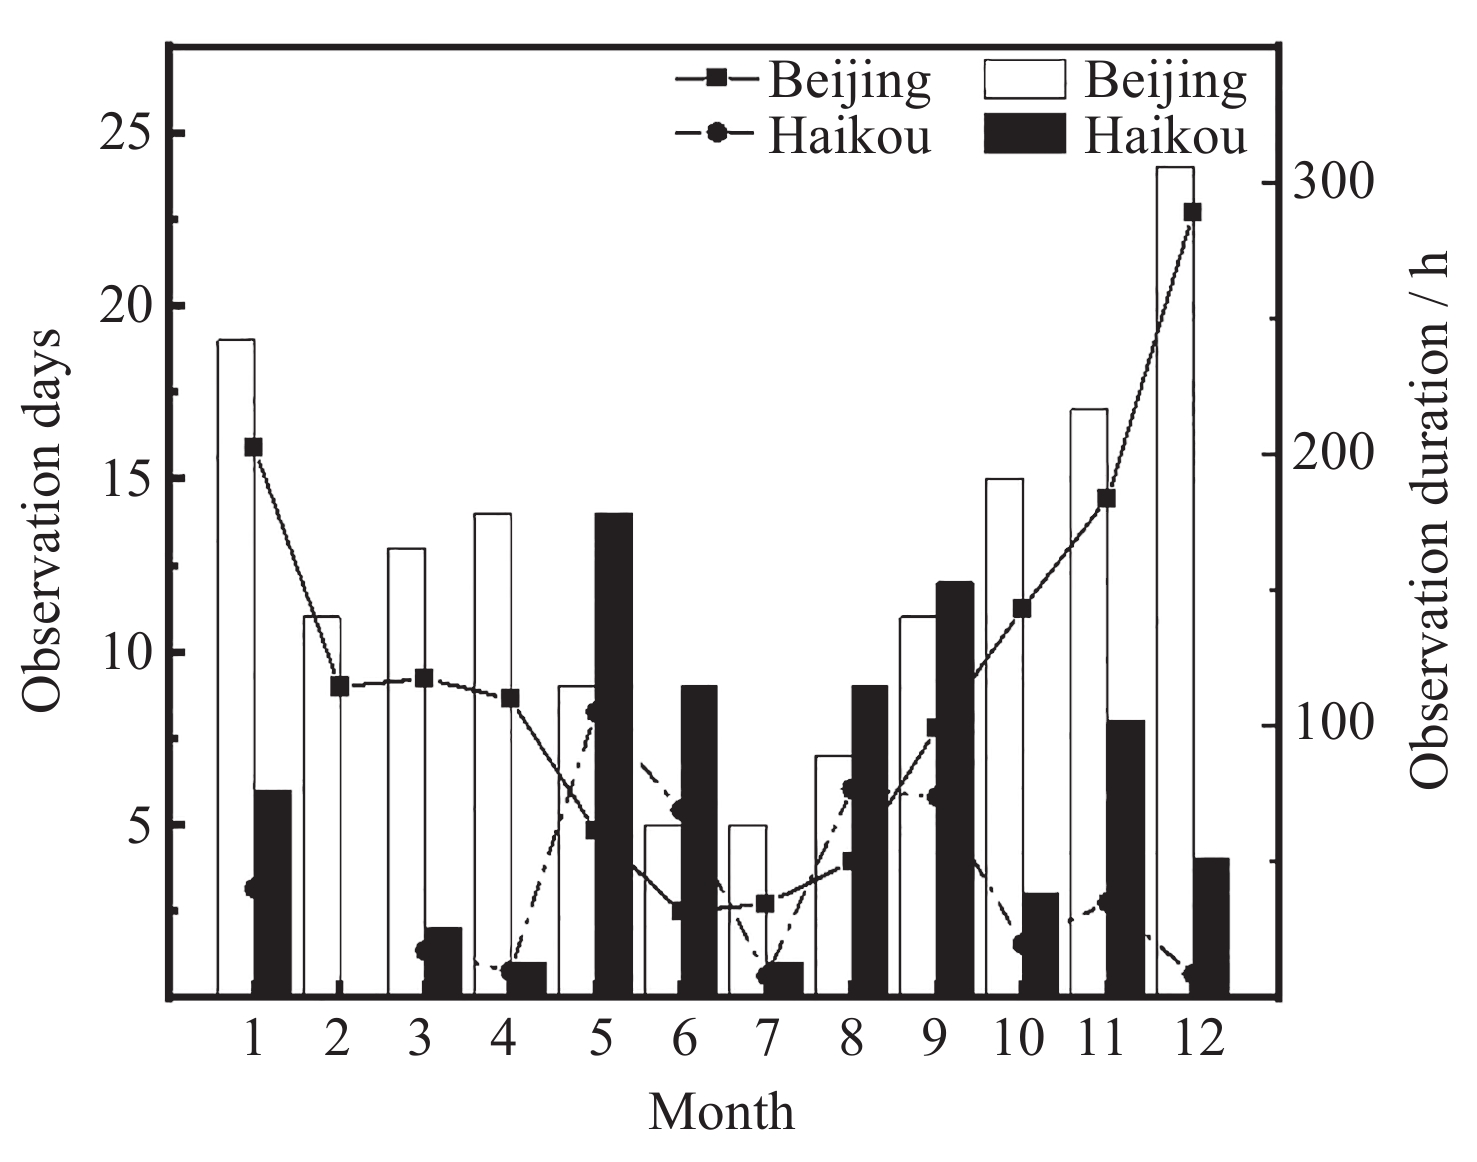
图 1 2020年北京和海口上空钠层观测时长及天数. 柱状图为观测天数, 曲线为观测时长
Figure 1. Observation duration and days of sodium layer over Beijing and Haikou in 2020. The bar chart is the result of observation days, and the line is the result of observation duration
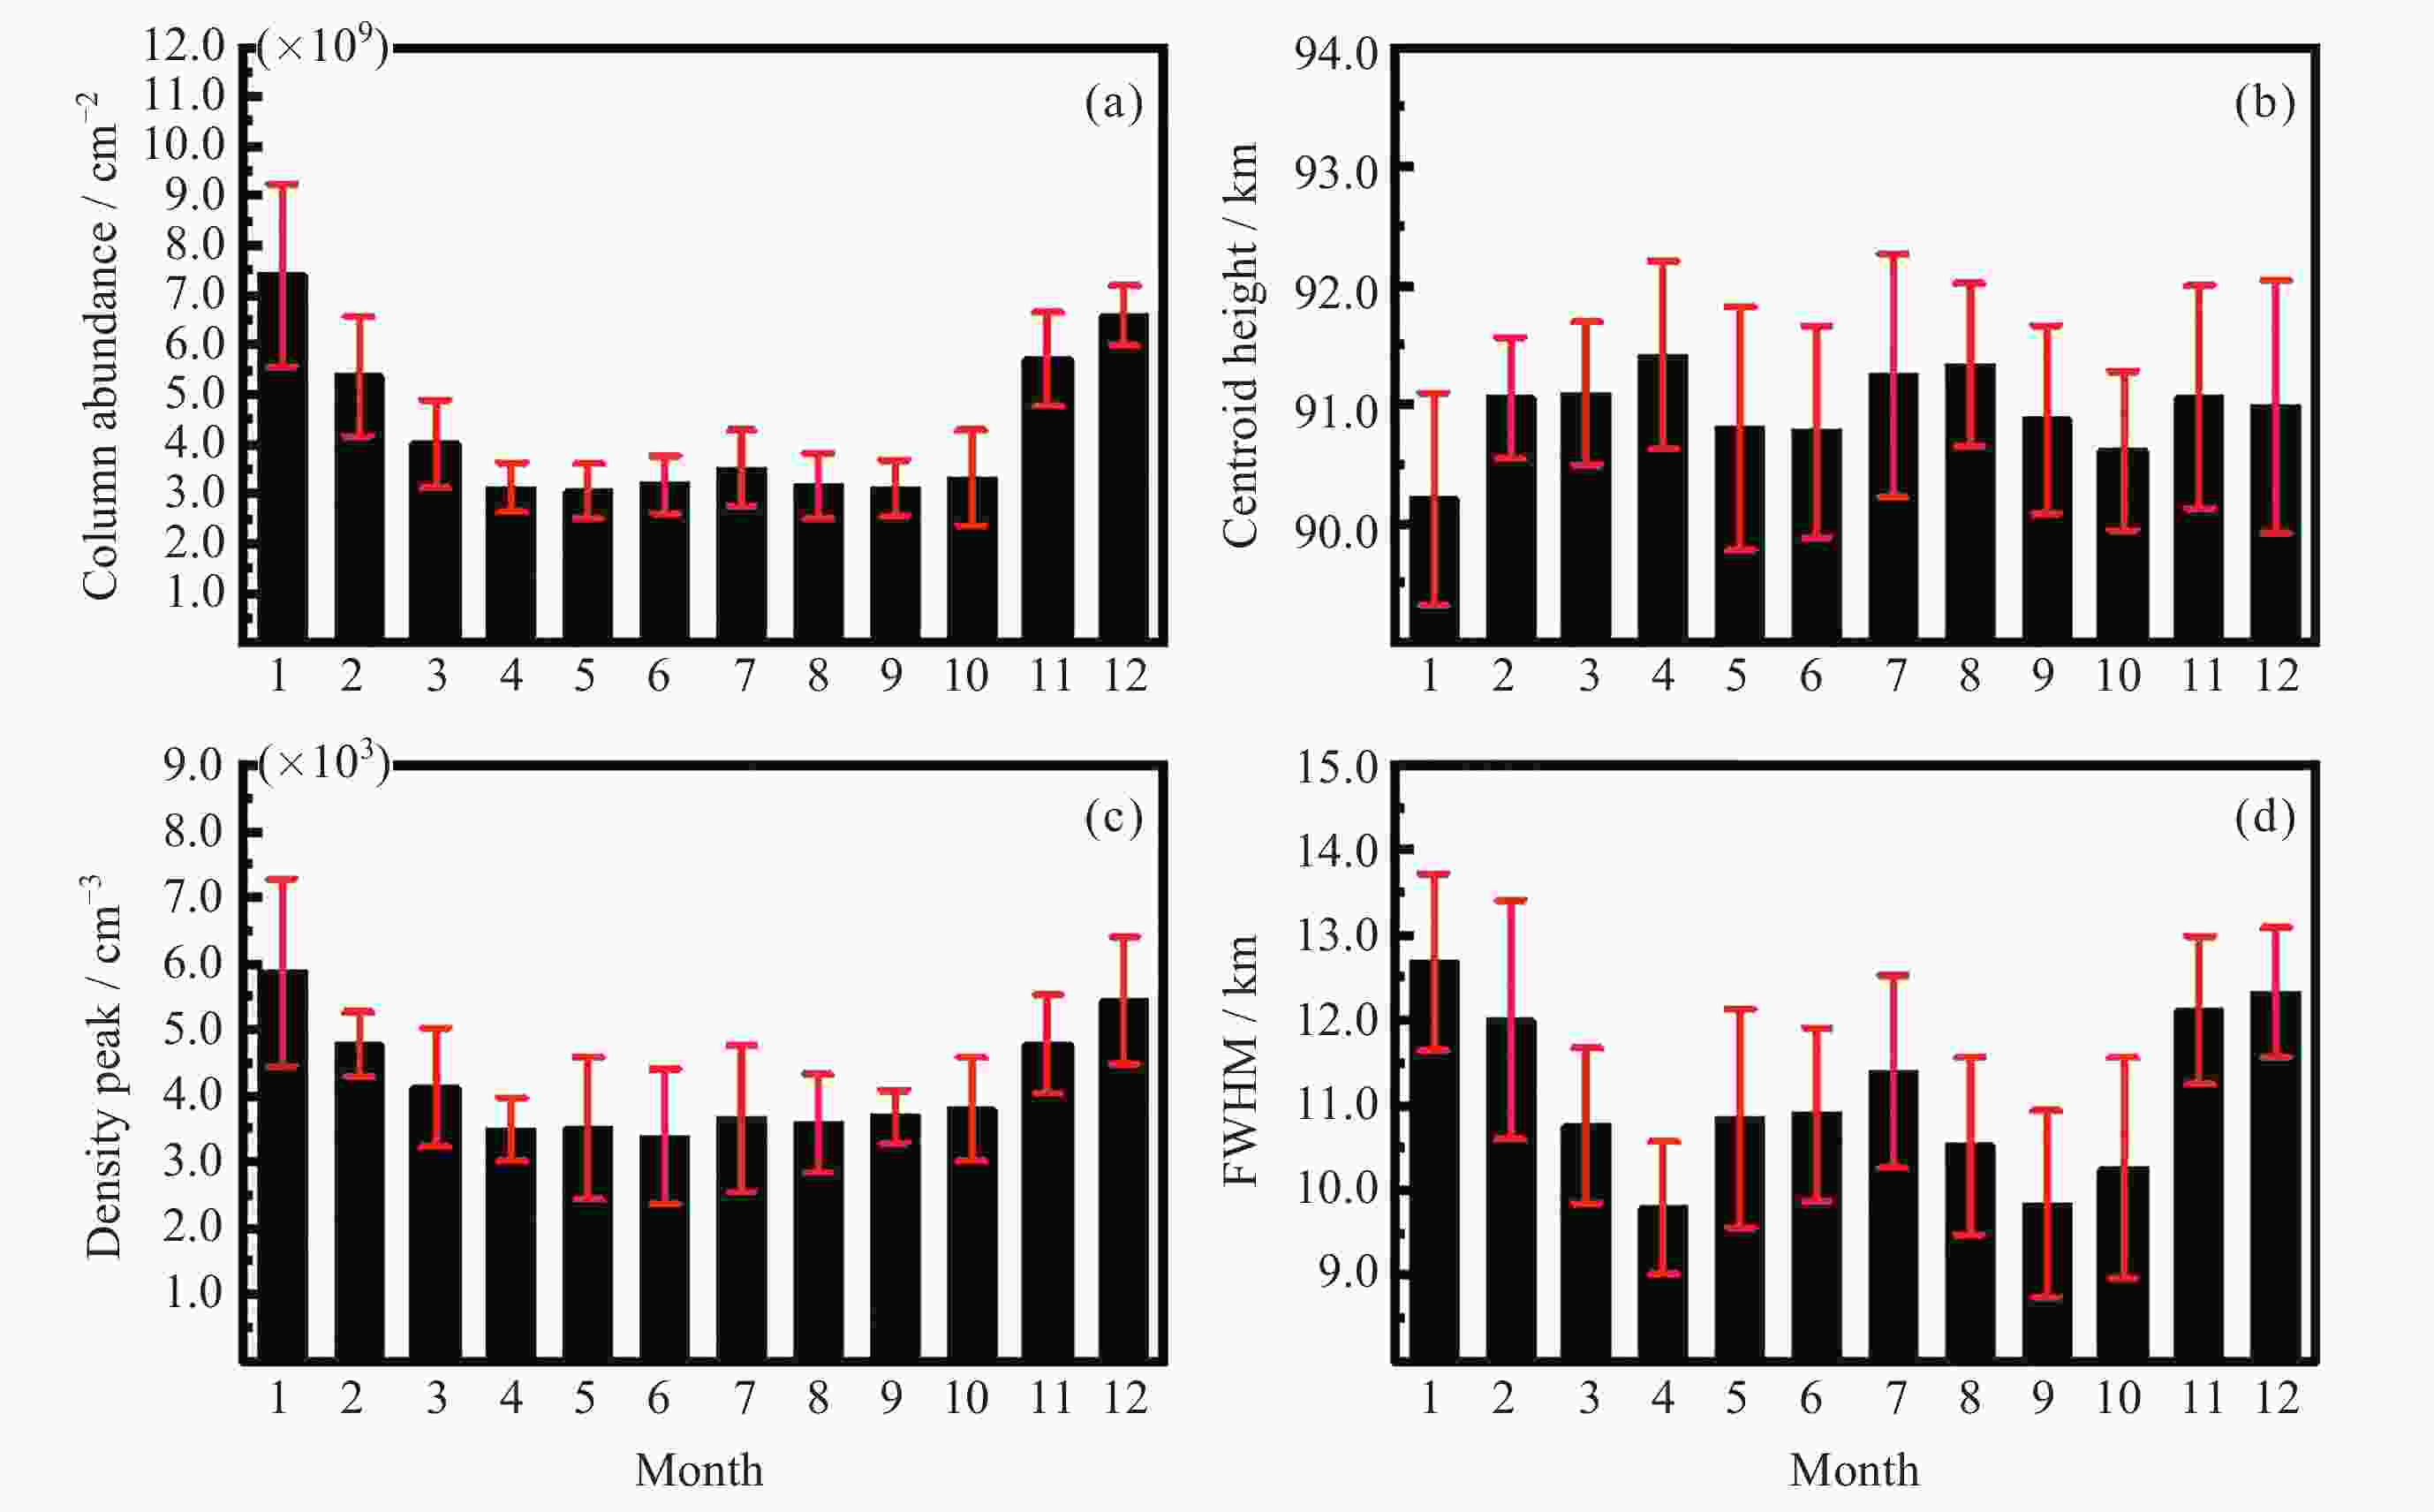
图 2 2020年北京地区钠层相关参数月平均值
Figure 2. Monthly average values of sodium layer related parameters over Beijing in 2020
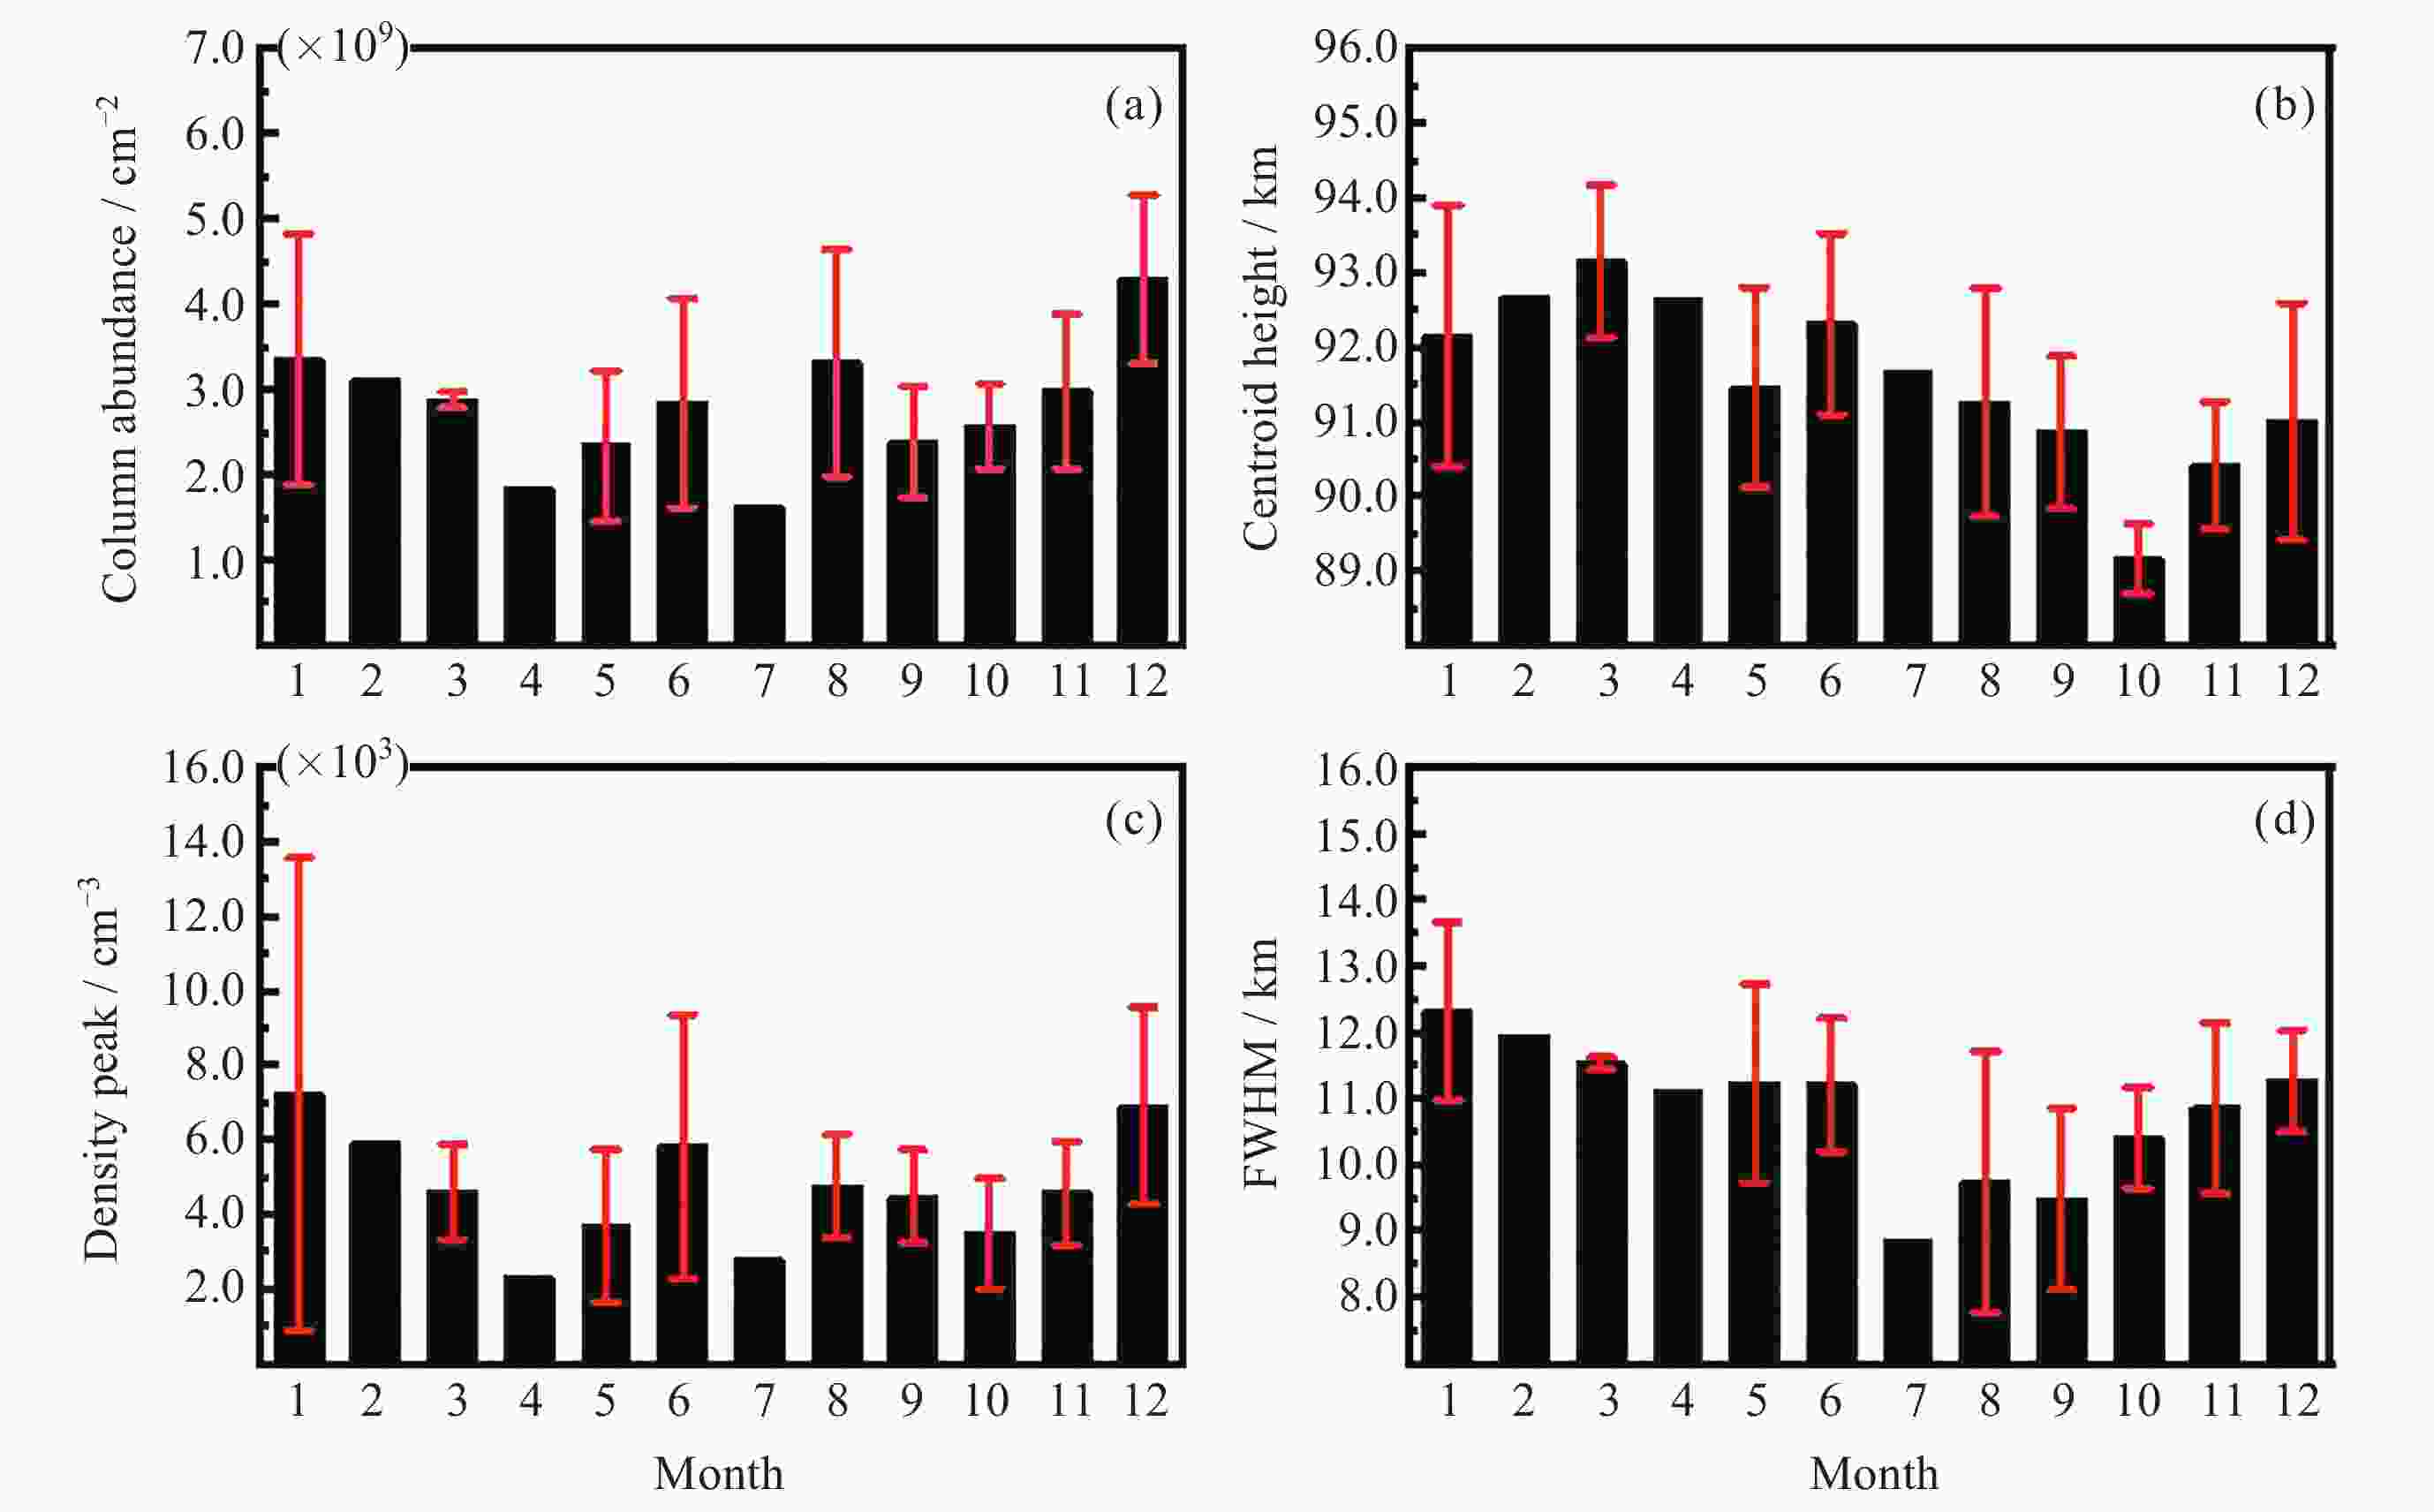
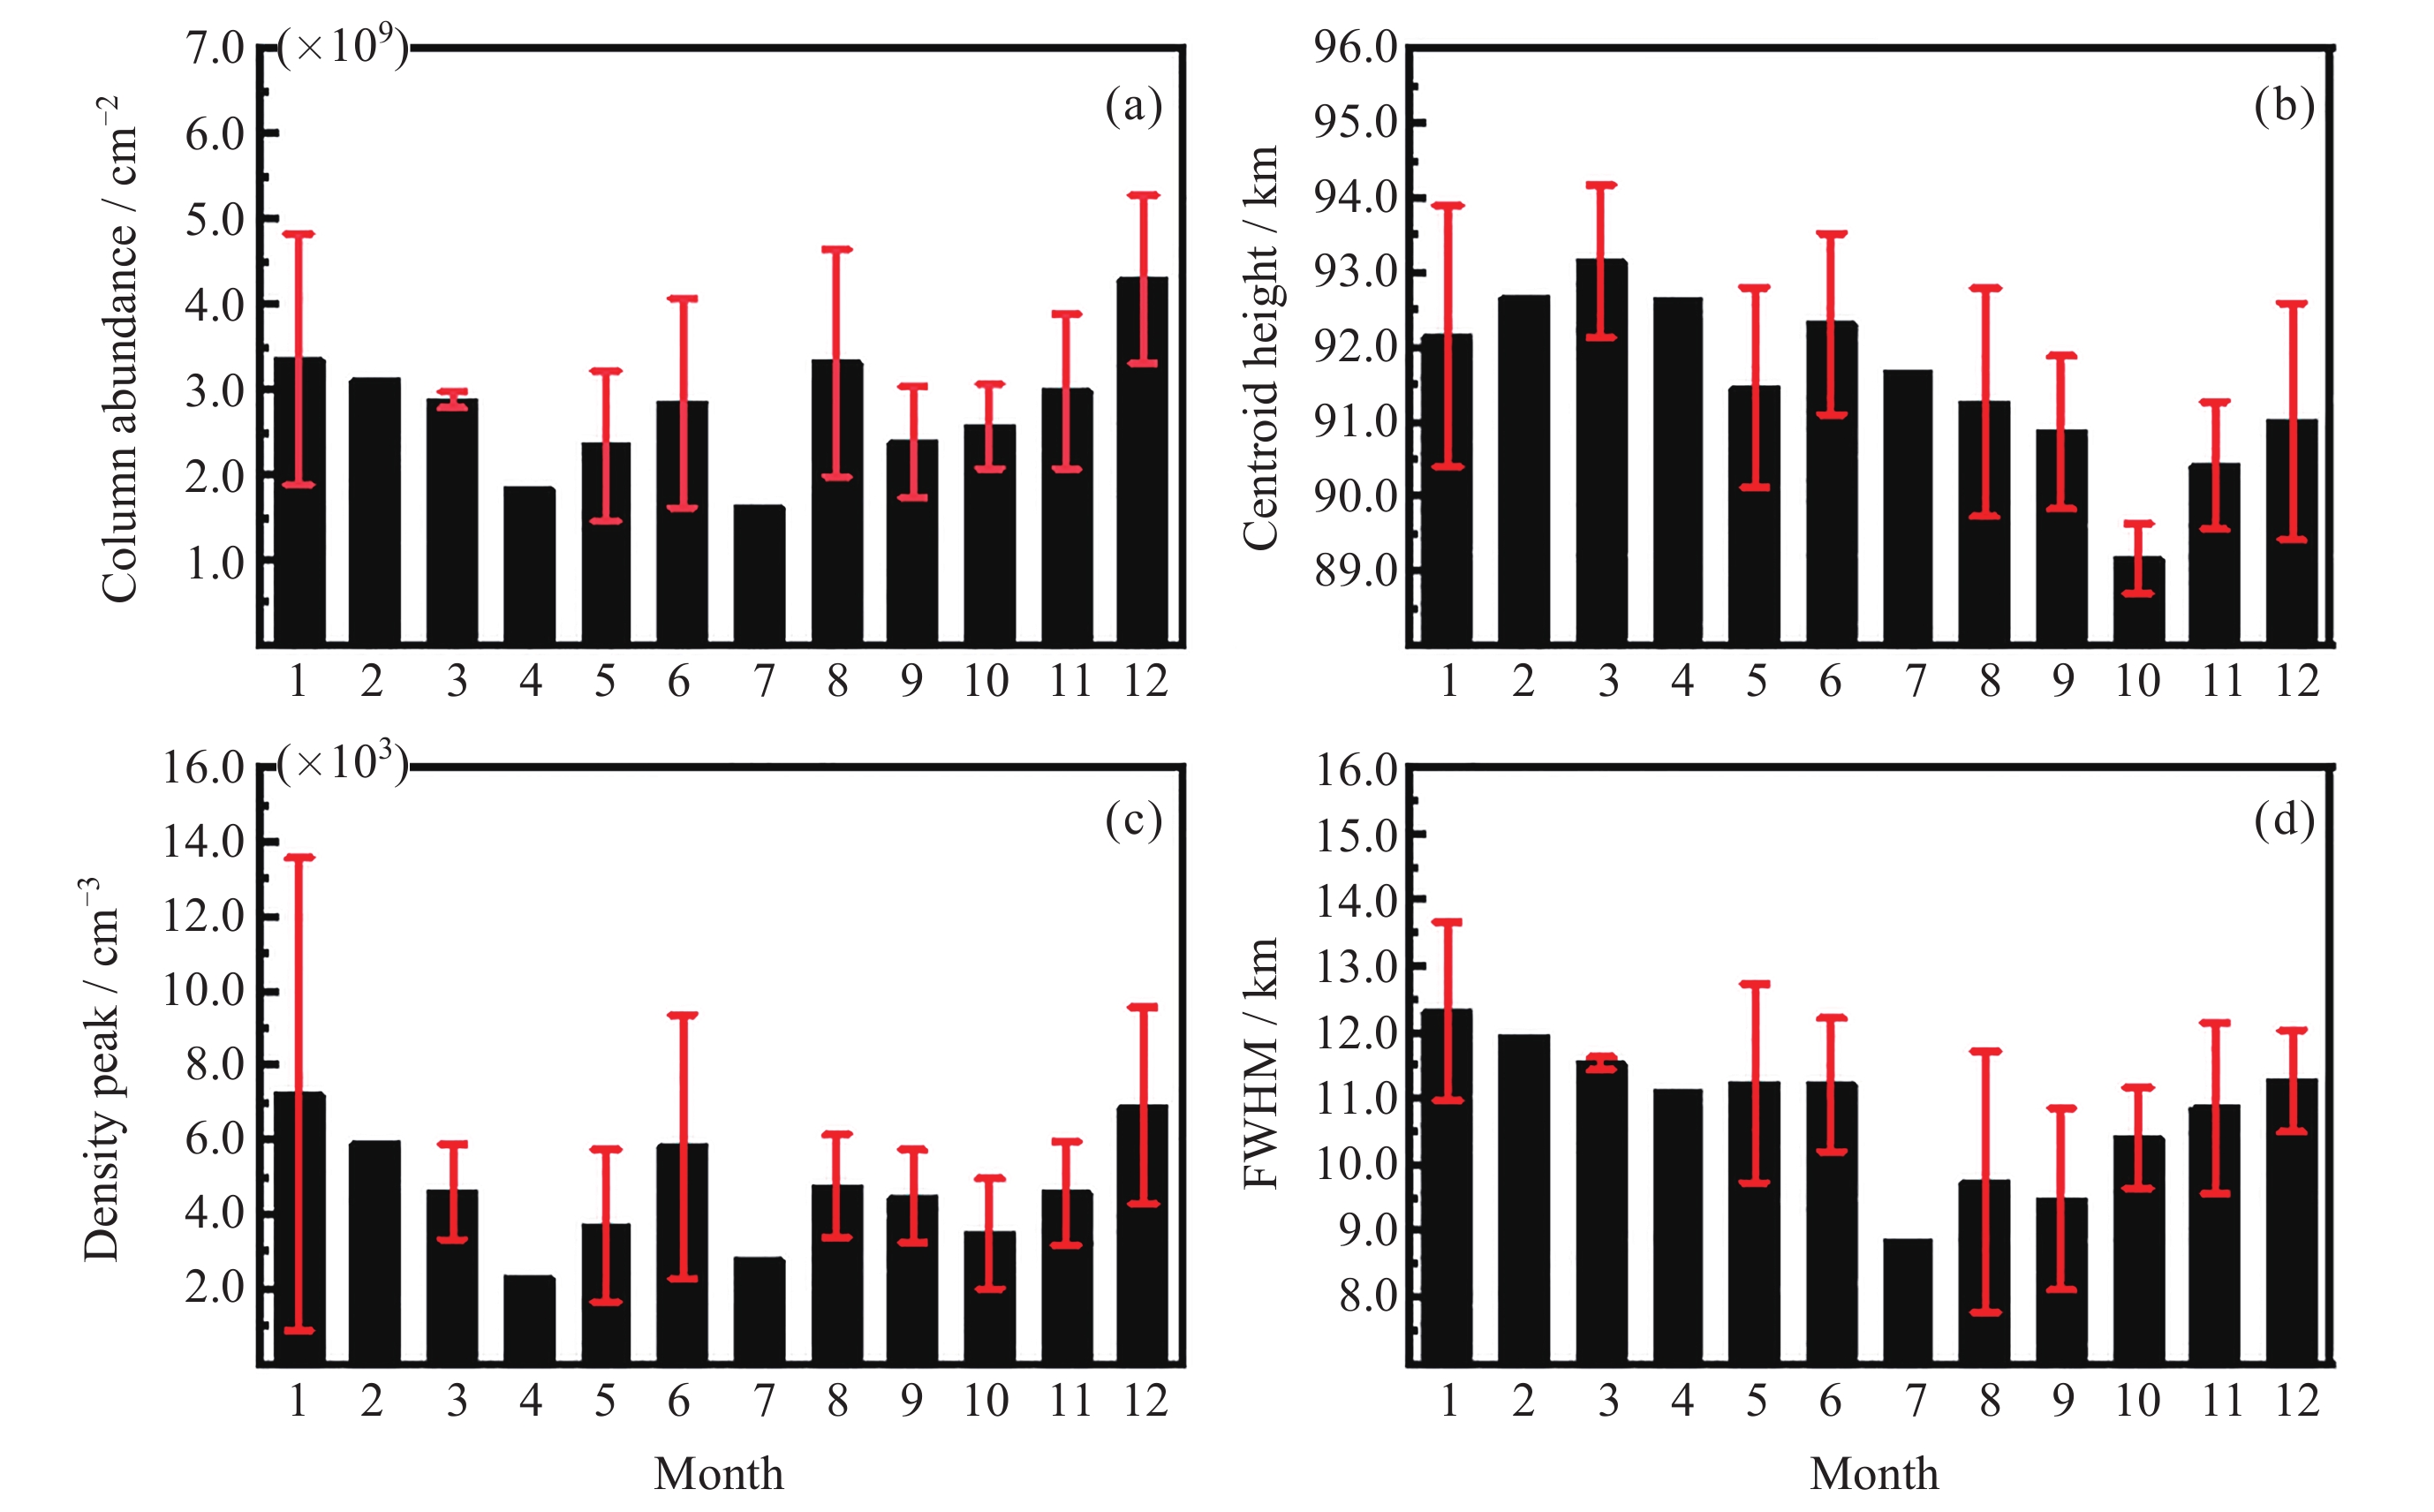
图 3 2020年海口地区上空钠层相关参数月平均值
Figure 3. Monthly average values of sodium layer related parameters over Haikou in 2020
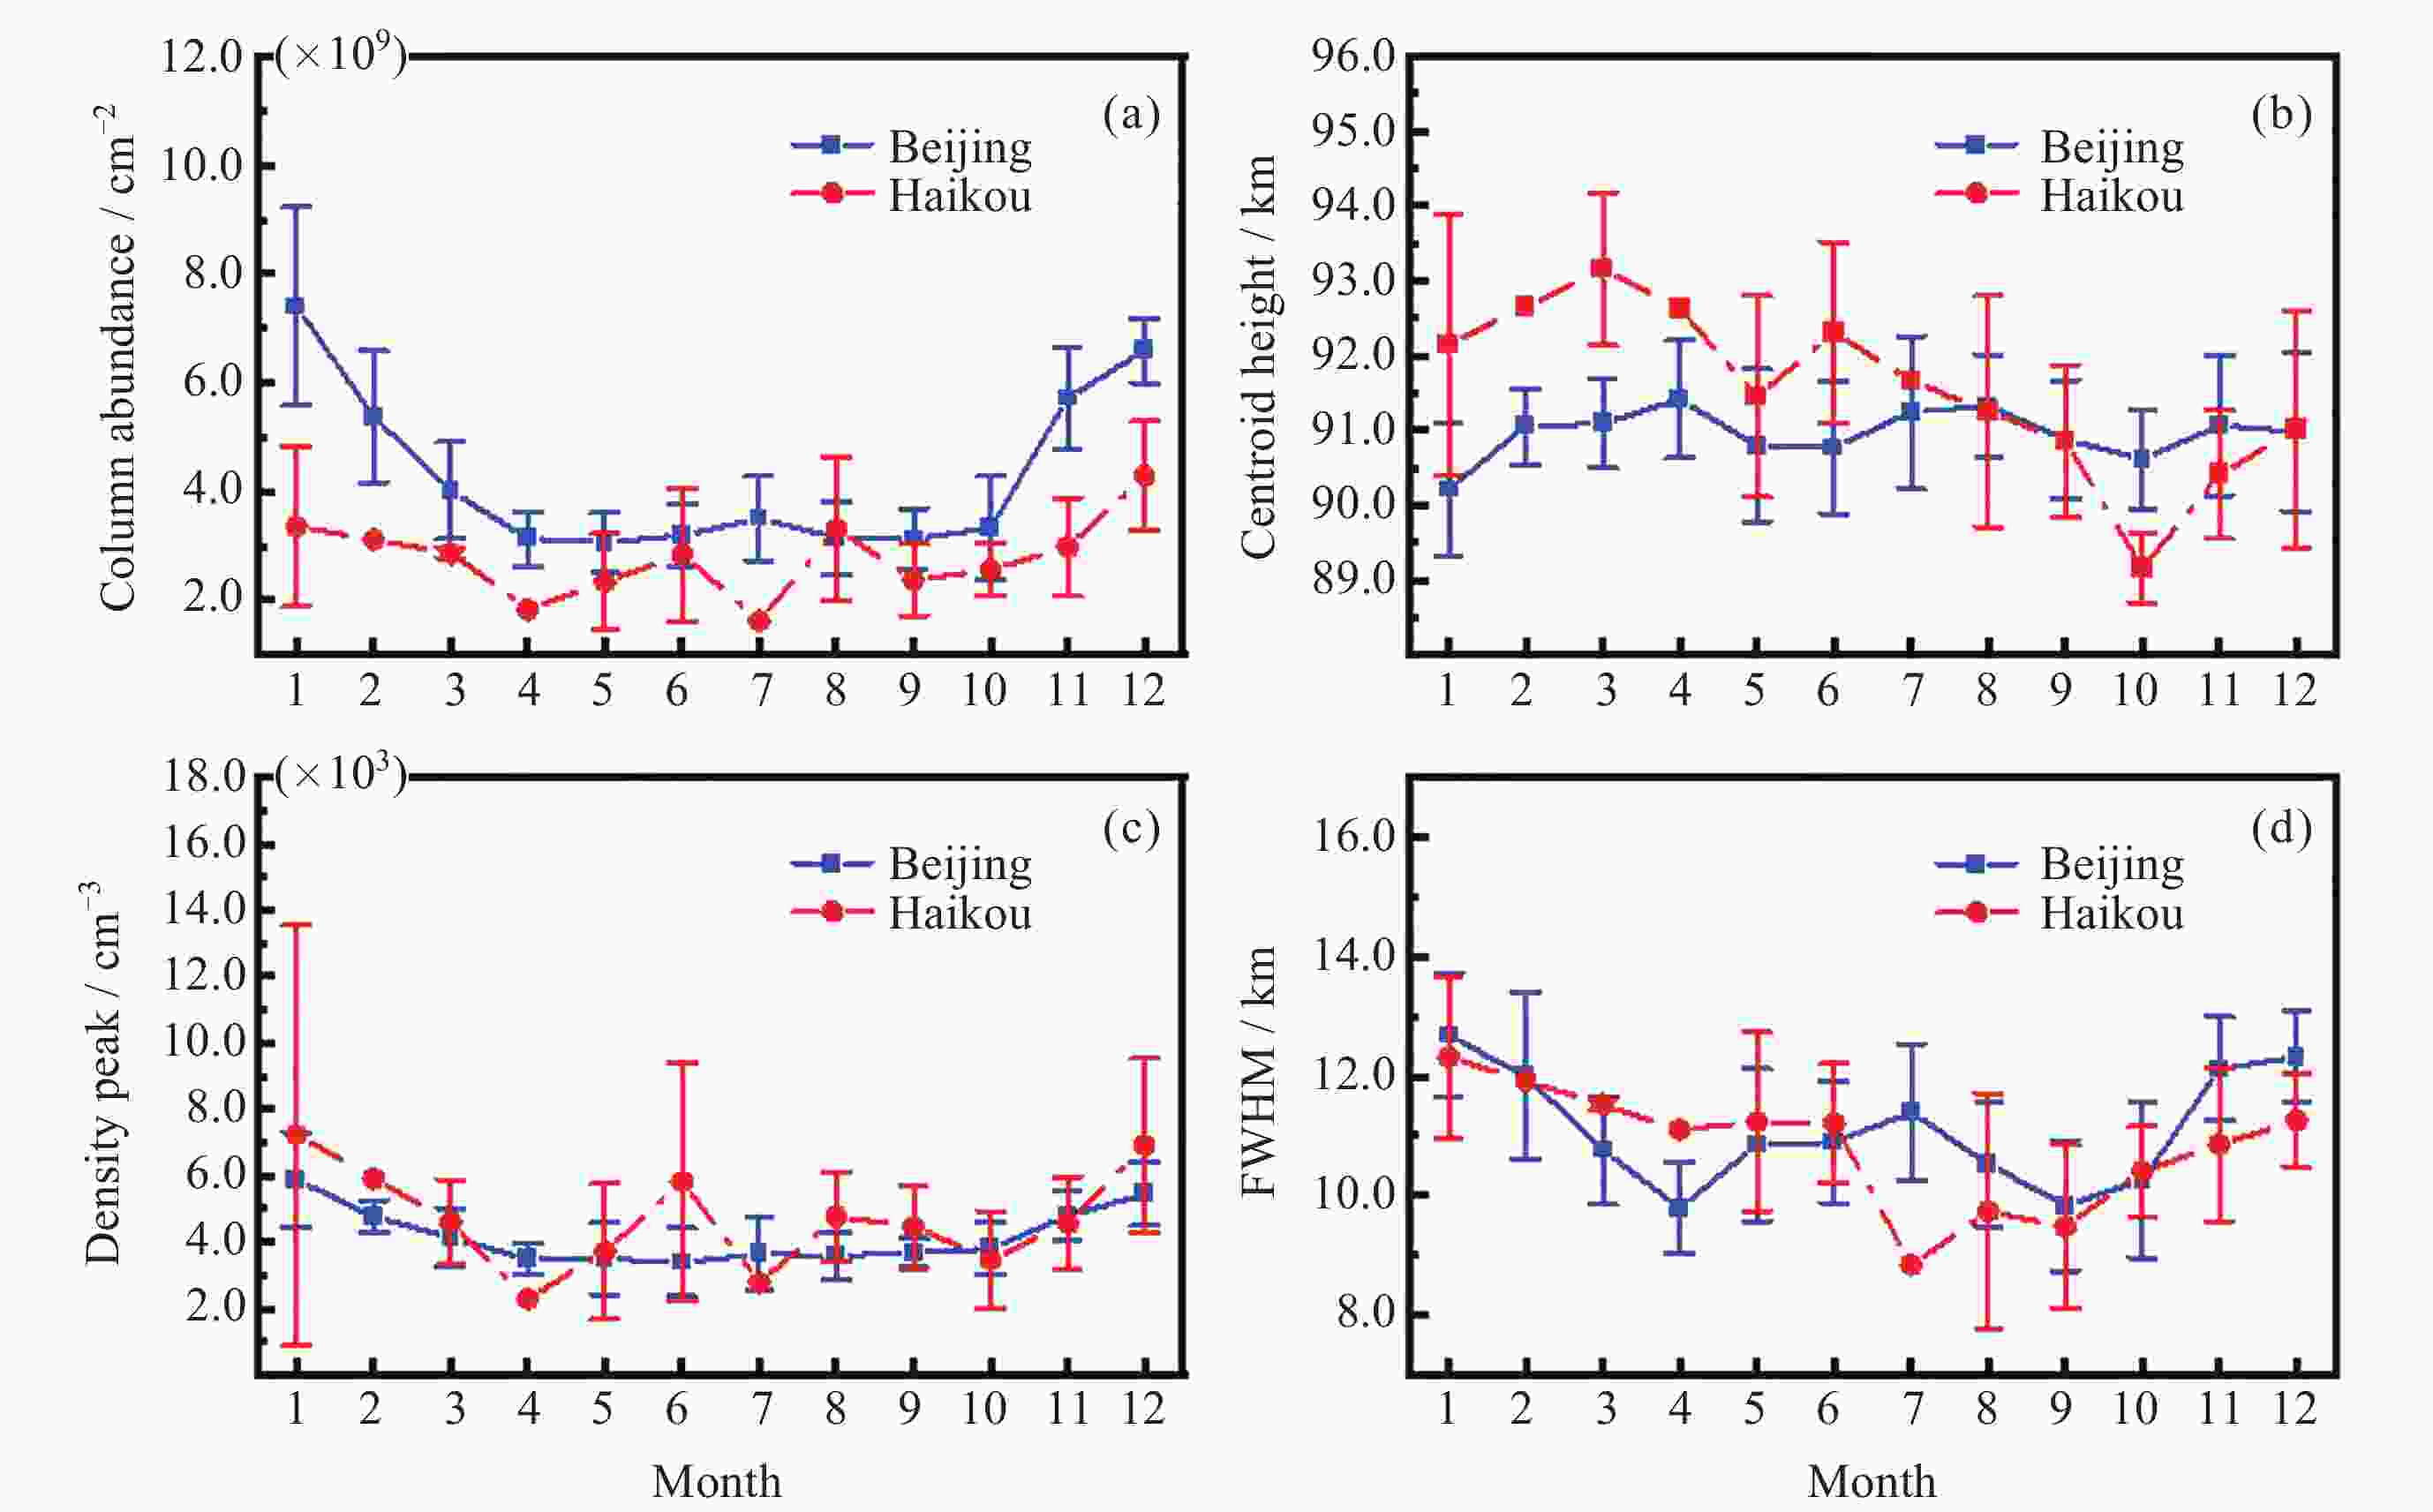
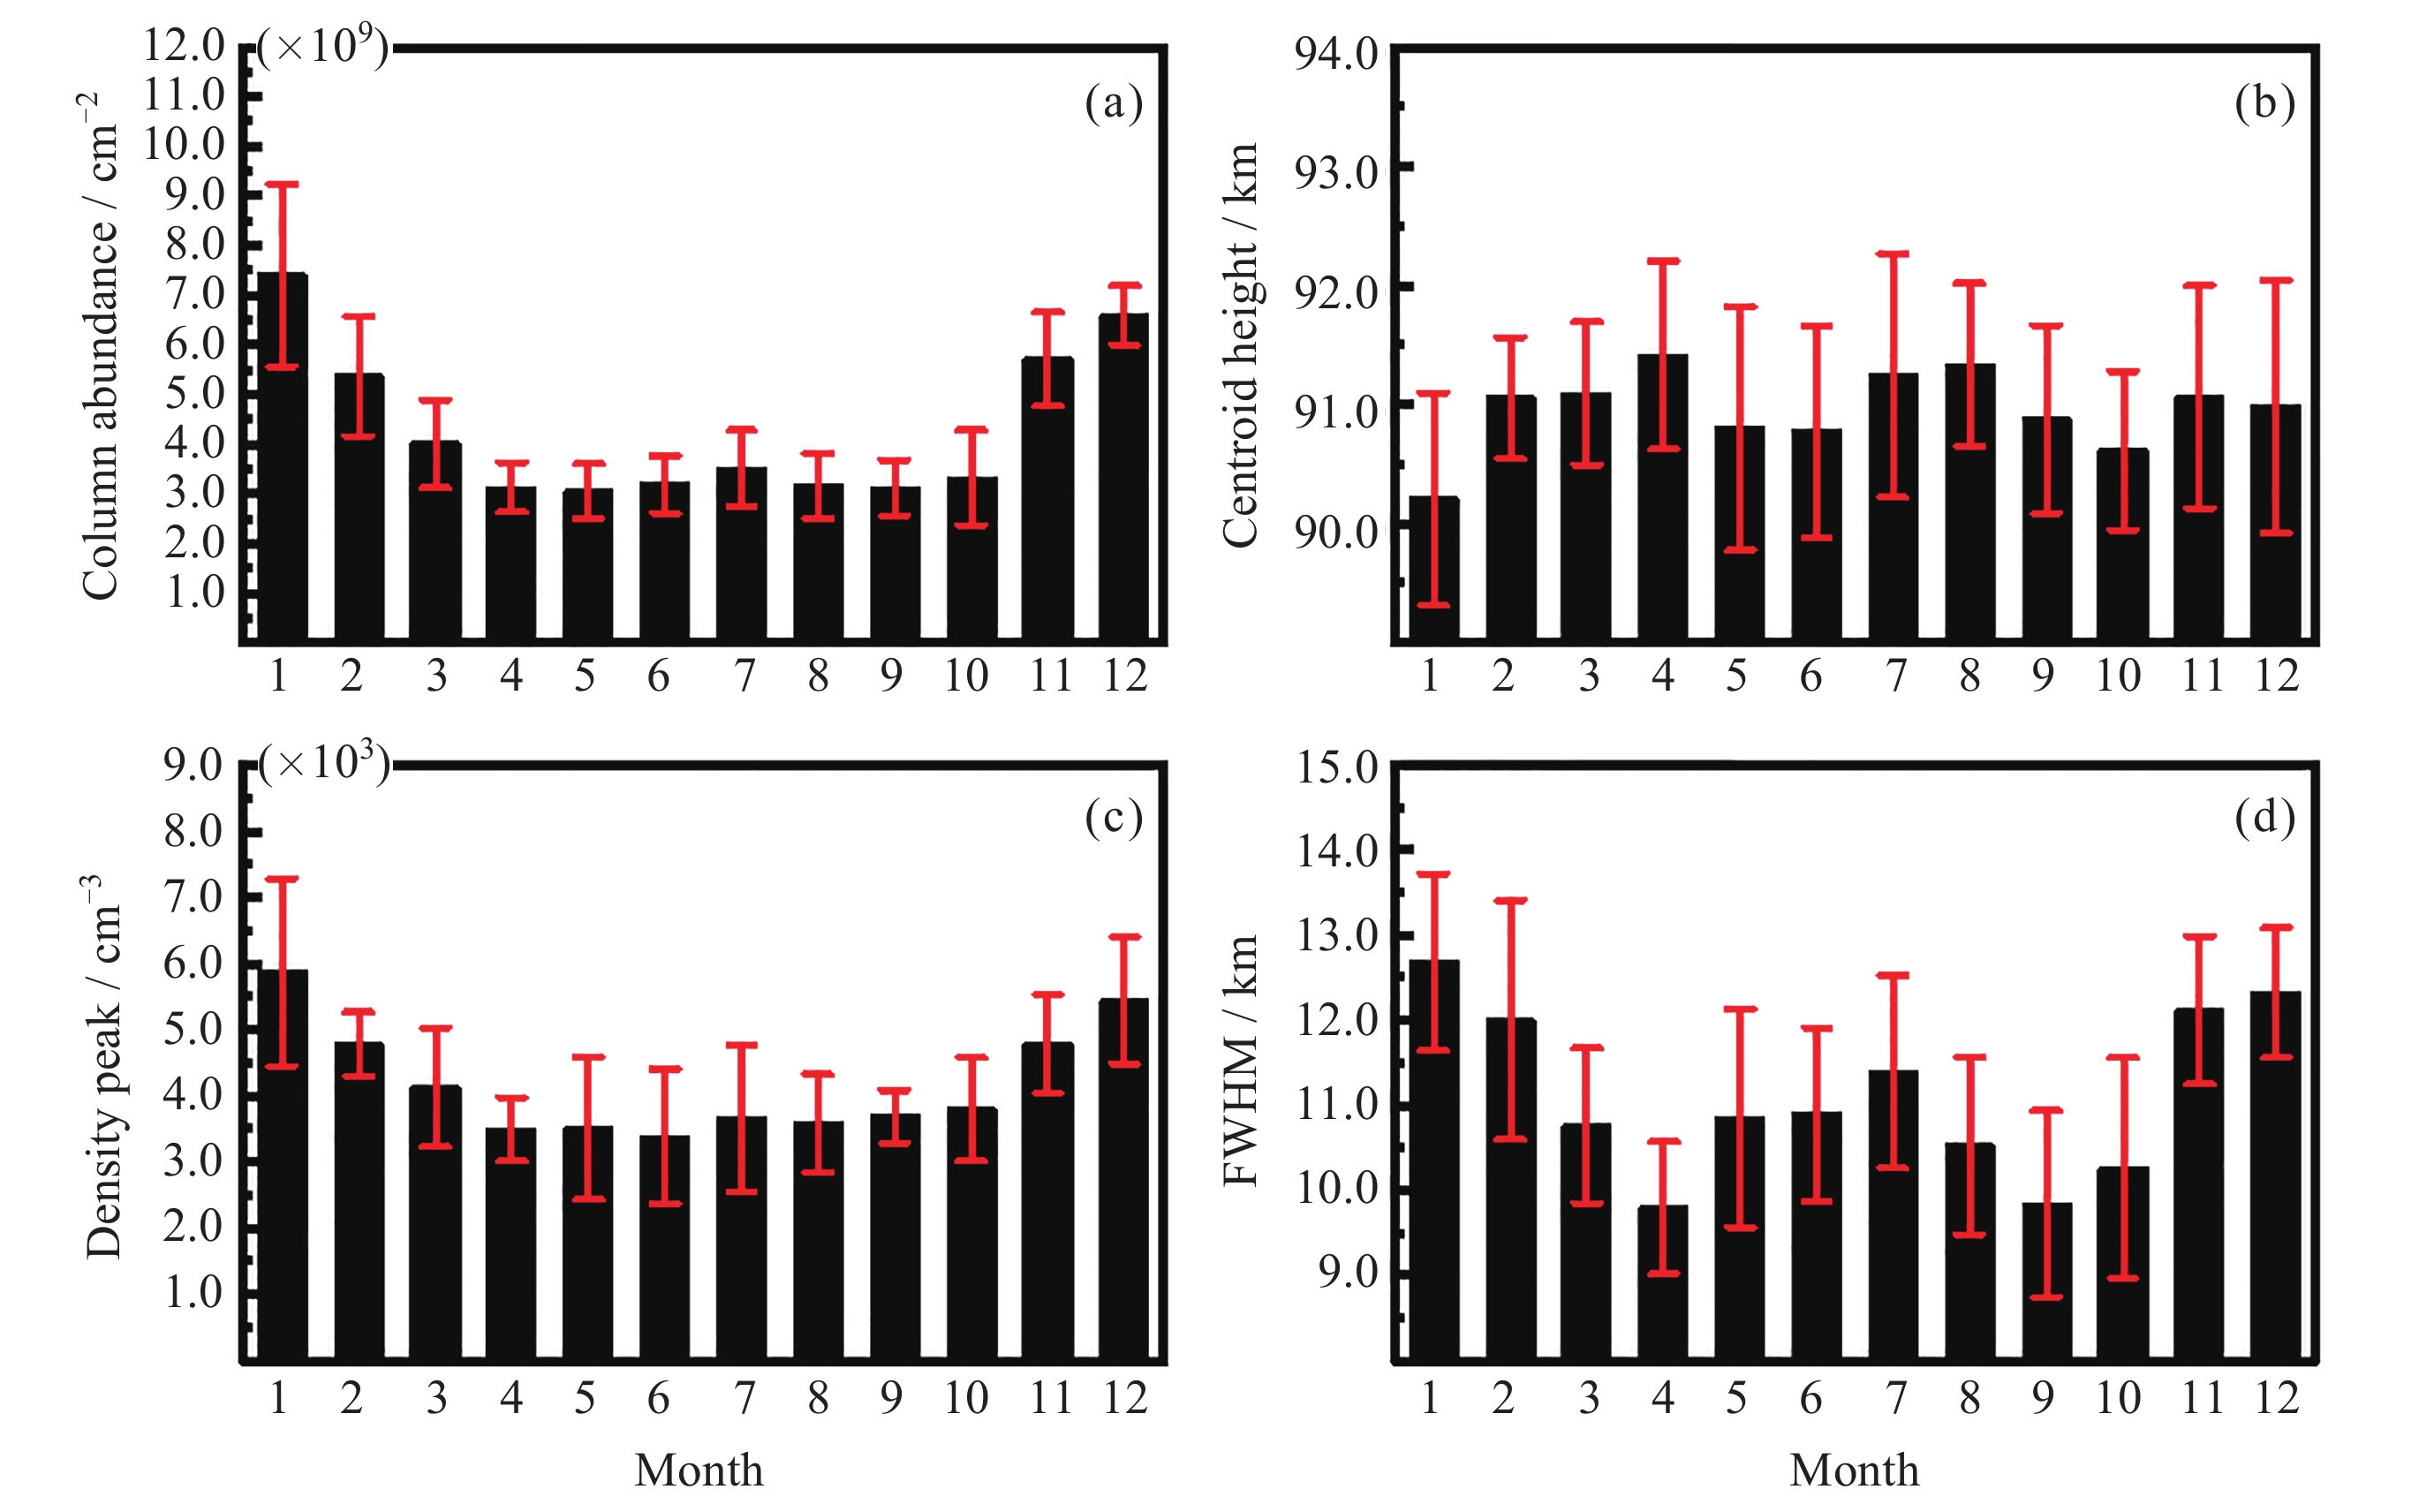
图 4 2020年北京及海口上空钠层柱密度 (a)、质心高度 (b)、密度峰值 (c) 和FWHM (d)的月变化曲线
Figure 4. Monthly averaged variations of the column abundance (a), centroid height (b), density peak value (c) and FWHM (d) over Beijing and Haikou in 2020
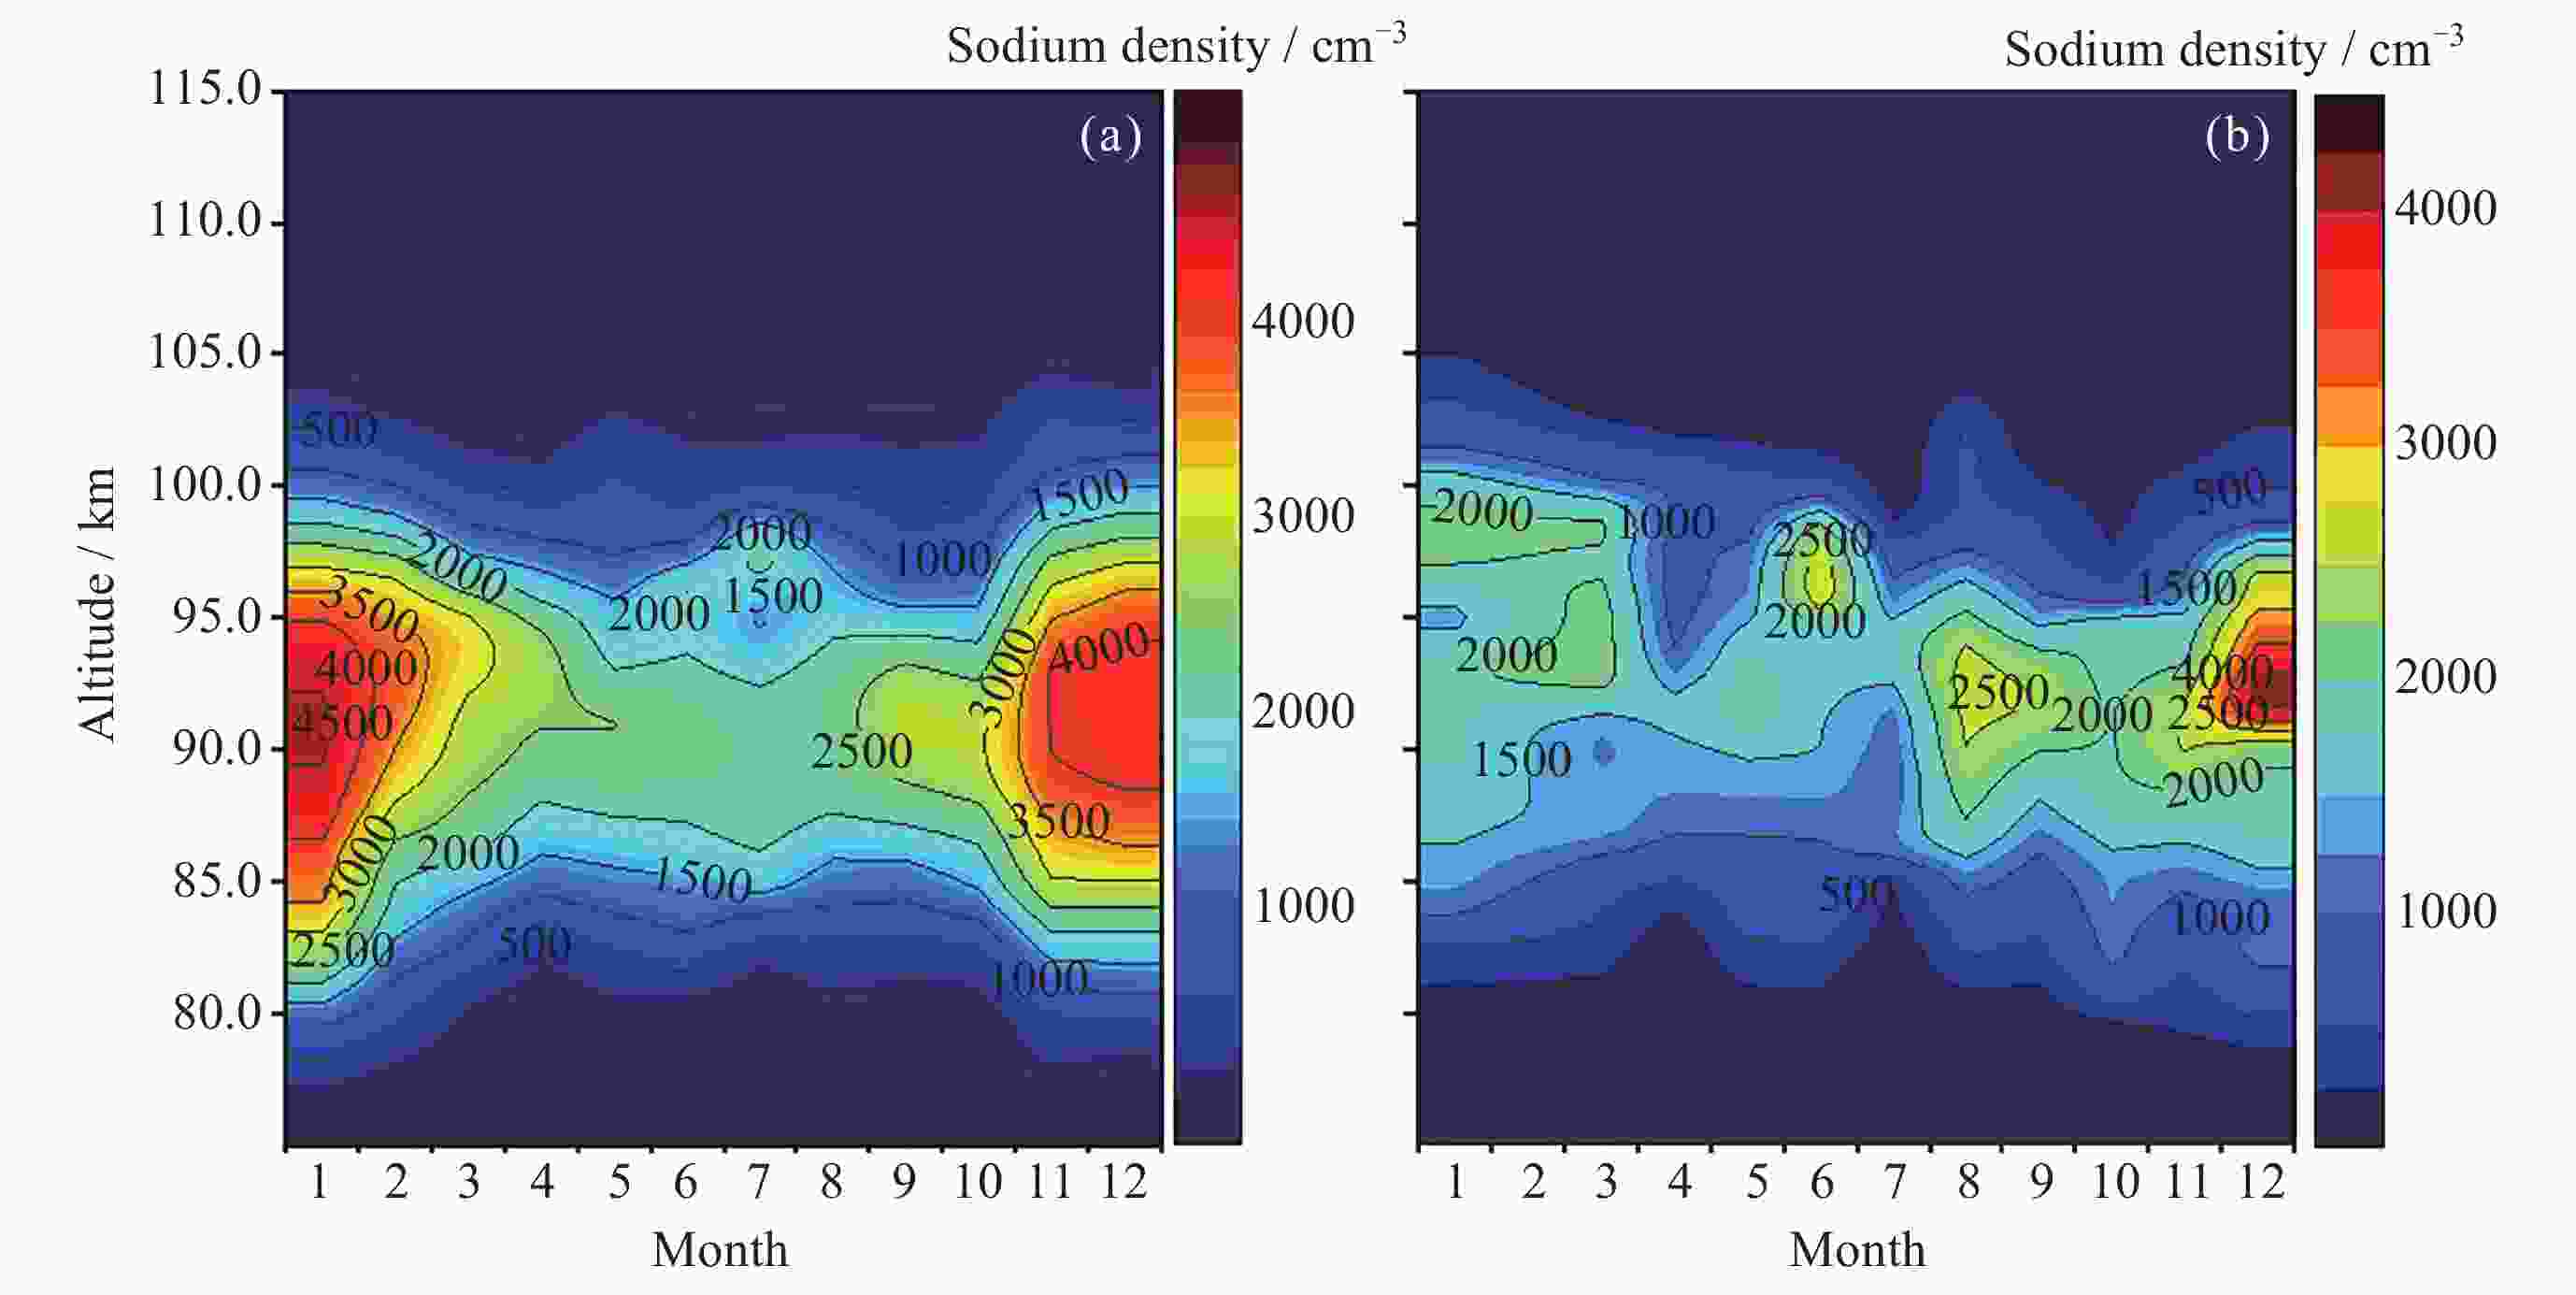
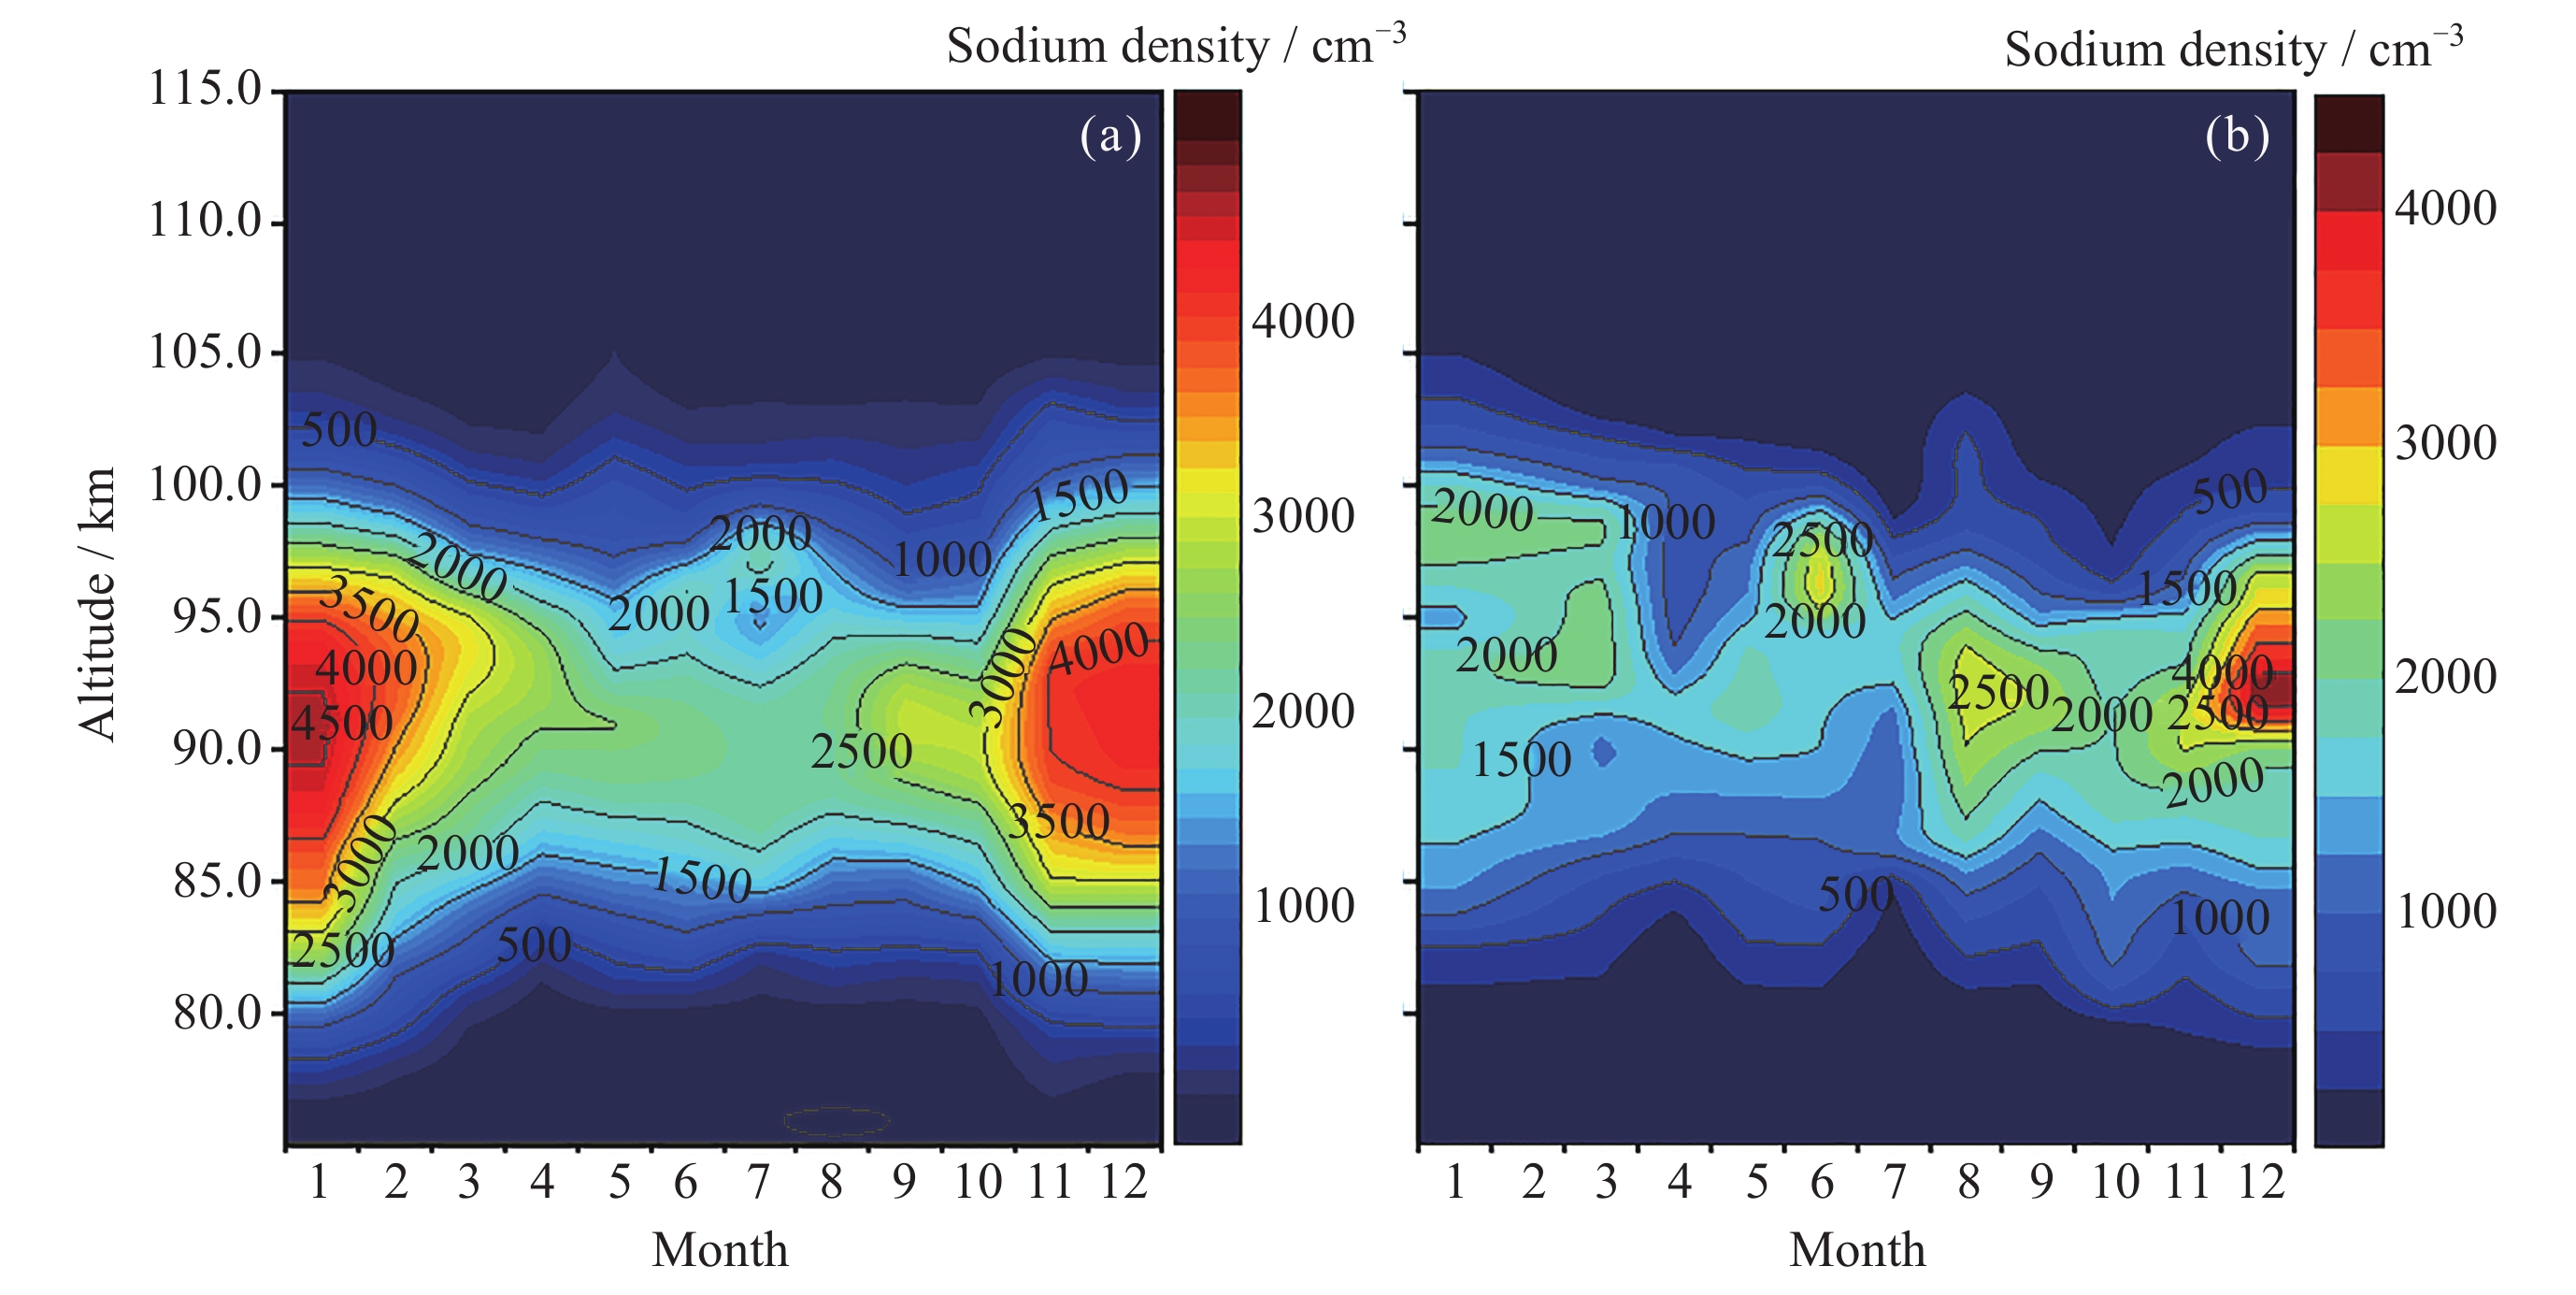
图 5 2020年北京 (a) 及海口 (b) 两地区上空月平均钠密度分布
Figure 5. Monthly average sodium density distribution over Beijing (a) and Haikou (b) in 2020
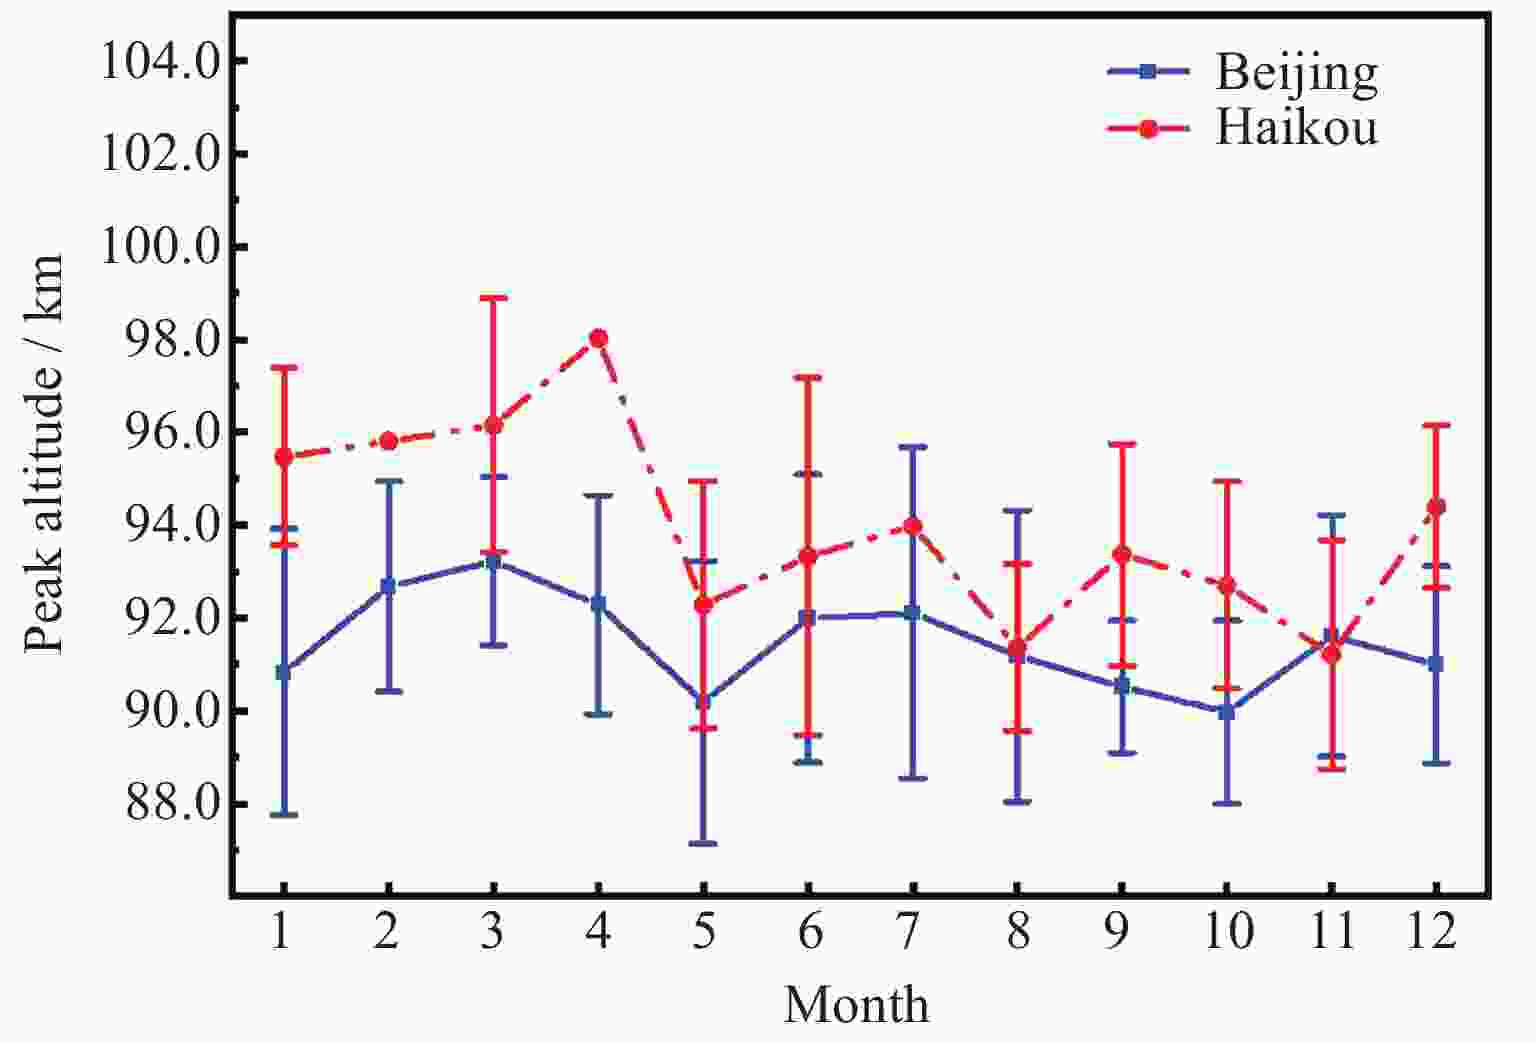
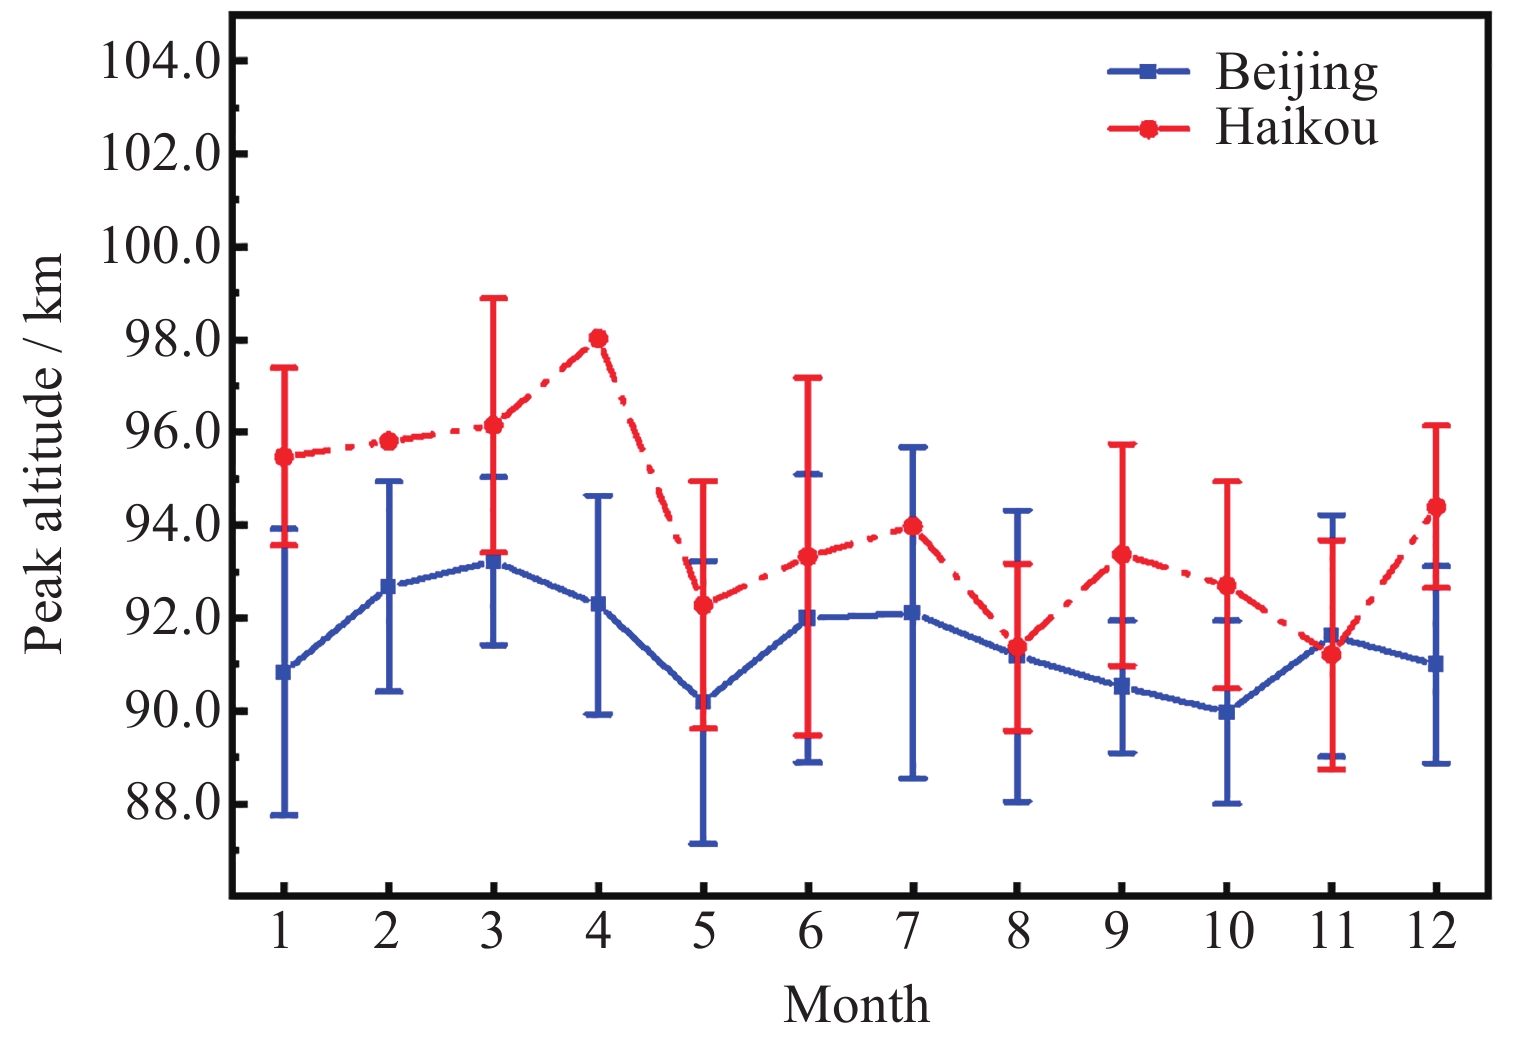
图 6 2020年北京及海口上空钠层峰值高度的月变化曲线
Figure 6. Monthly averaged variations of the peak altitude over Beijing and Haikou in 2020
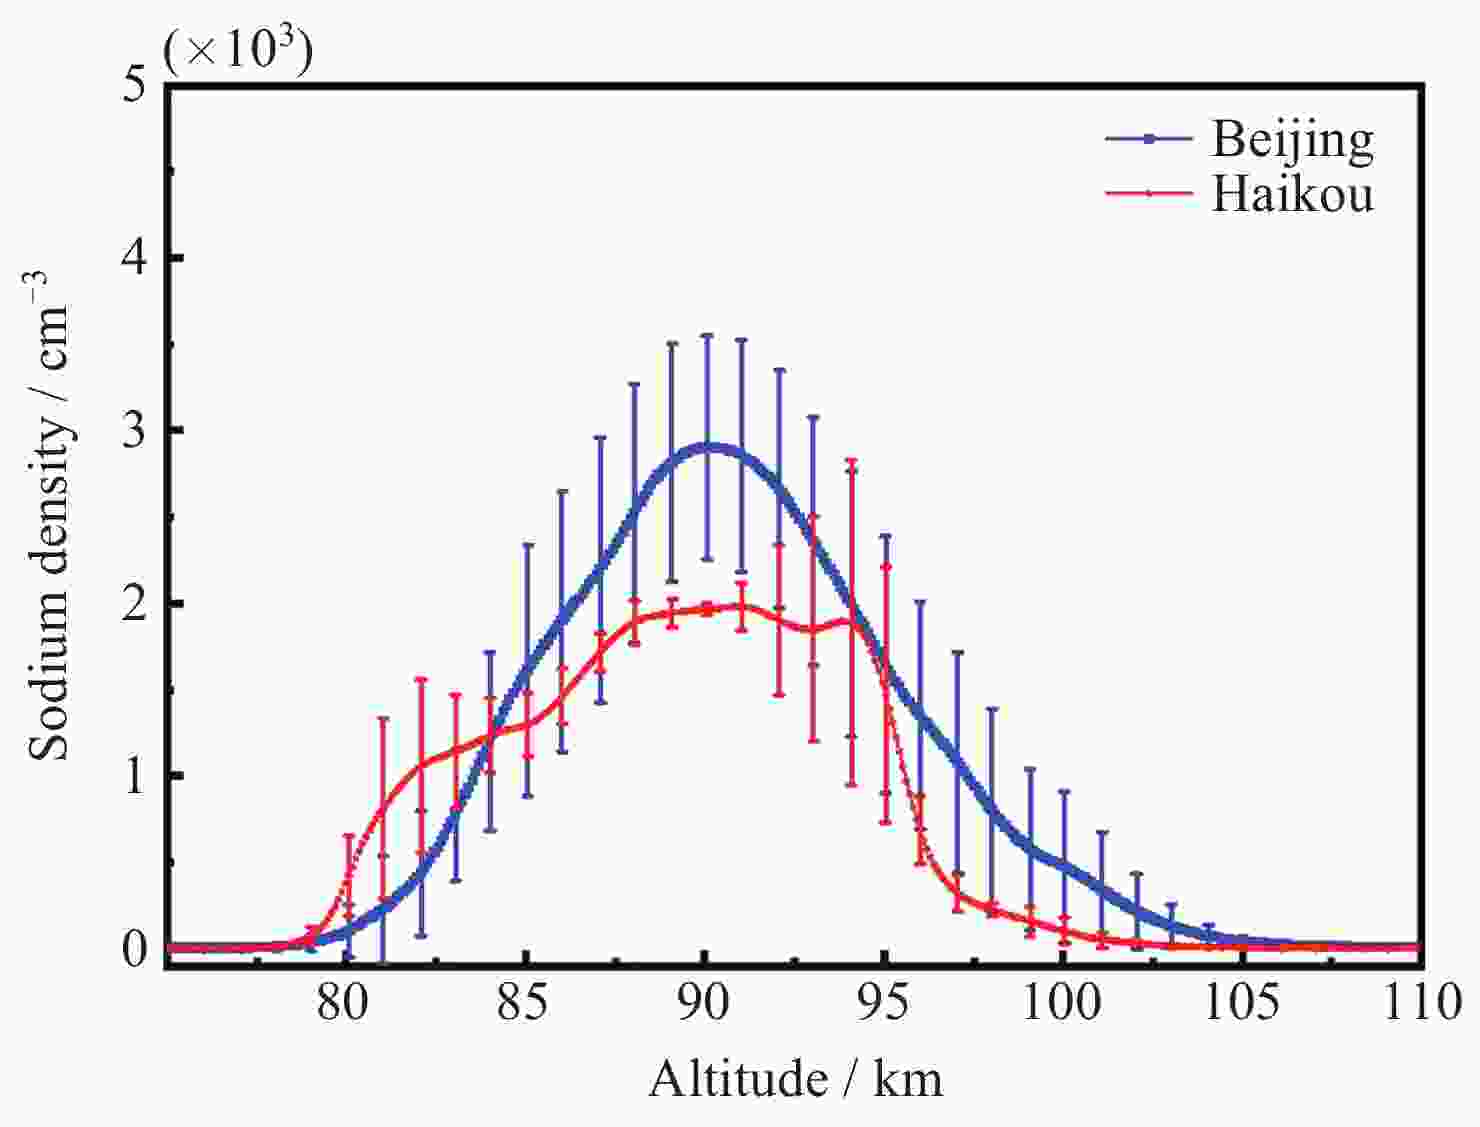
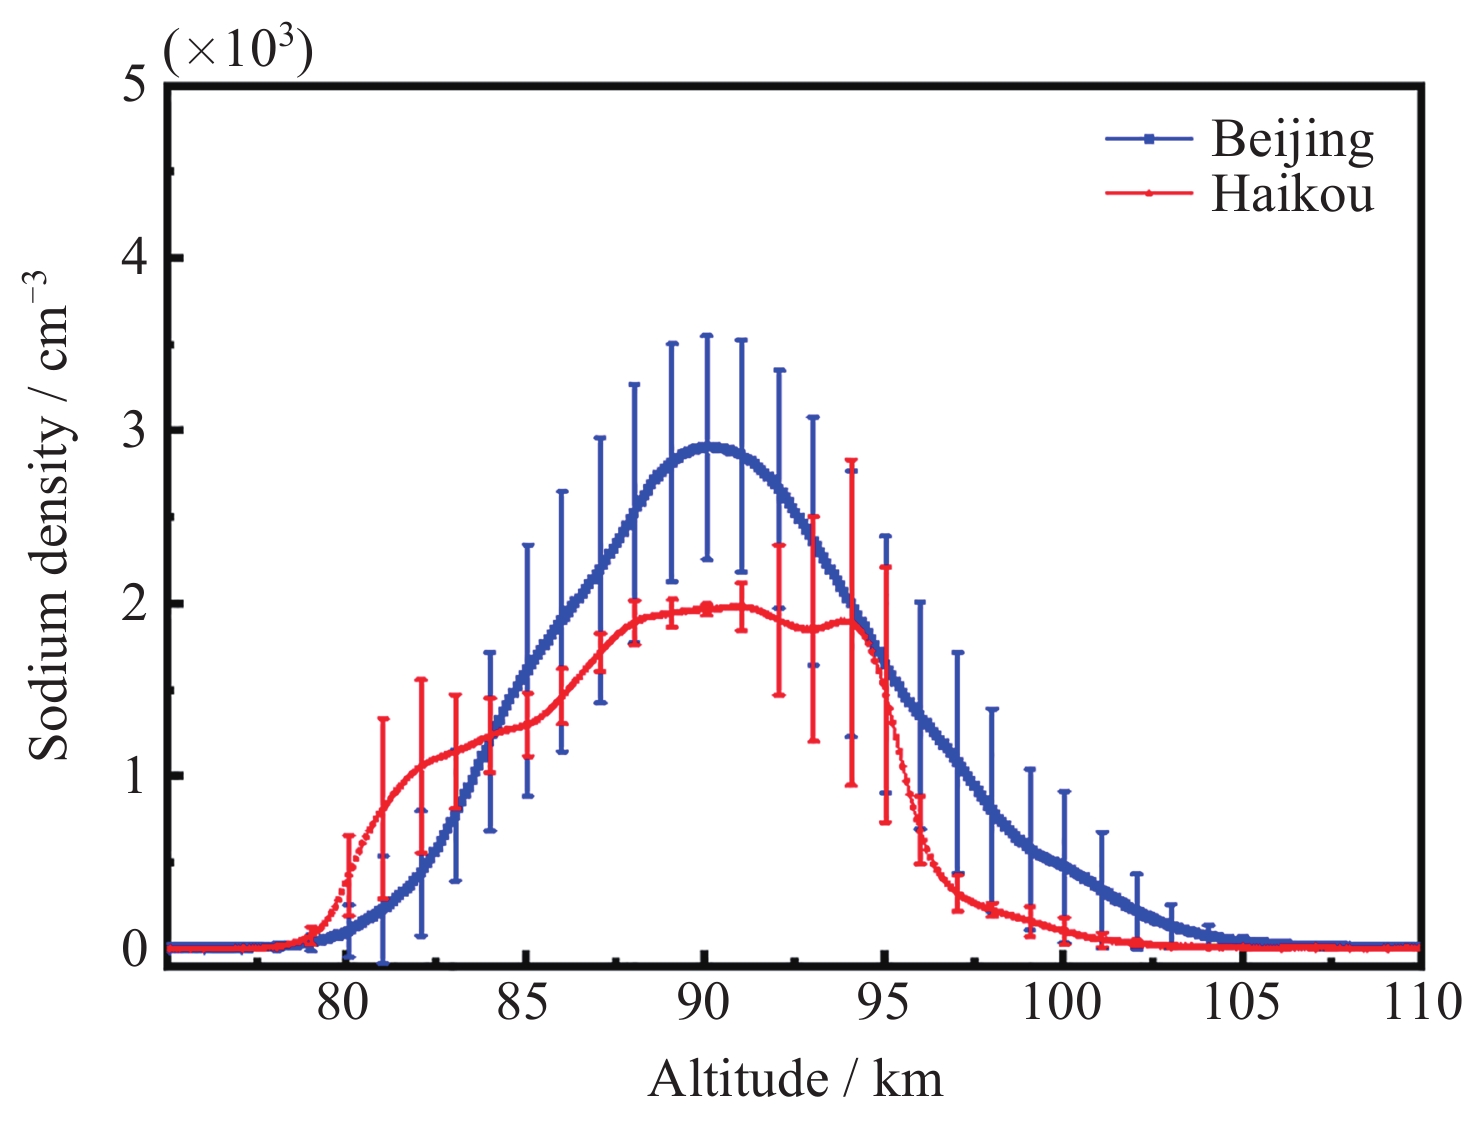
图 7 2020年10月北京和海口上空平均密度廓线
Figure 7. Average density profile over Beijing and Haikou in October 2020
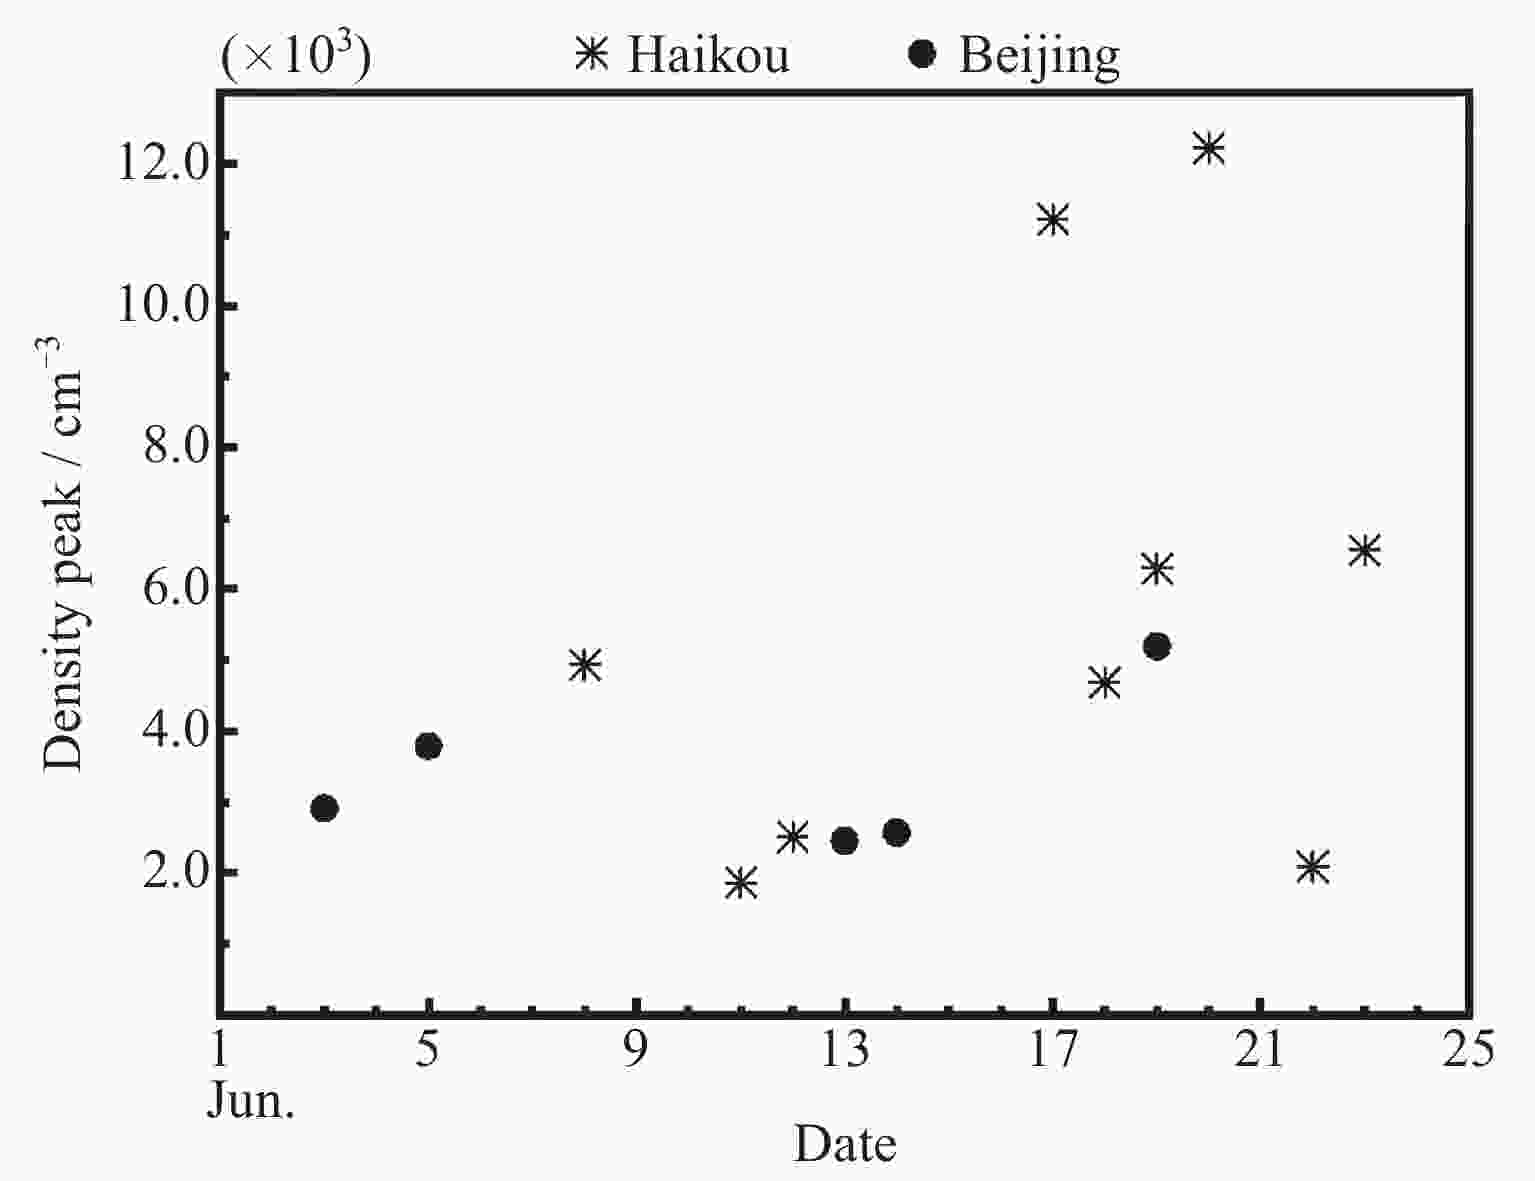
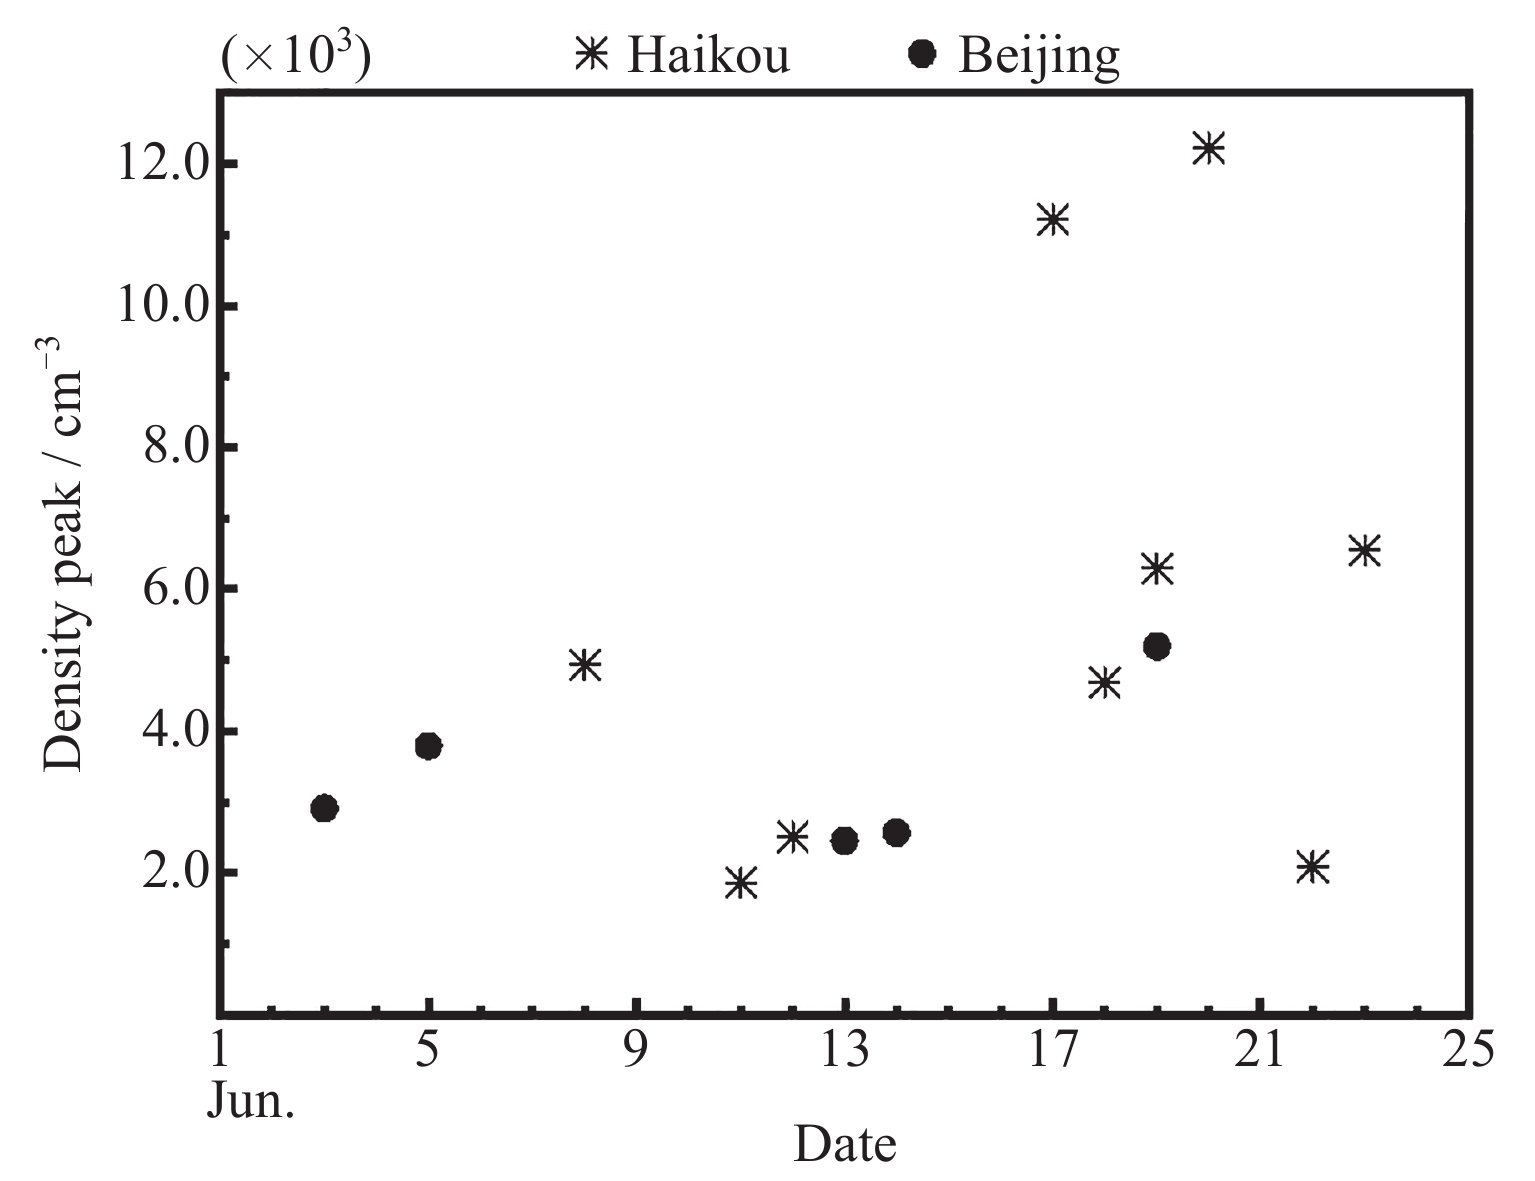
图 8 2020年6月海口和北京上空密度峰值分布
Figure 8. Density peak value distribution of sodium layer over Haikou and Beijing in June 2020
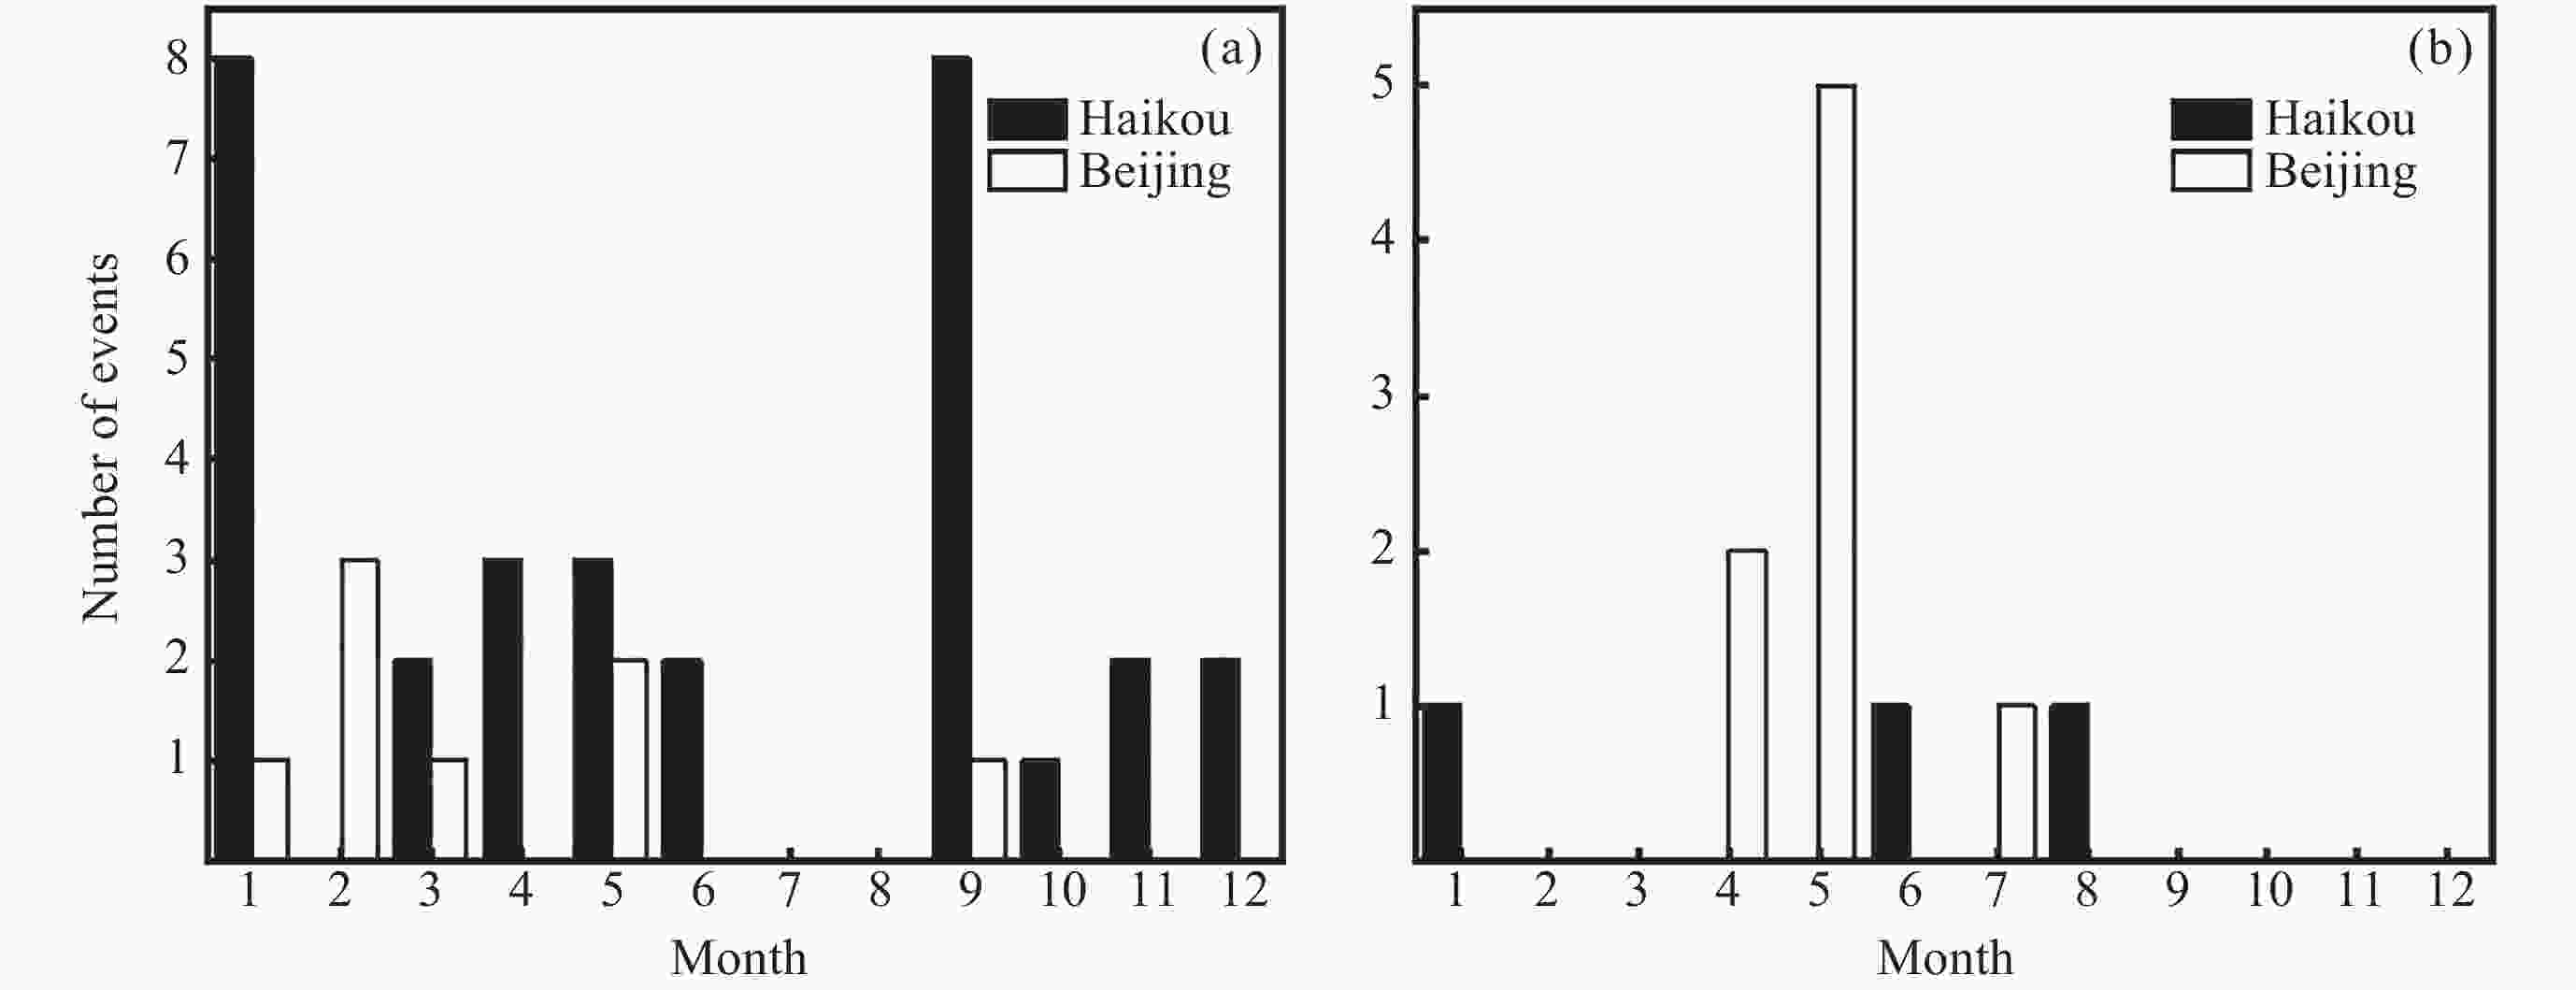
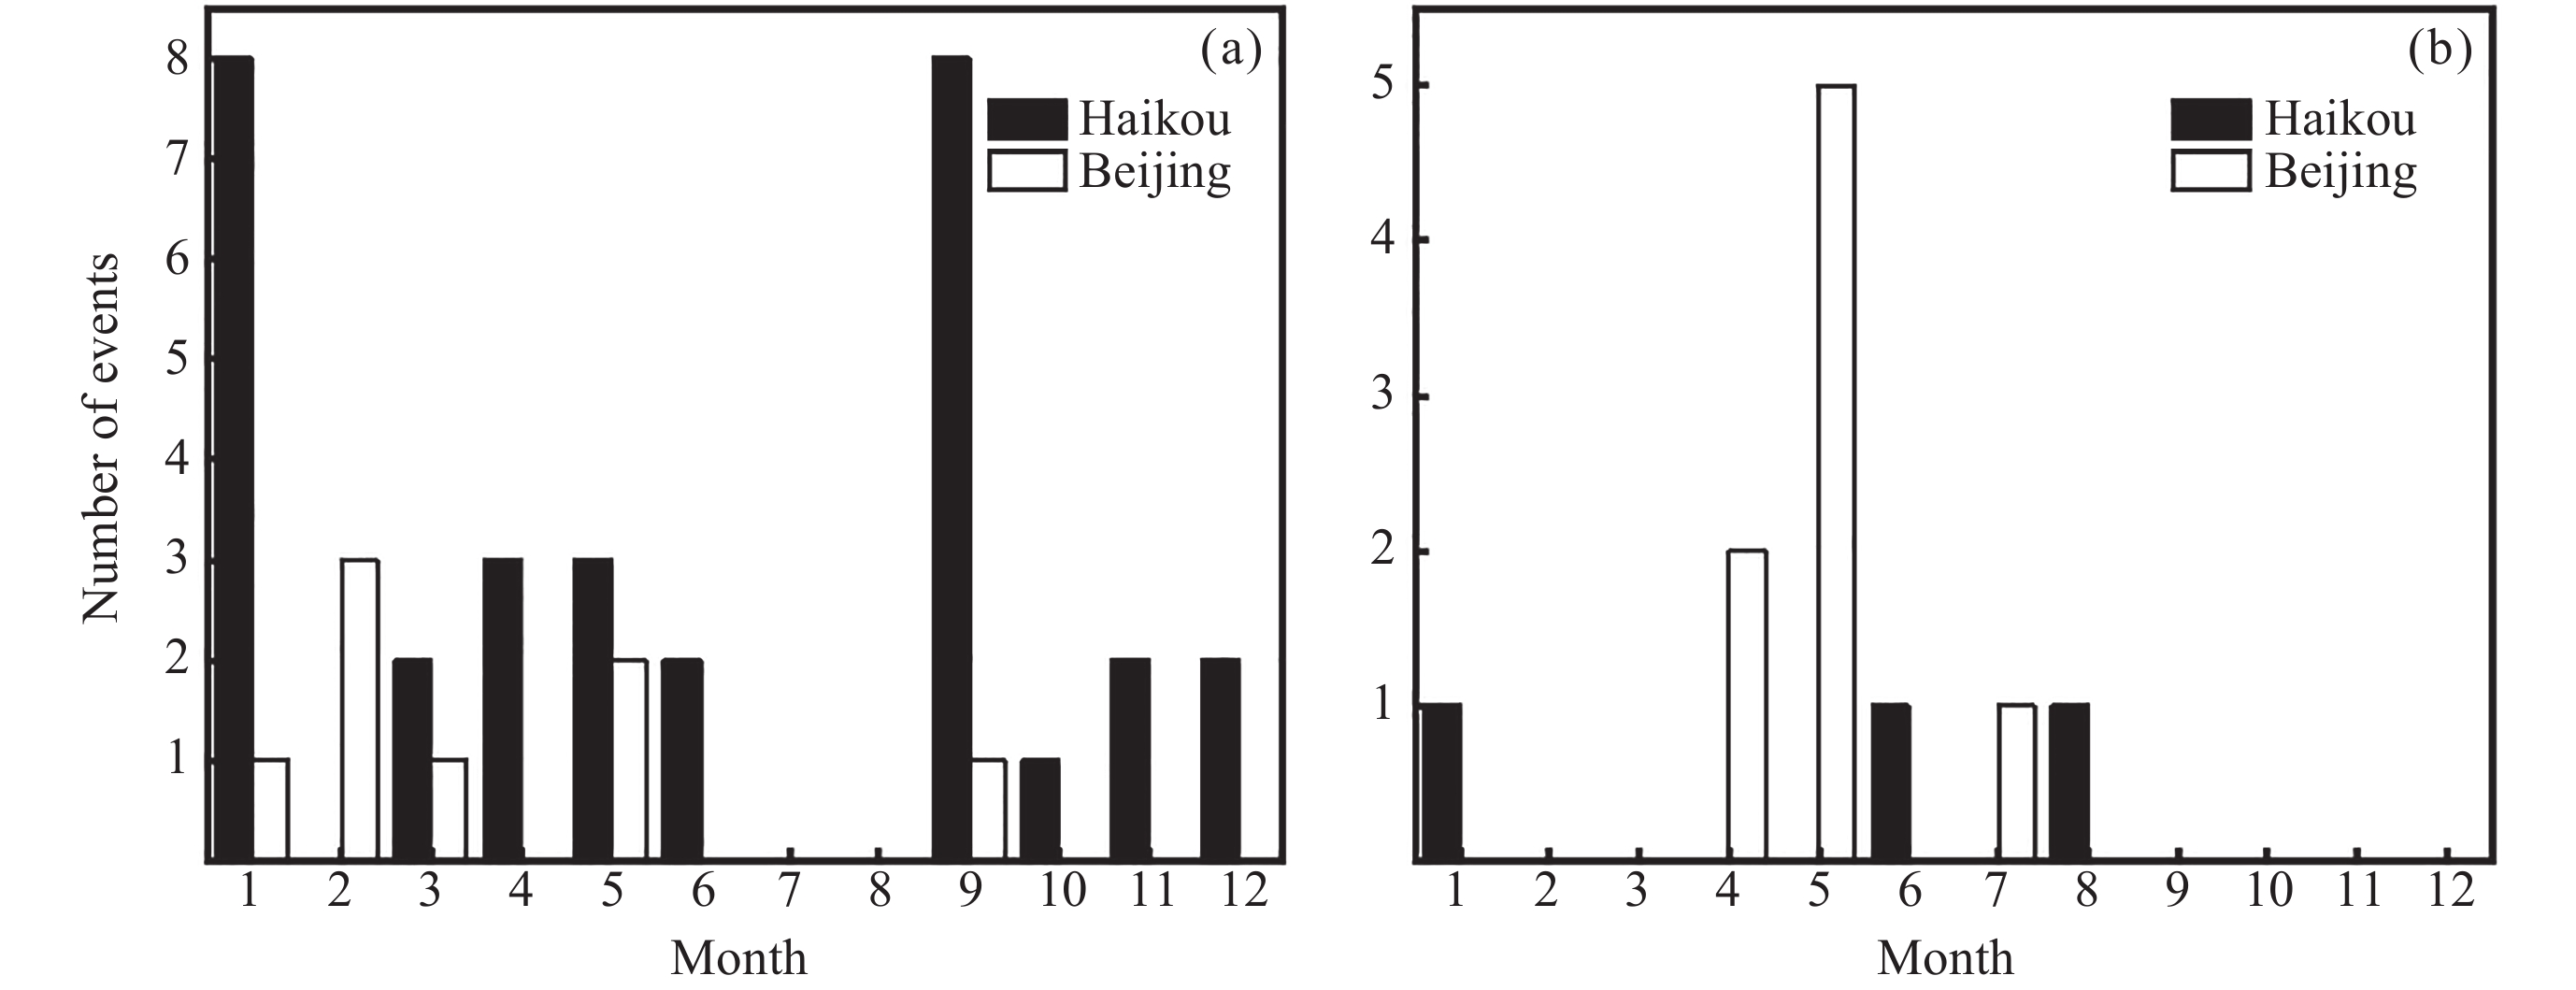
图 9 2020年海口和北京突发钠层(a)和双钠层事件(b)
Figure 9. Events of SSL (a) and DSL (b) over Haikou and Beijing in 2020
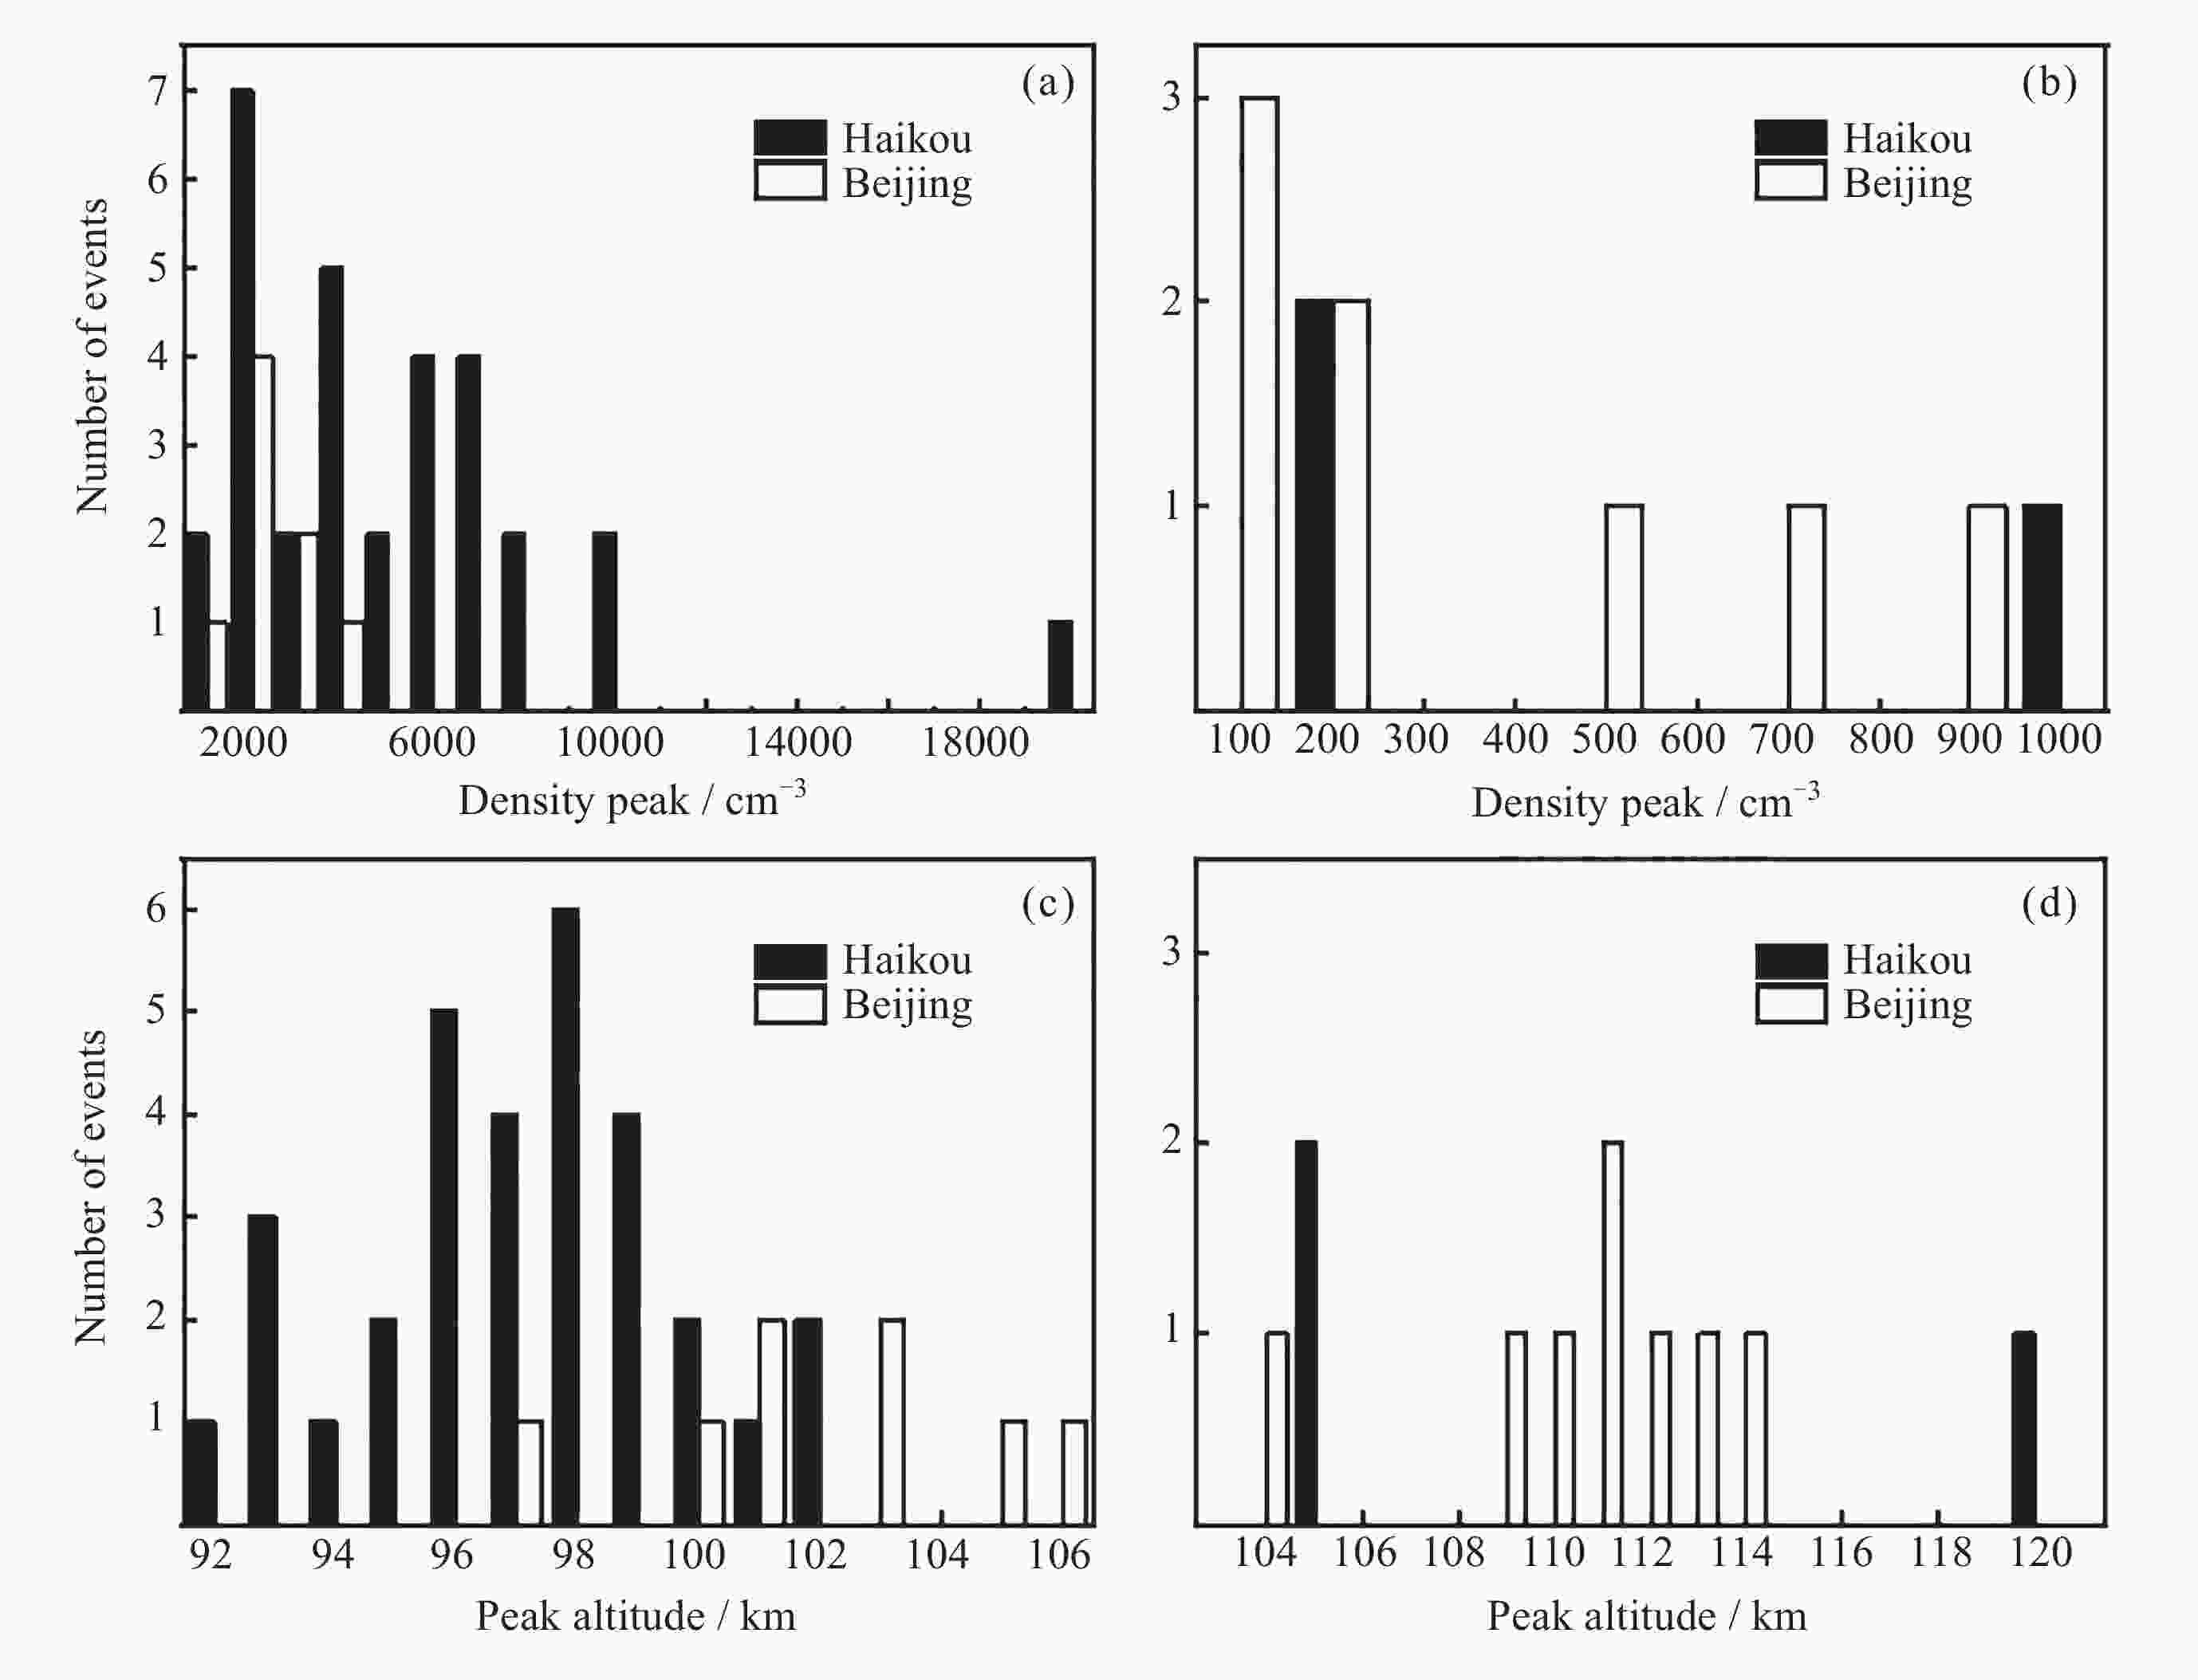
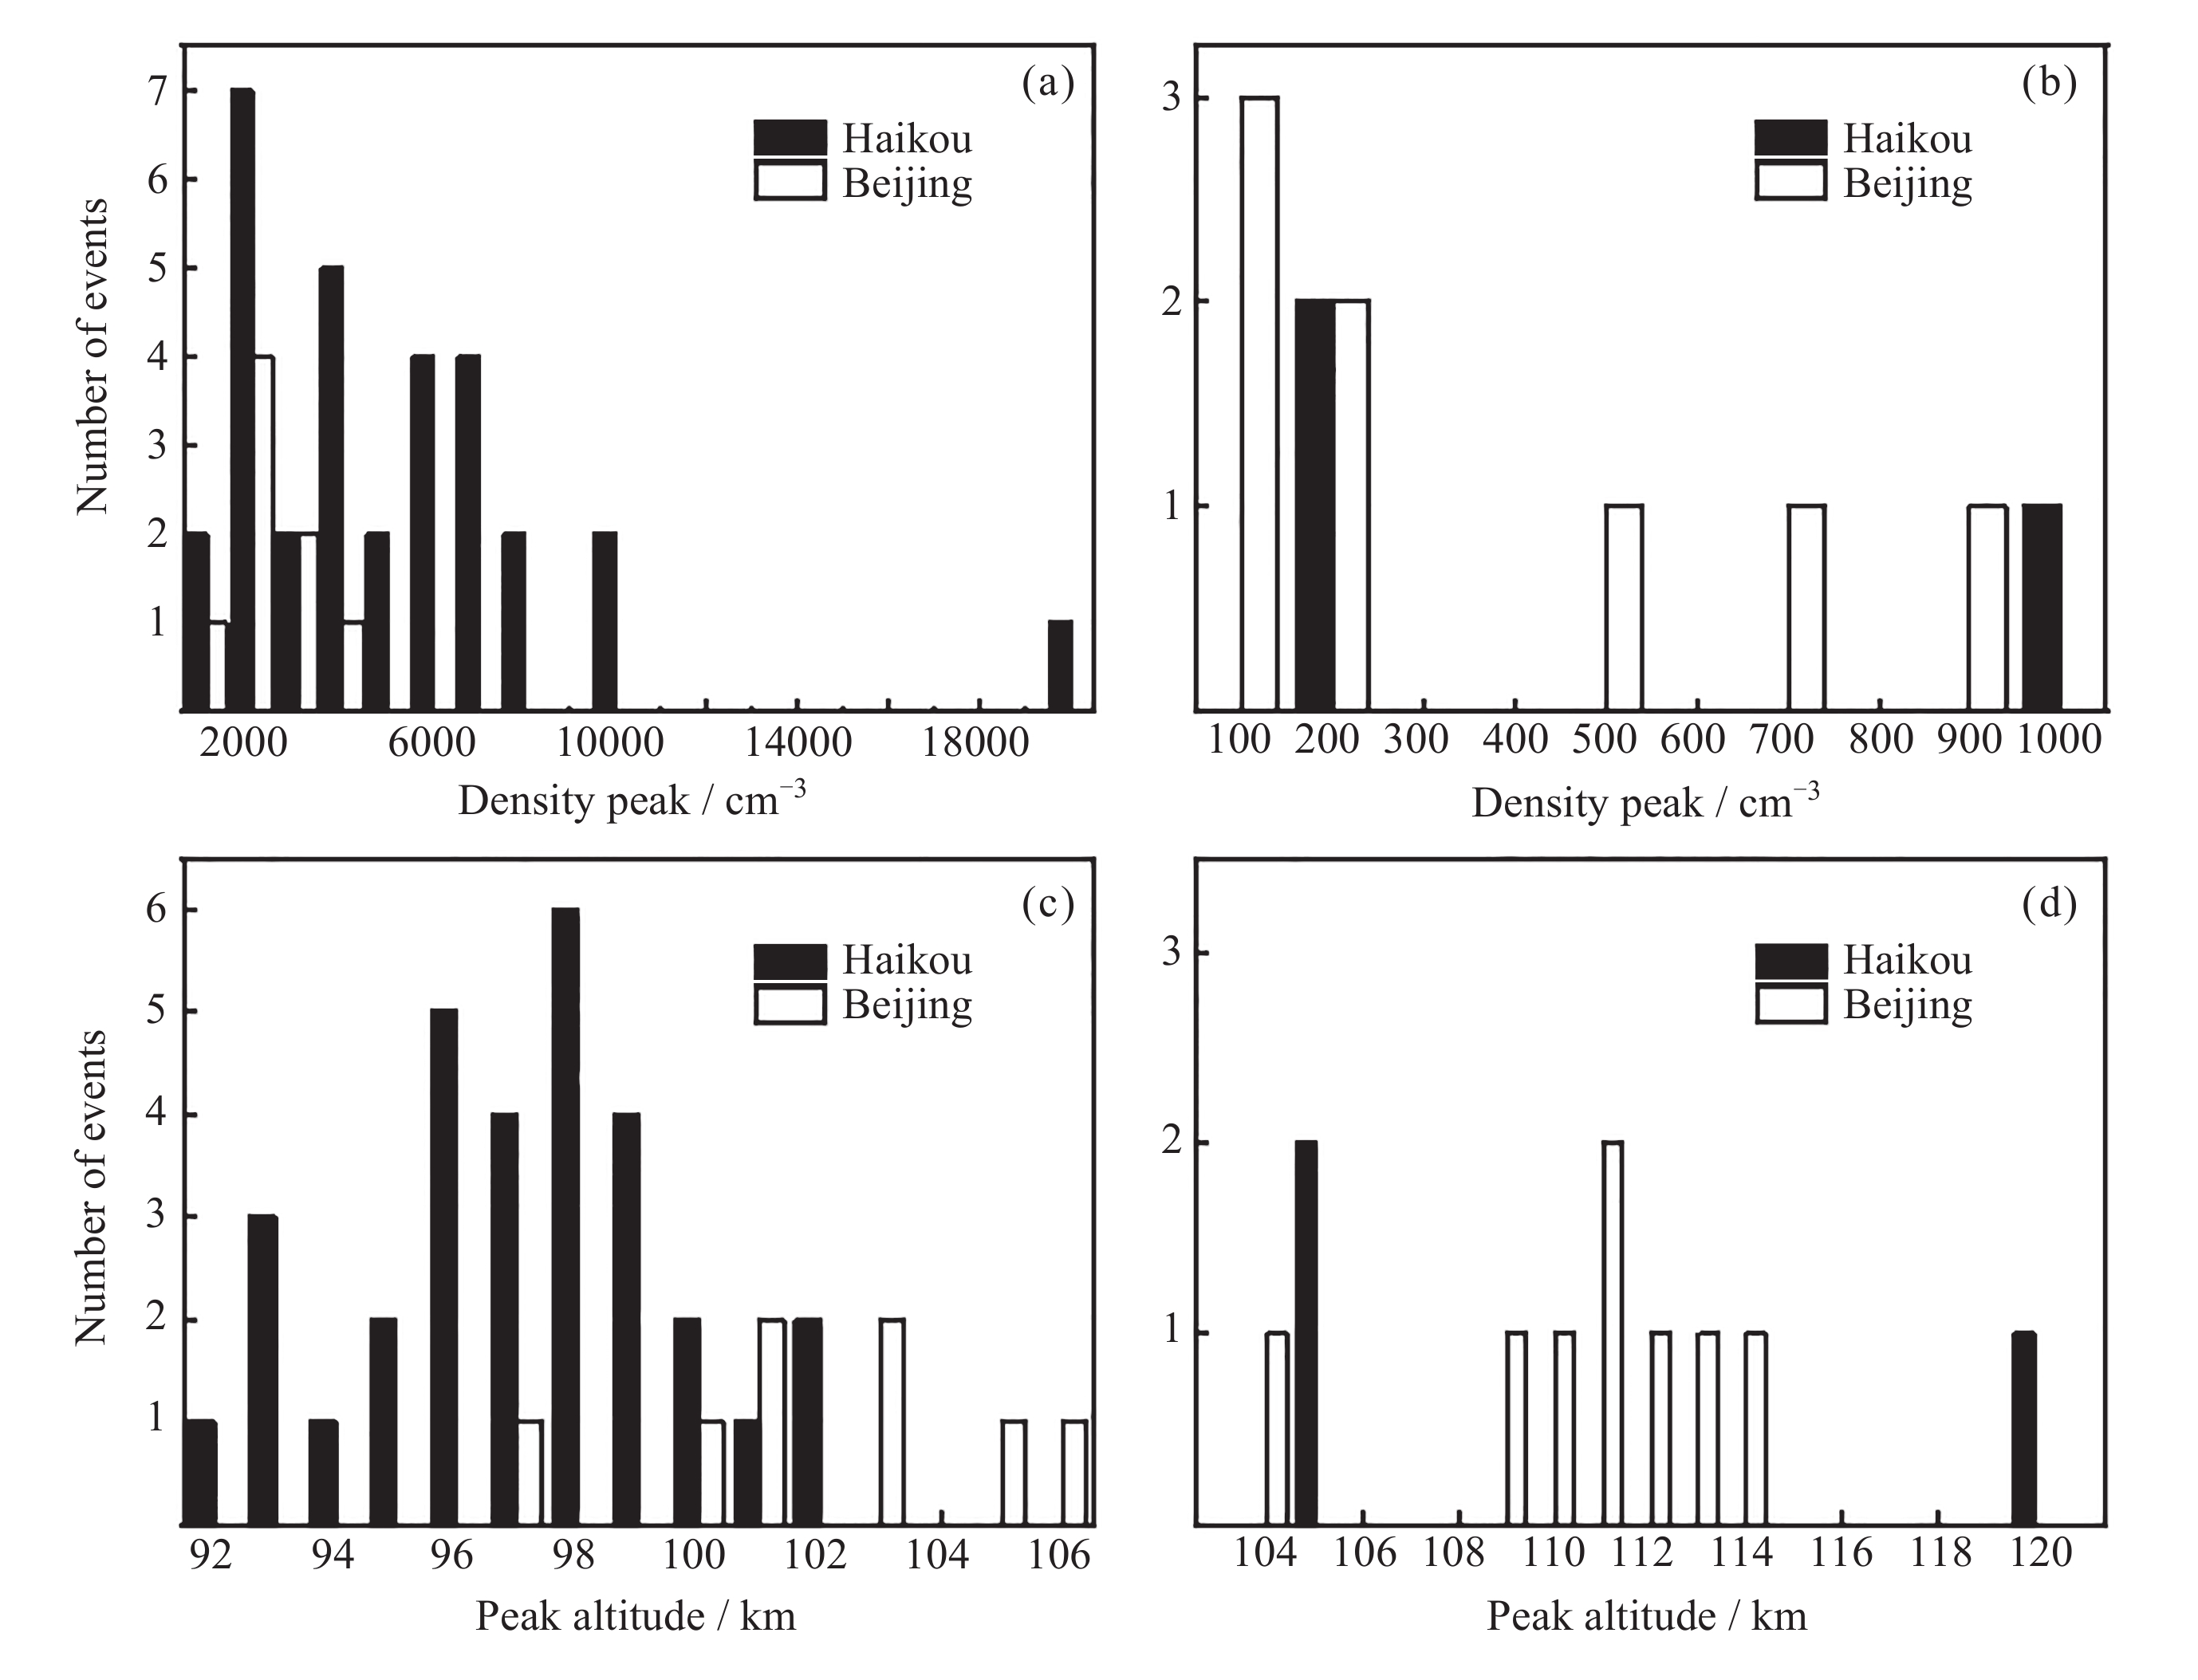
图 10 2020年海口和北京两地的突发钠层 (a)(c) 及双钠层事件 (b)(d) 密度峰值及峰值高度分布
Figure 10. Density peak value and peak altitude distribution of SSL (a)(c) and DSL (b)(d) over Haikou and Beijing in 2020
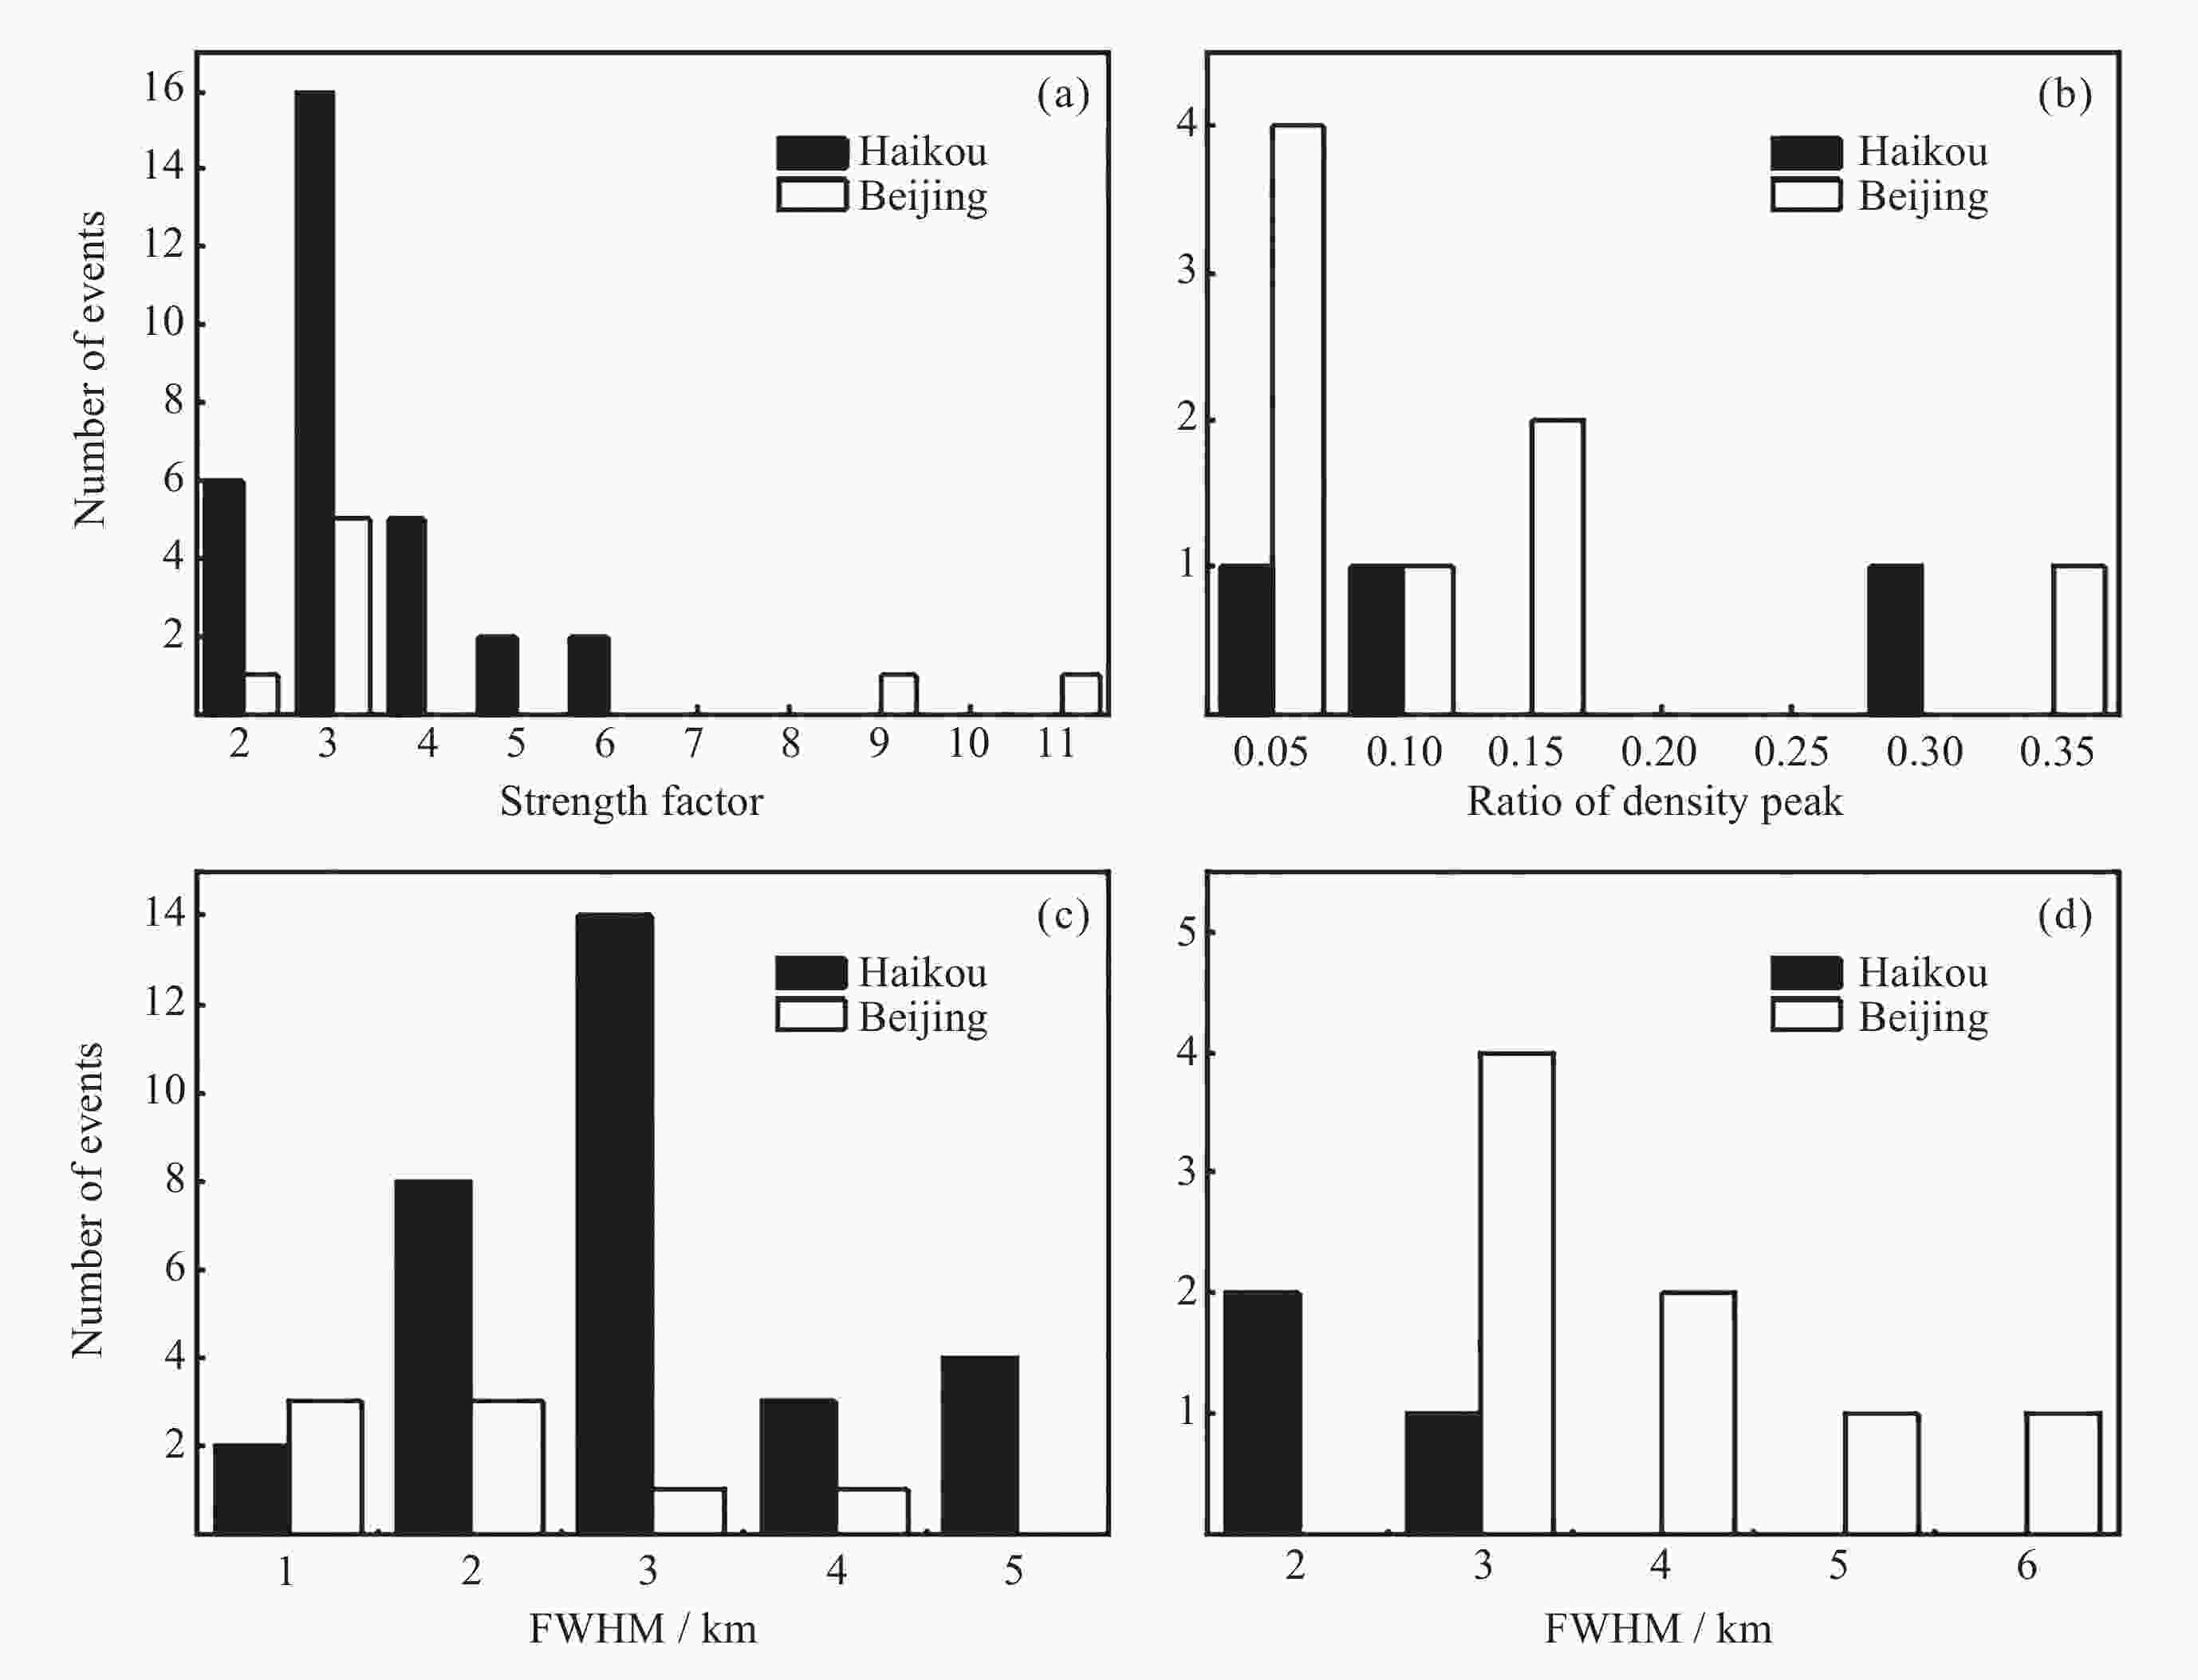
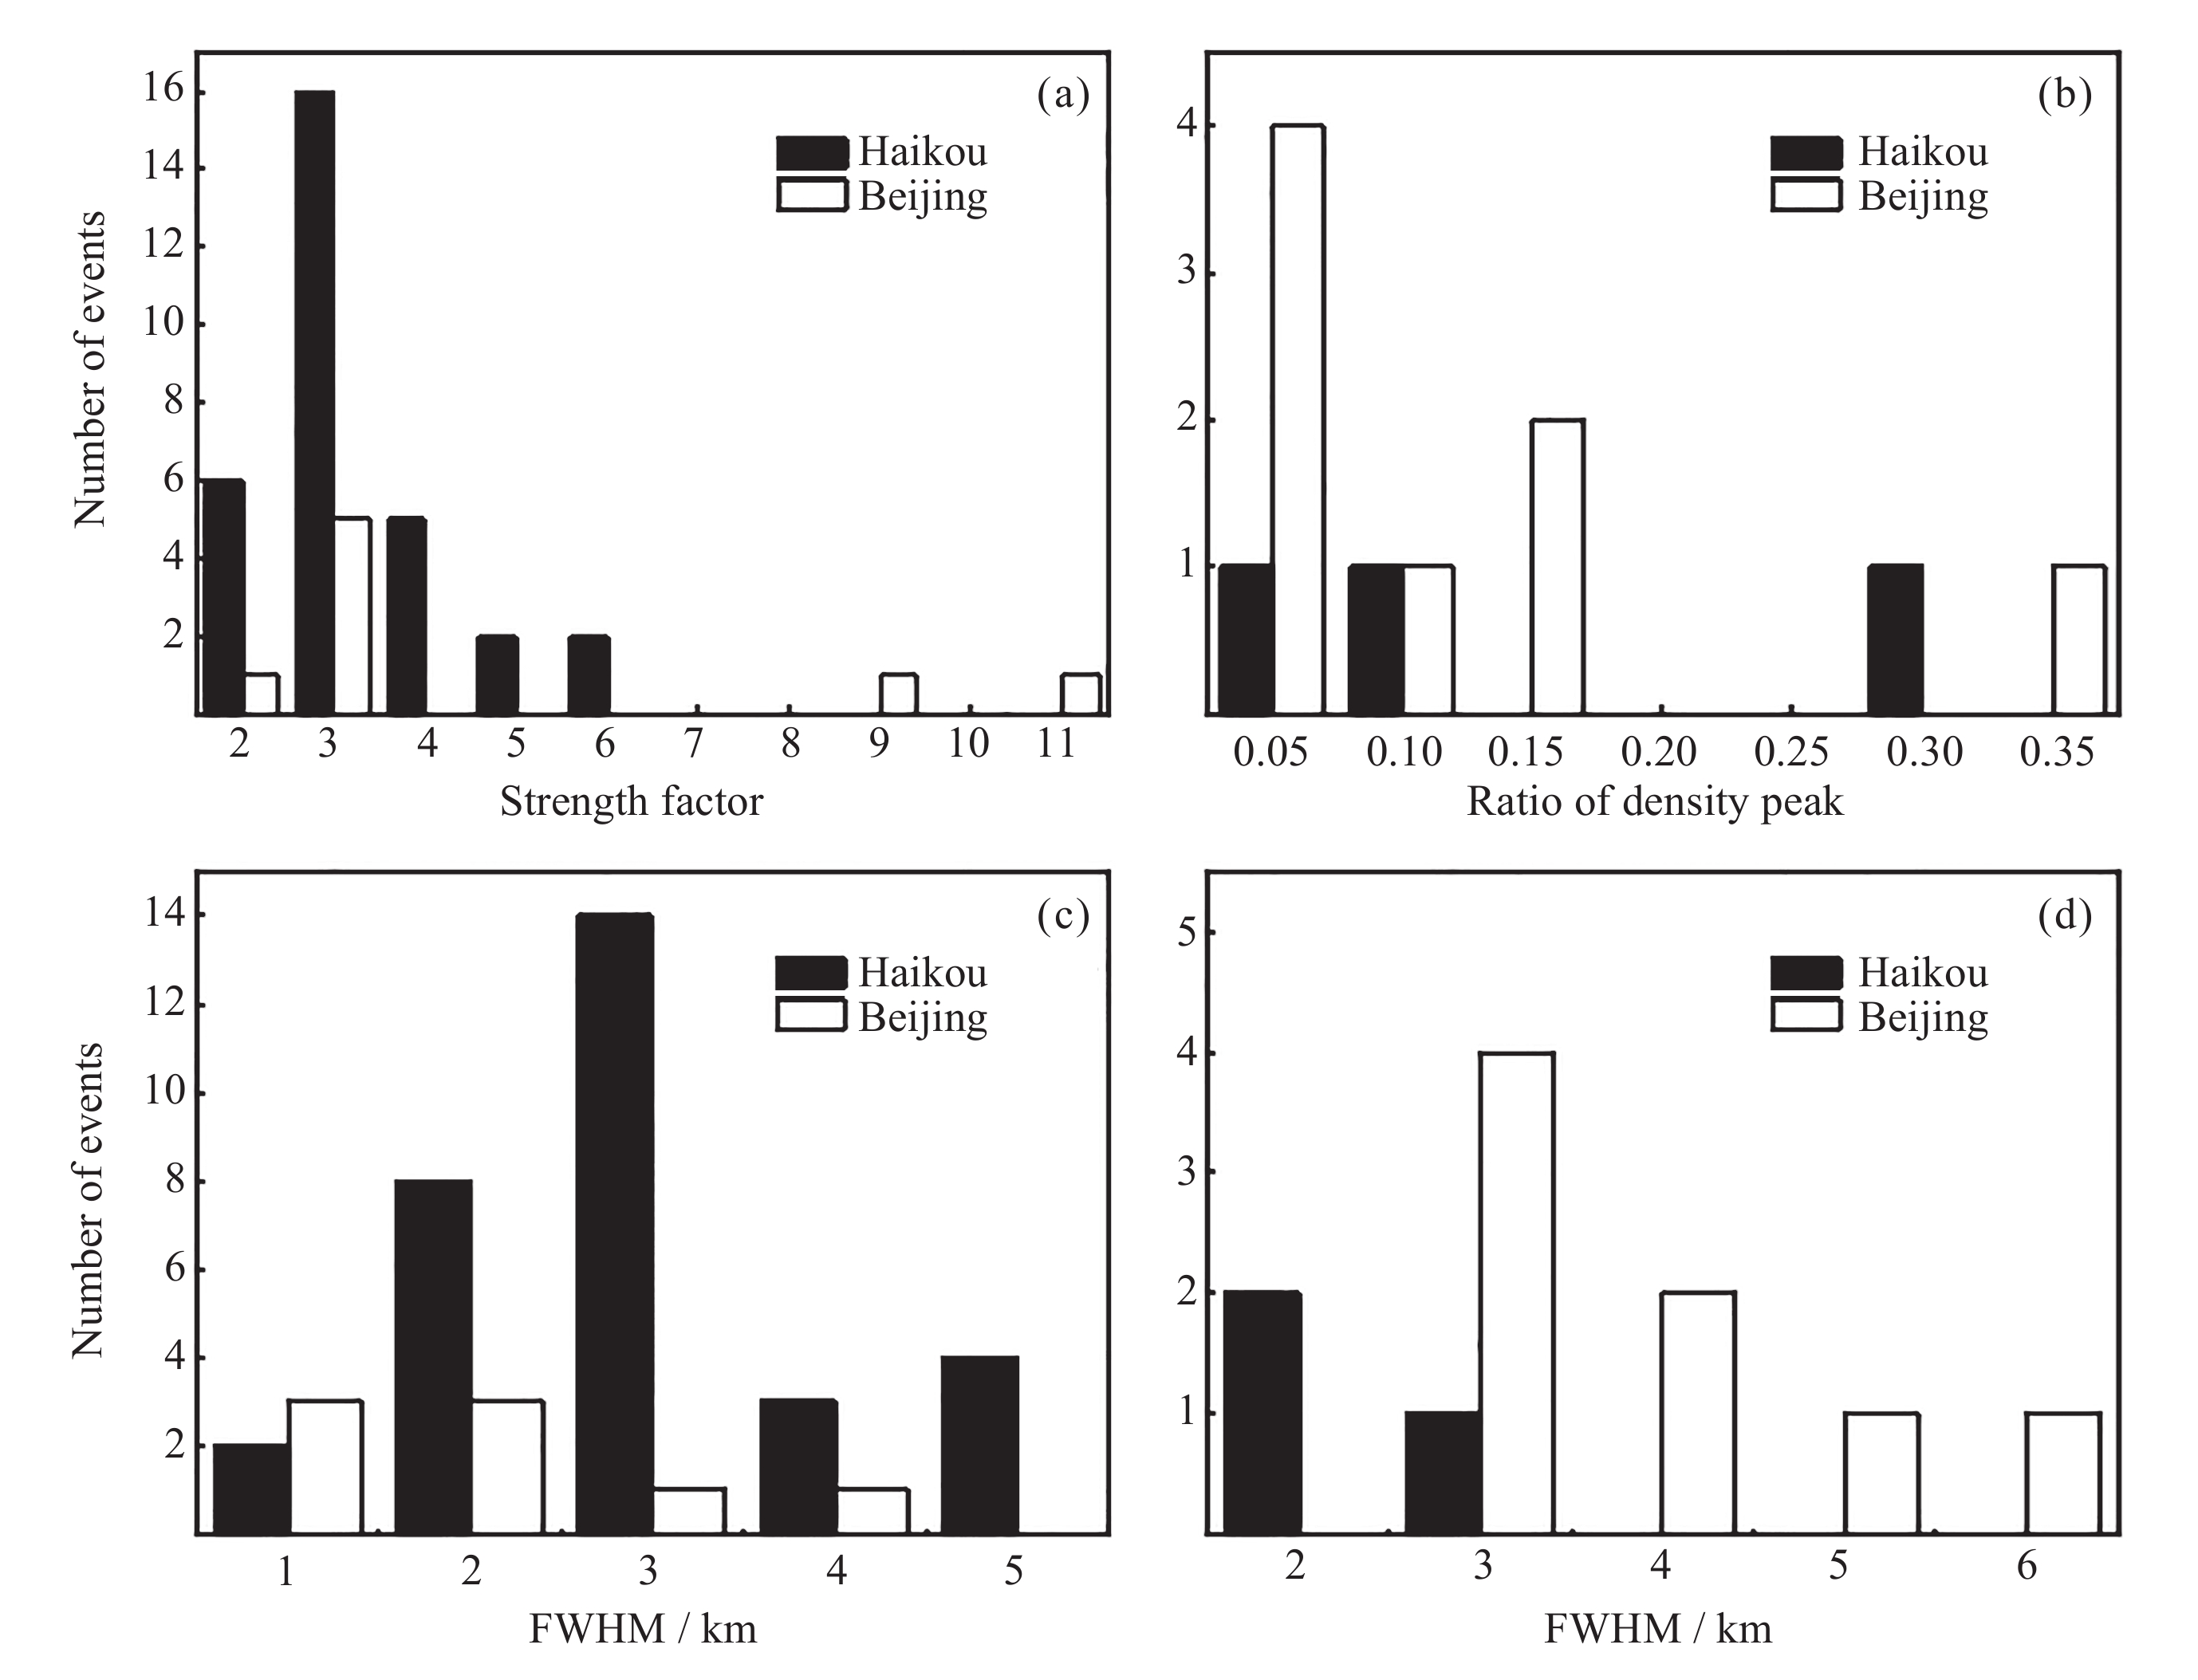
图 11 2020年海口和北京两地的突发钠层 (a)(c) 及双钠层 (b)(d) 事件统计参数
Figure 11. Main parameters of SSL (a)(c) and DSL (b)(d) over Haikou and Beijing in 2020
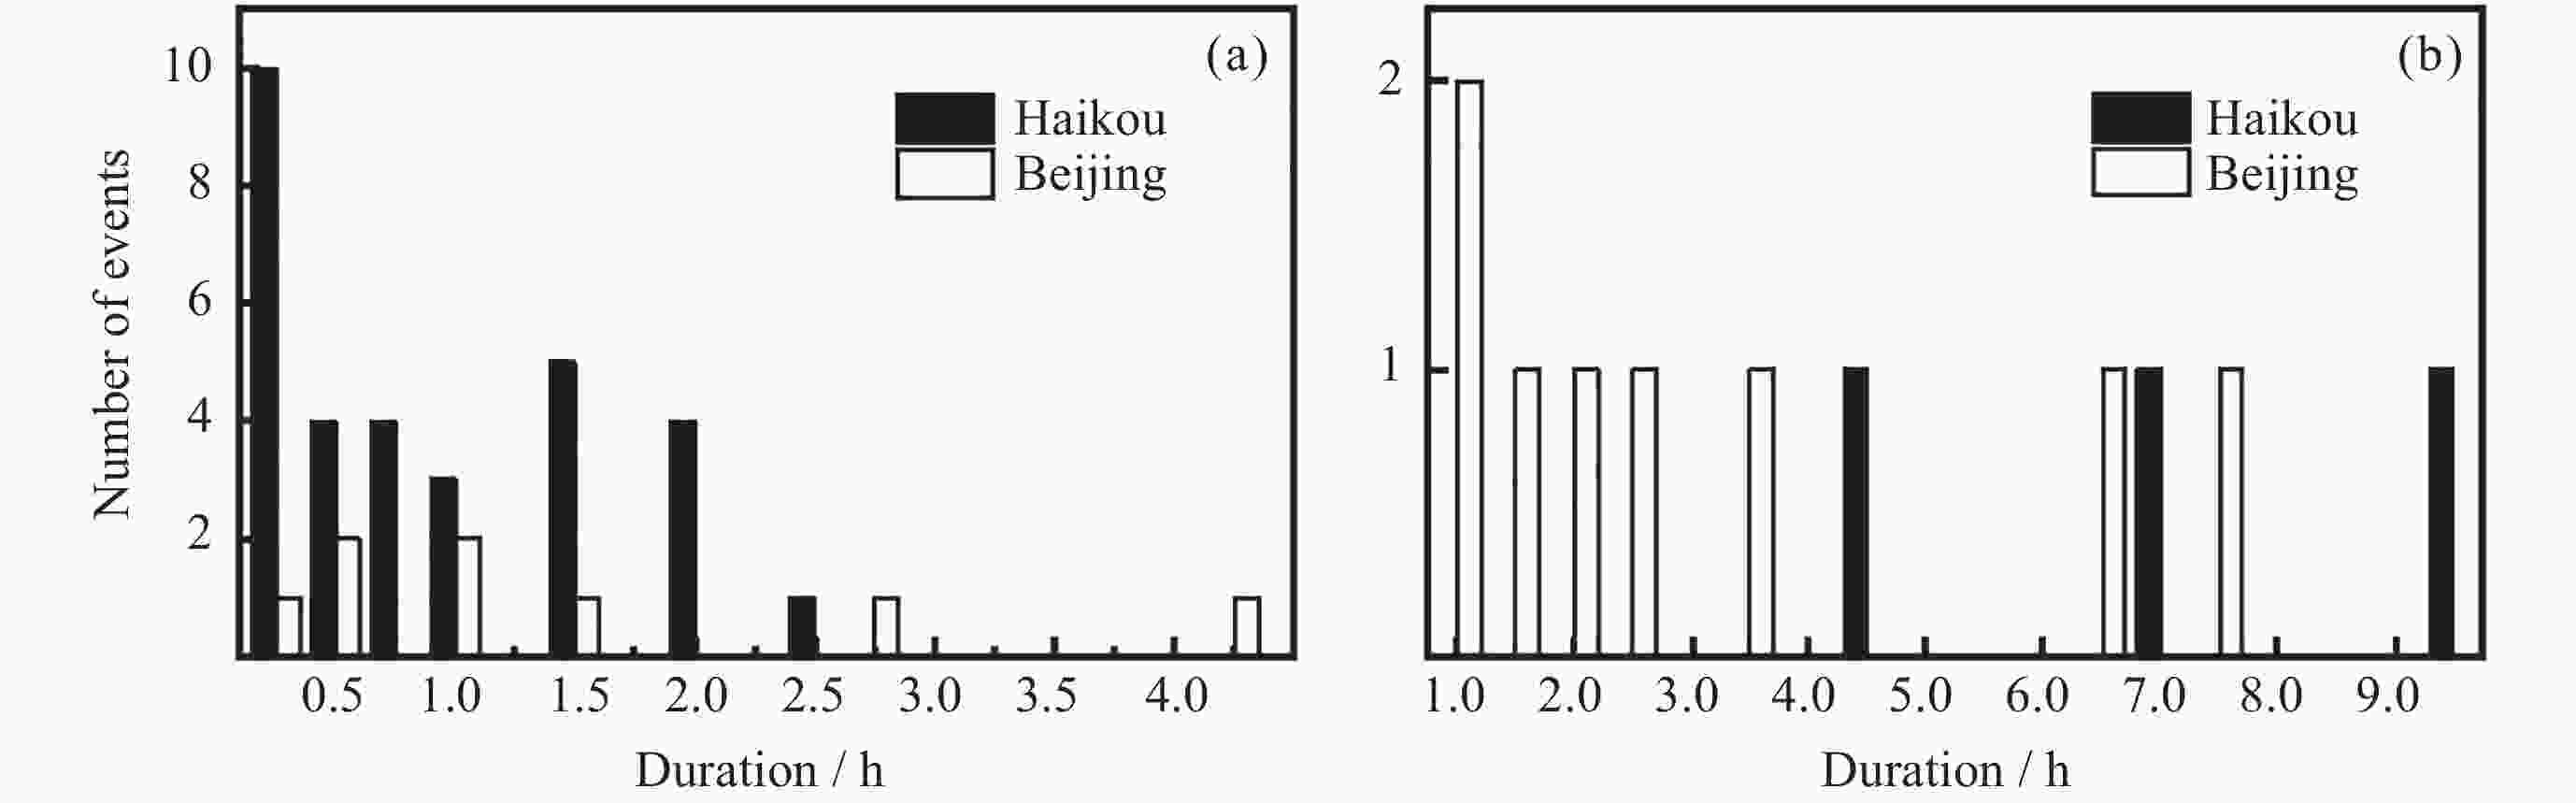
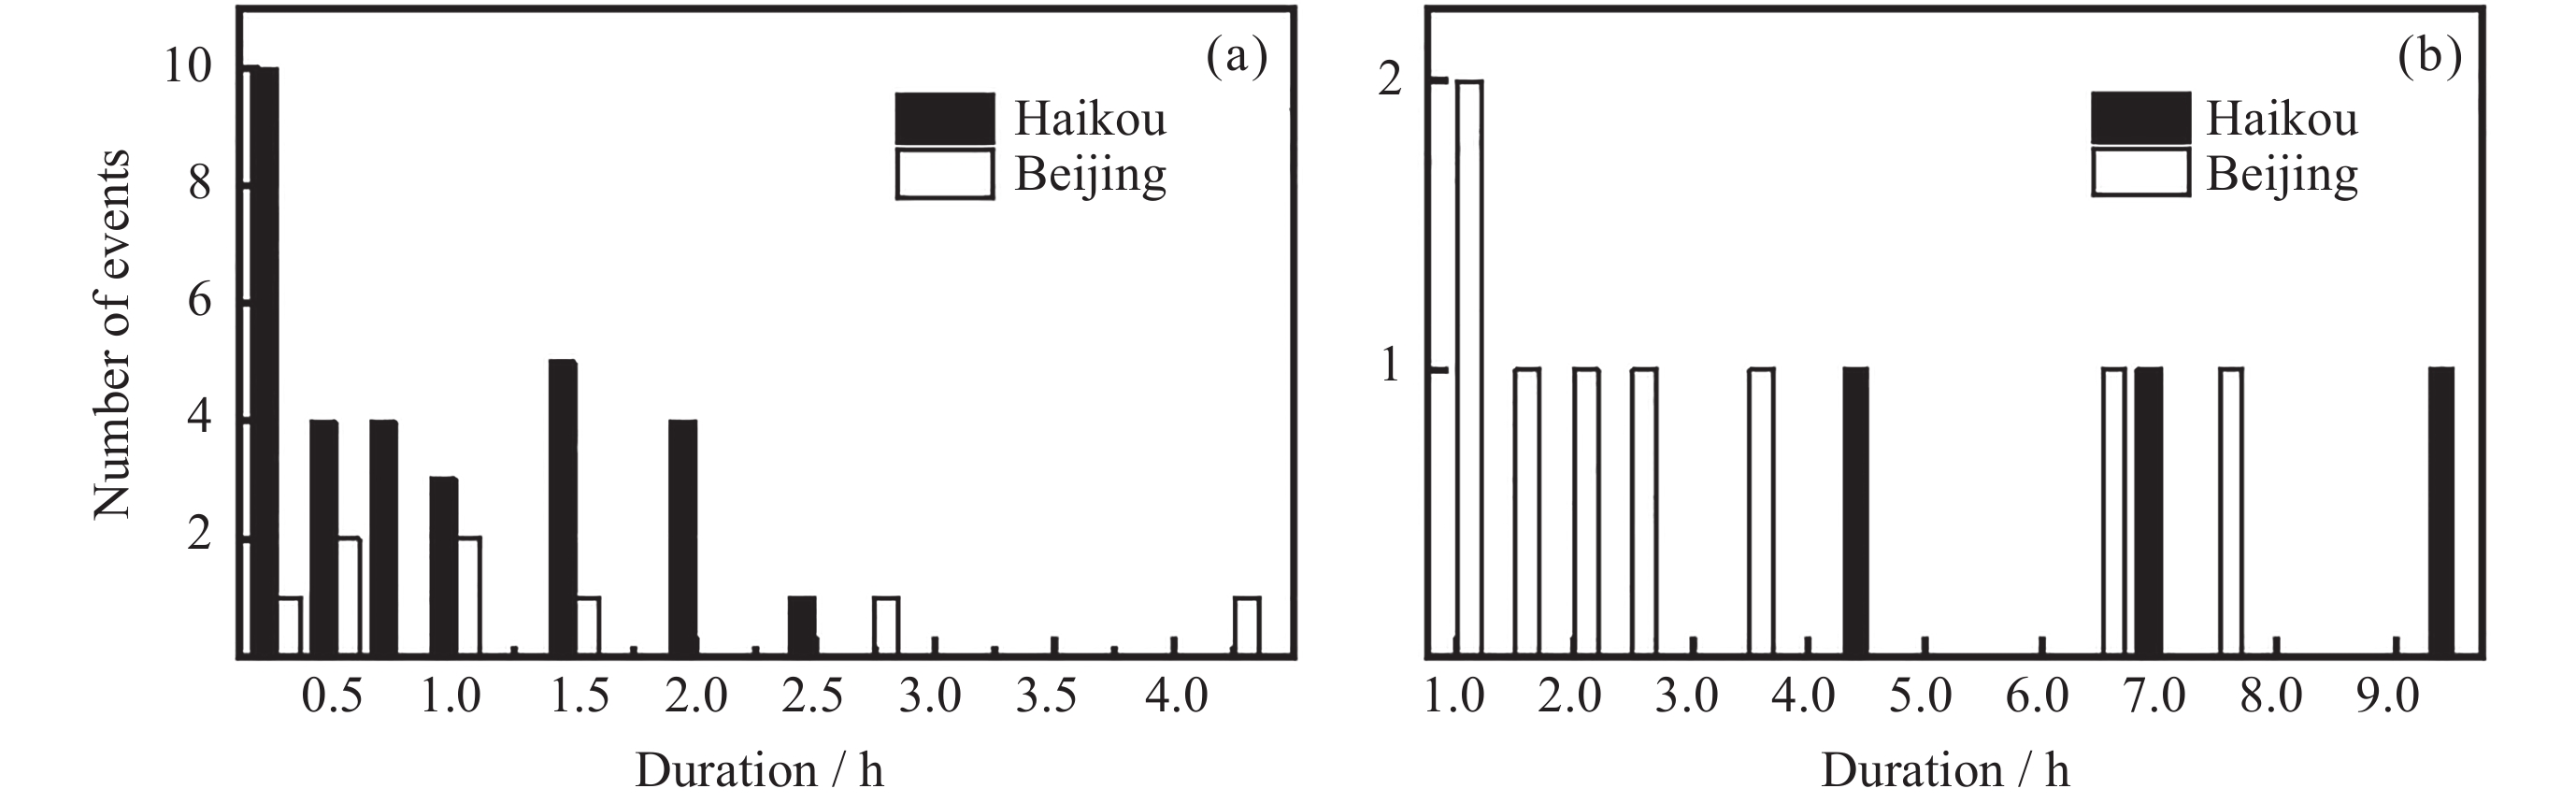
图 12 2020年海口和北京突发钠层 (a) 和双钠层 (b) 持续时间分布
Figure 12. Duration distribution of SSL (a) and DSL (b) over Haikou and Beijing in 2020
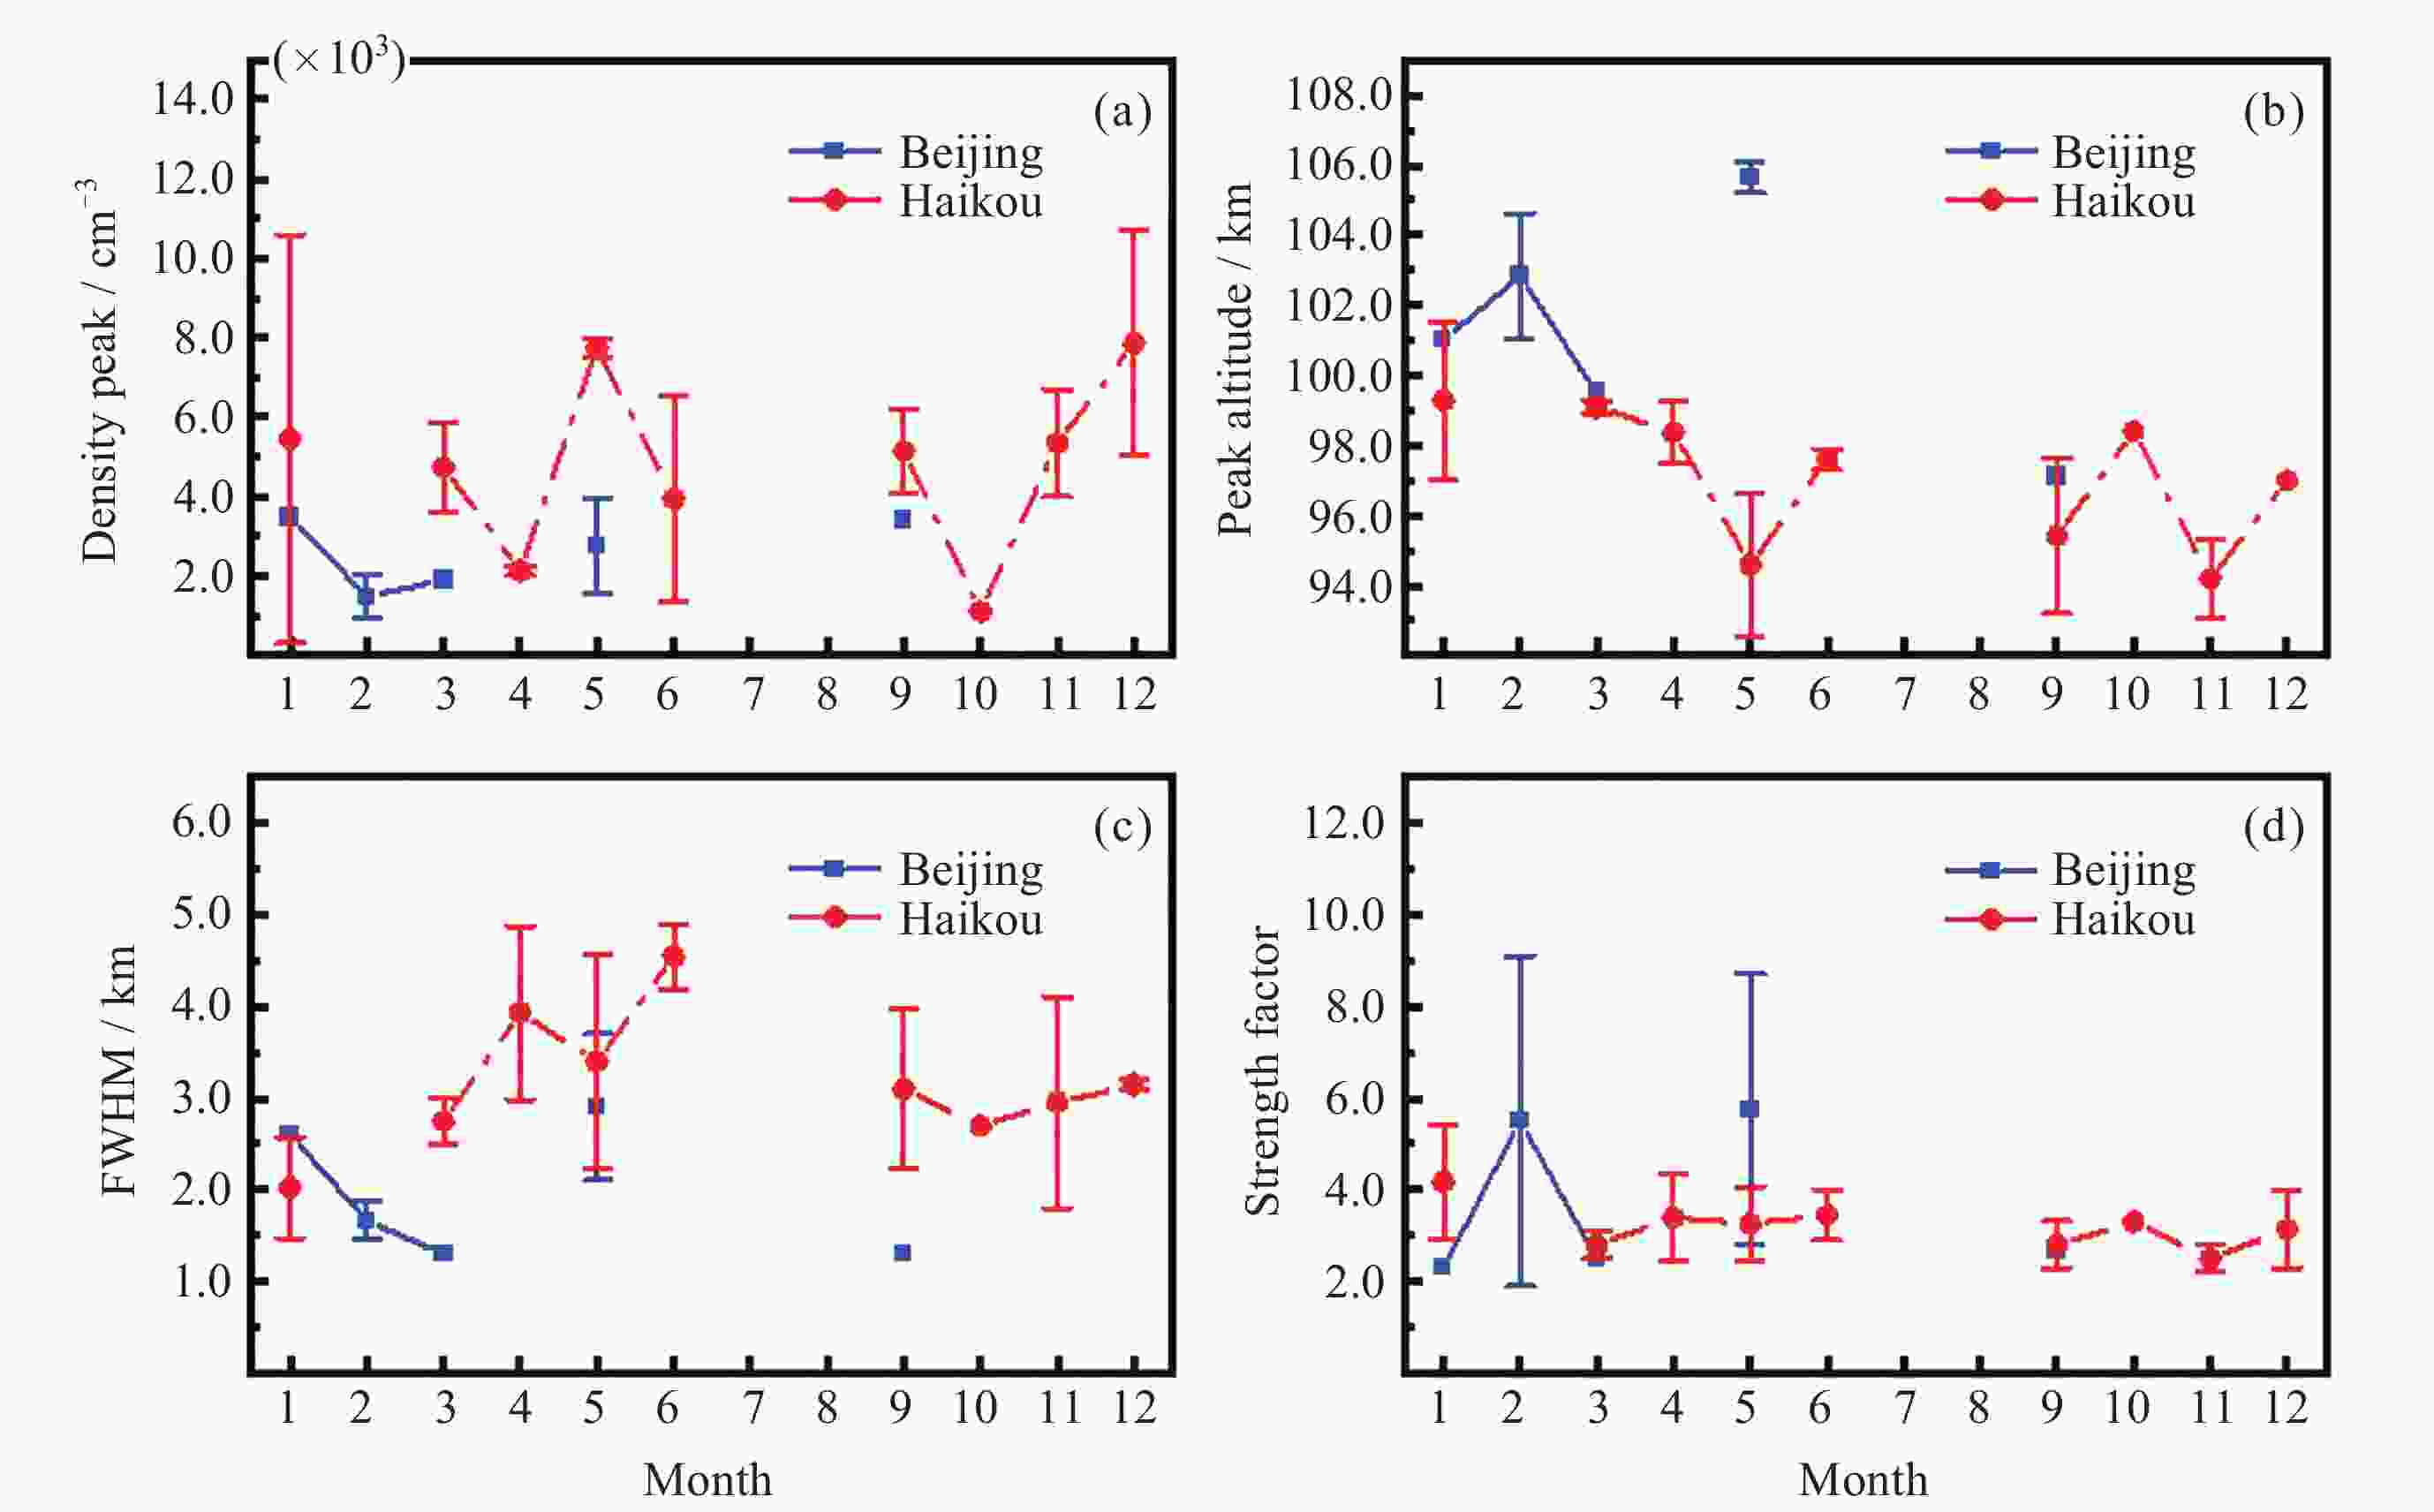
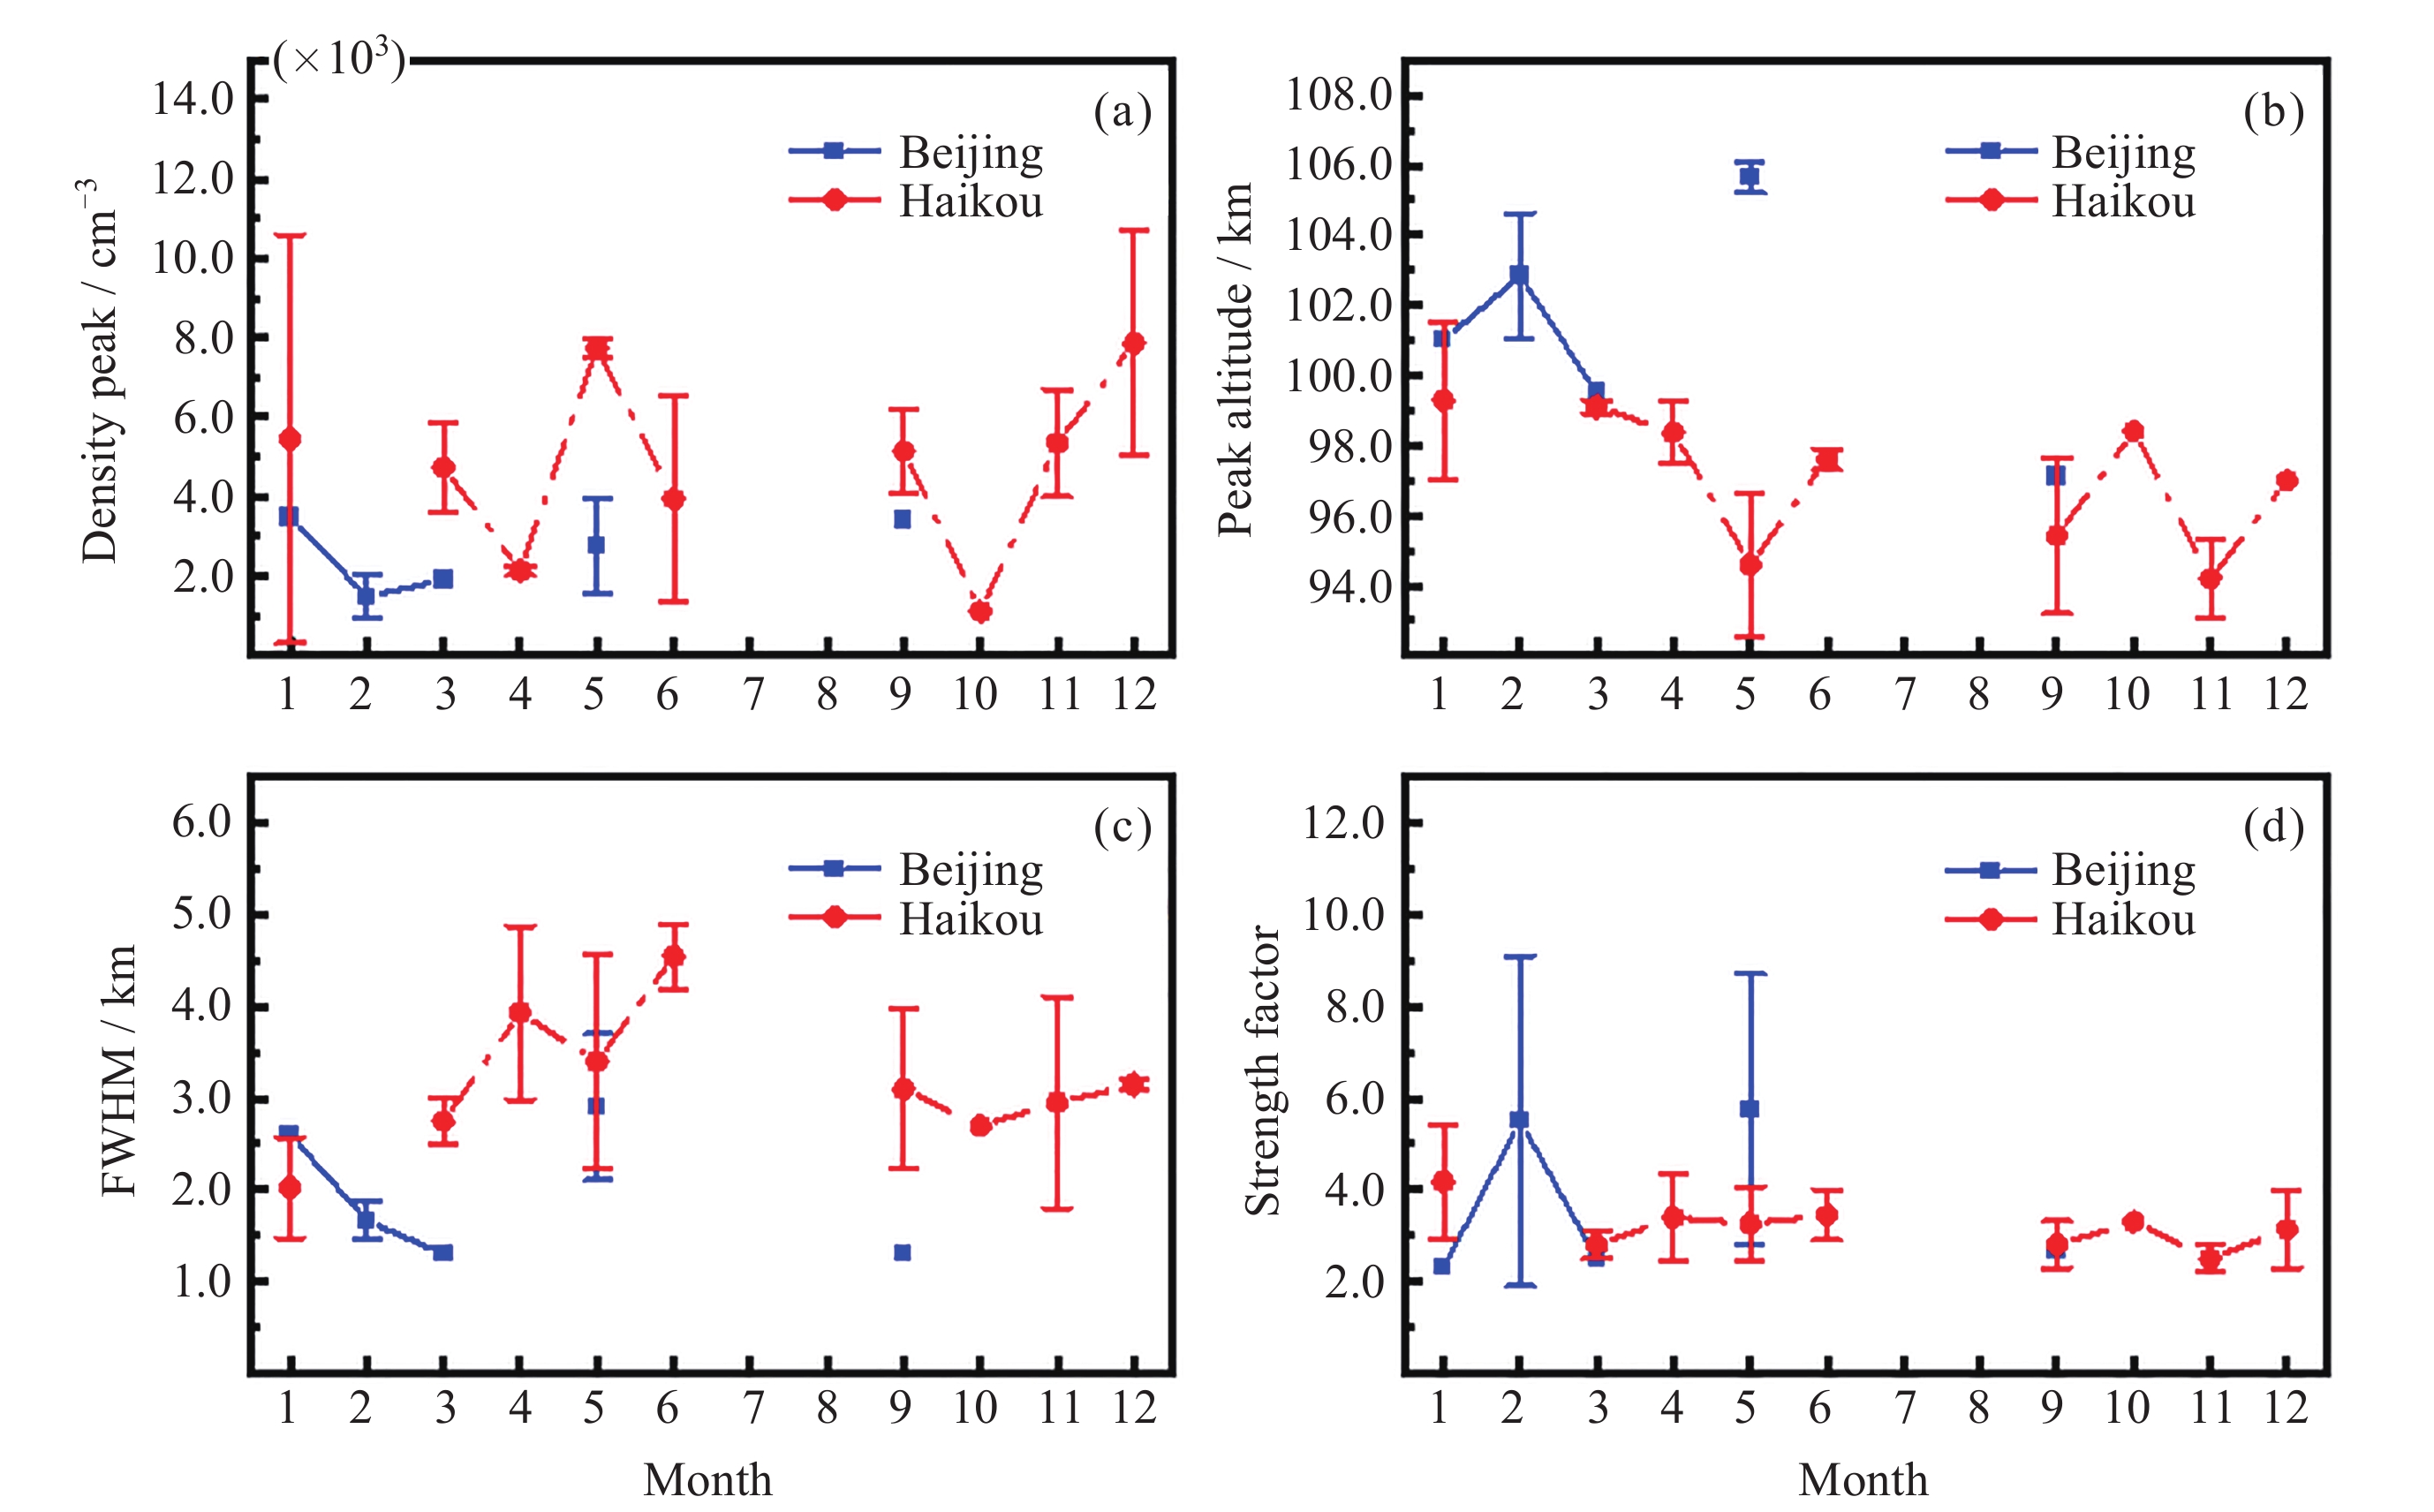
图 13 海口和北京上空2020年突发钠层绝对密度峰值 (a)、峰值高度 (b)、FWHM (c) 以及强度因子 (d) 的月变化分布
Figure 13. Monthly variation of absolute density peak value (a), peak altitude (b), FWHM (c) and strength factor (d) of SSL over Haikou and Beijing in 2020
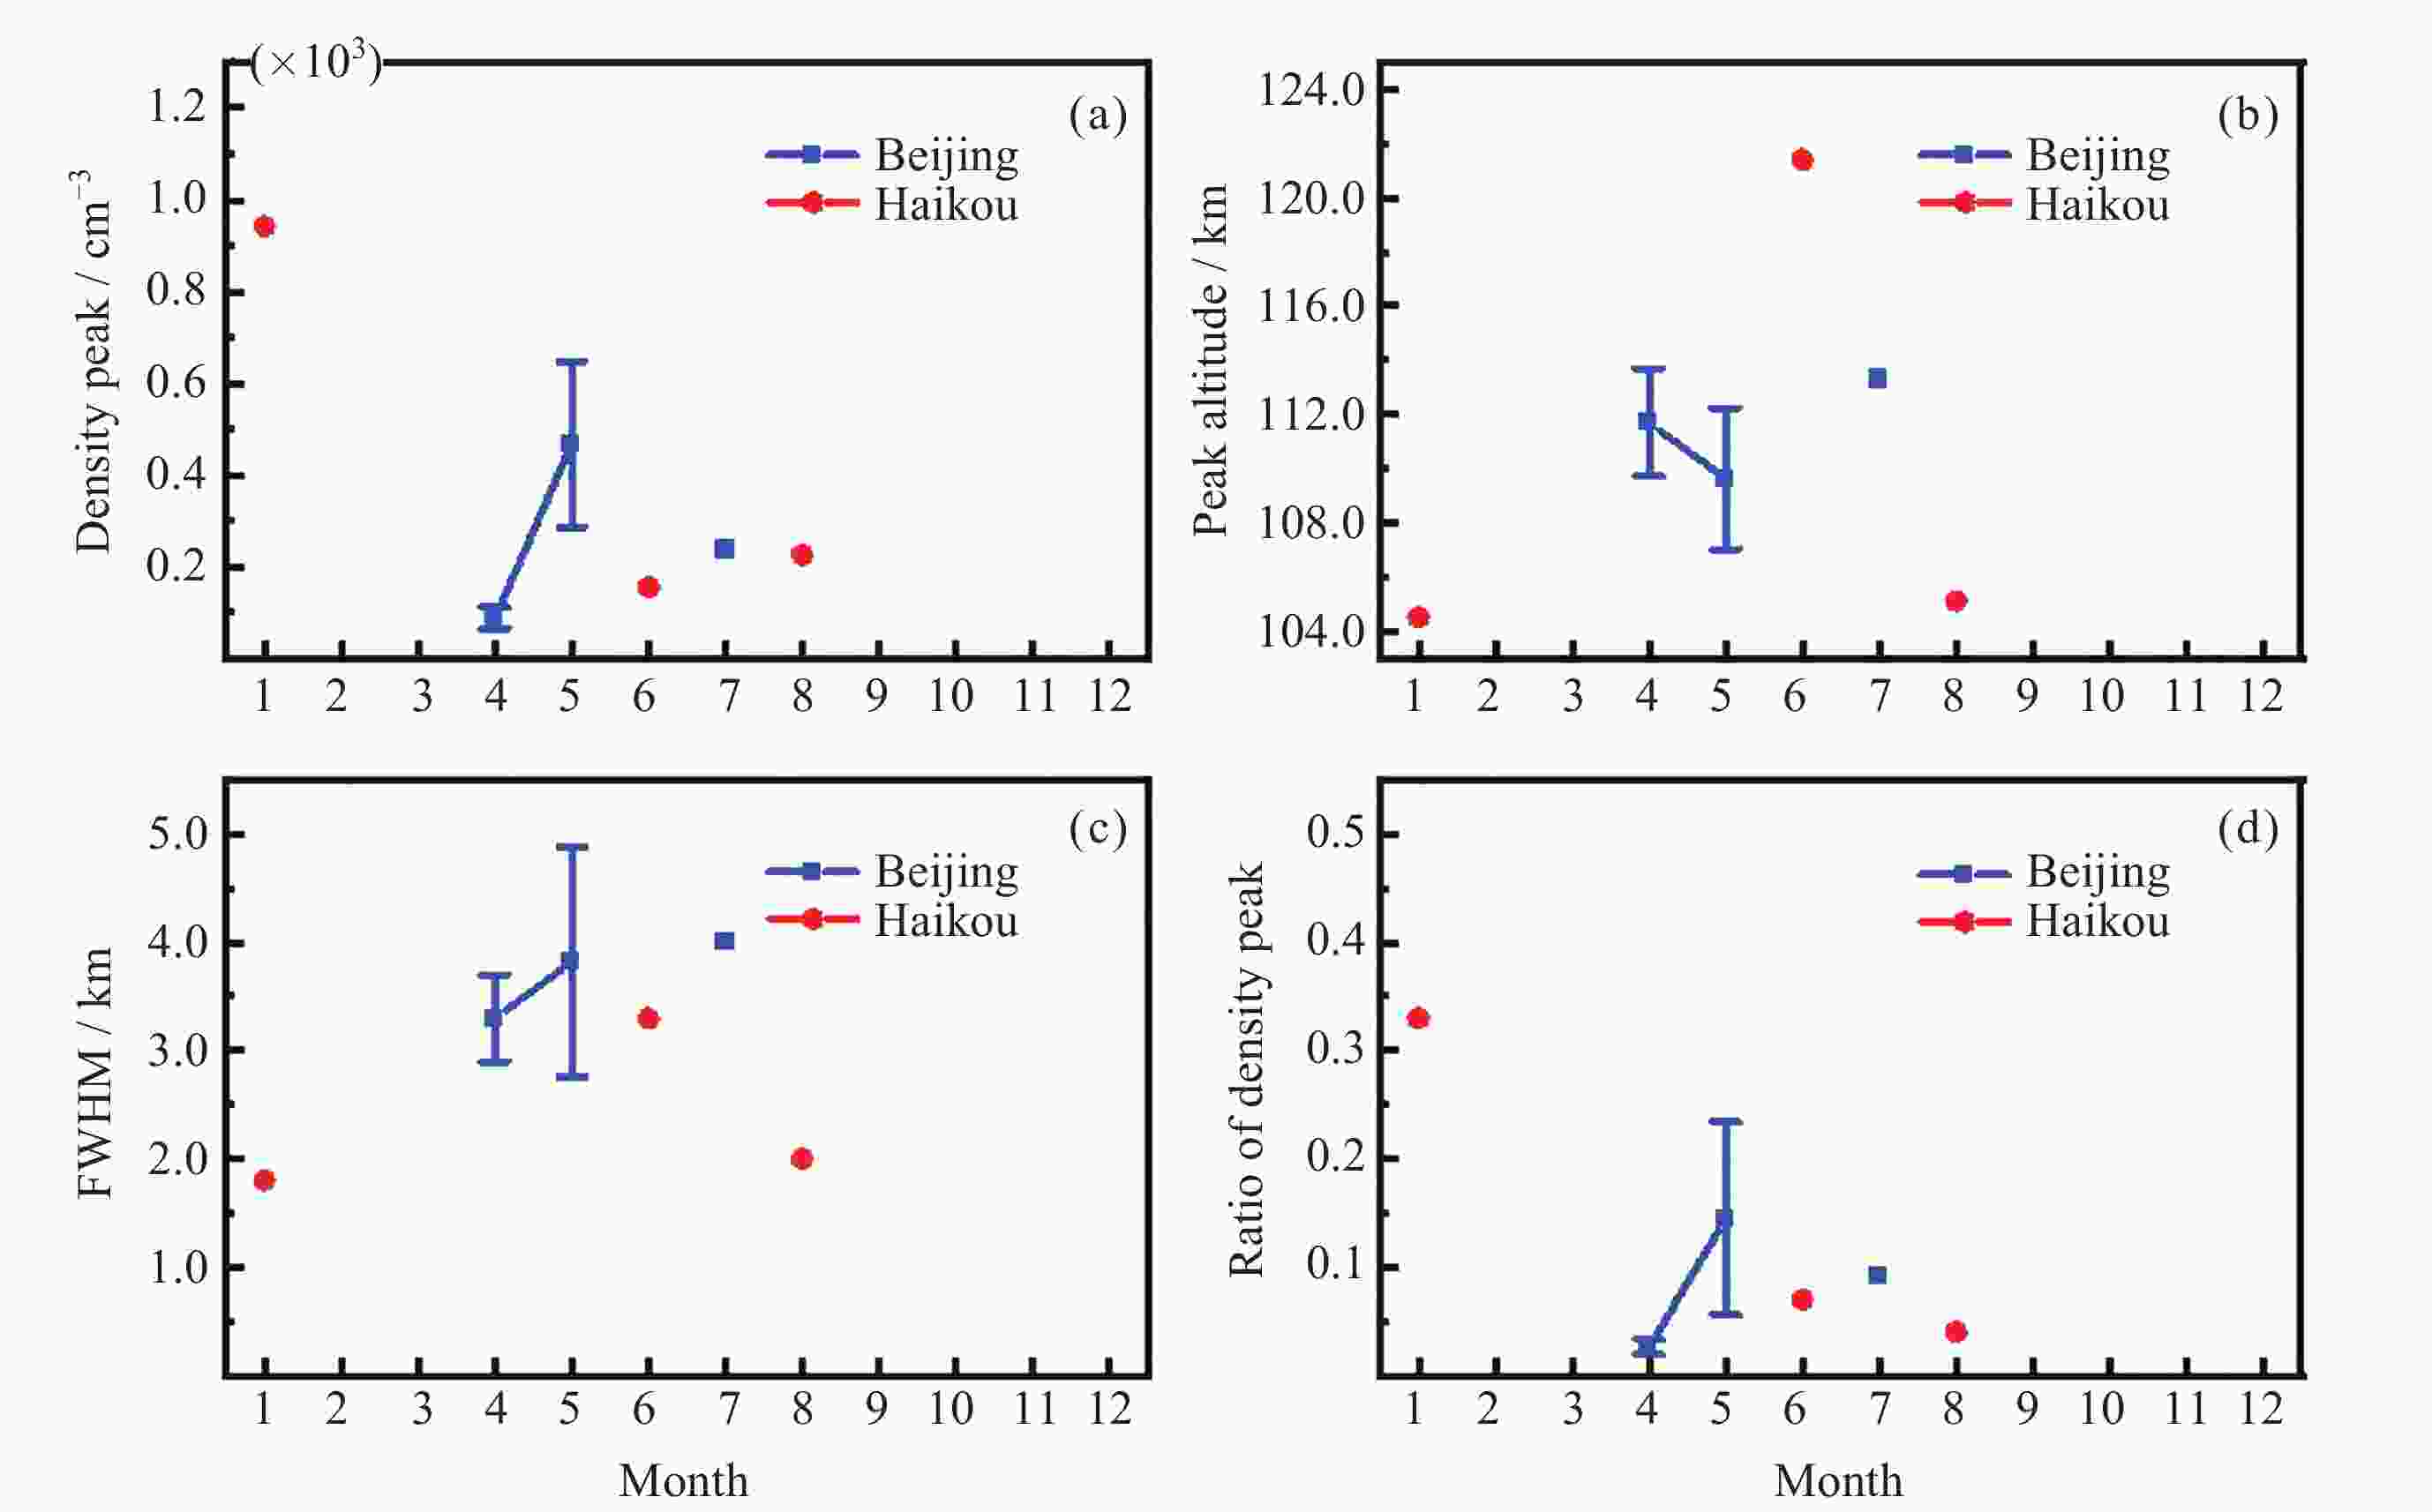
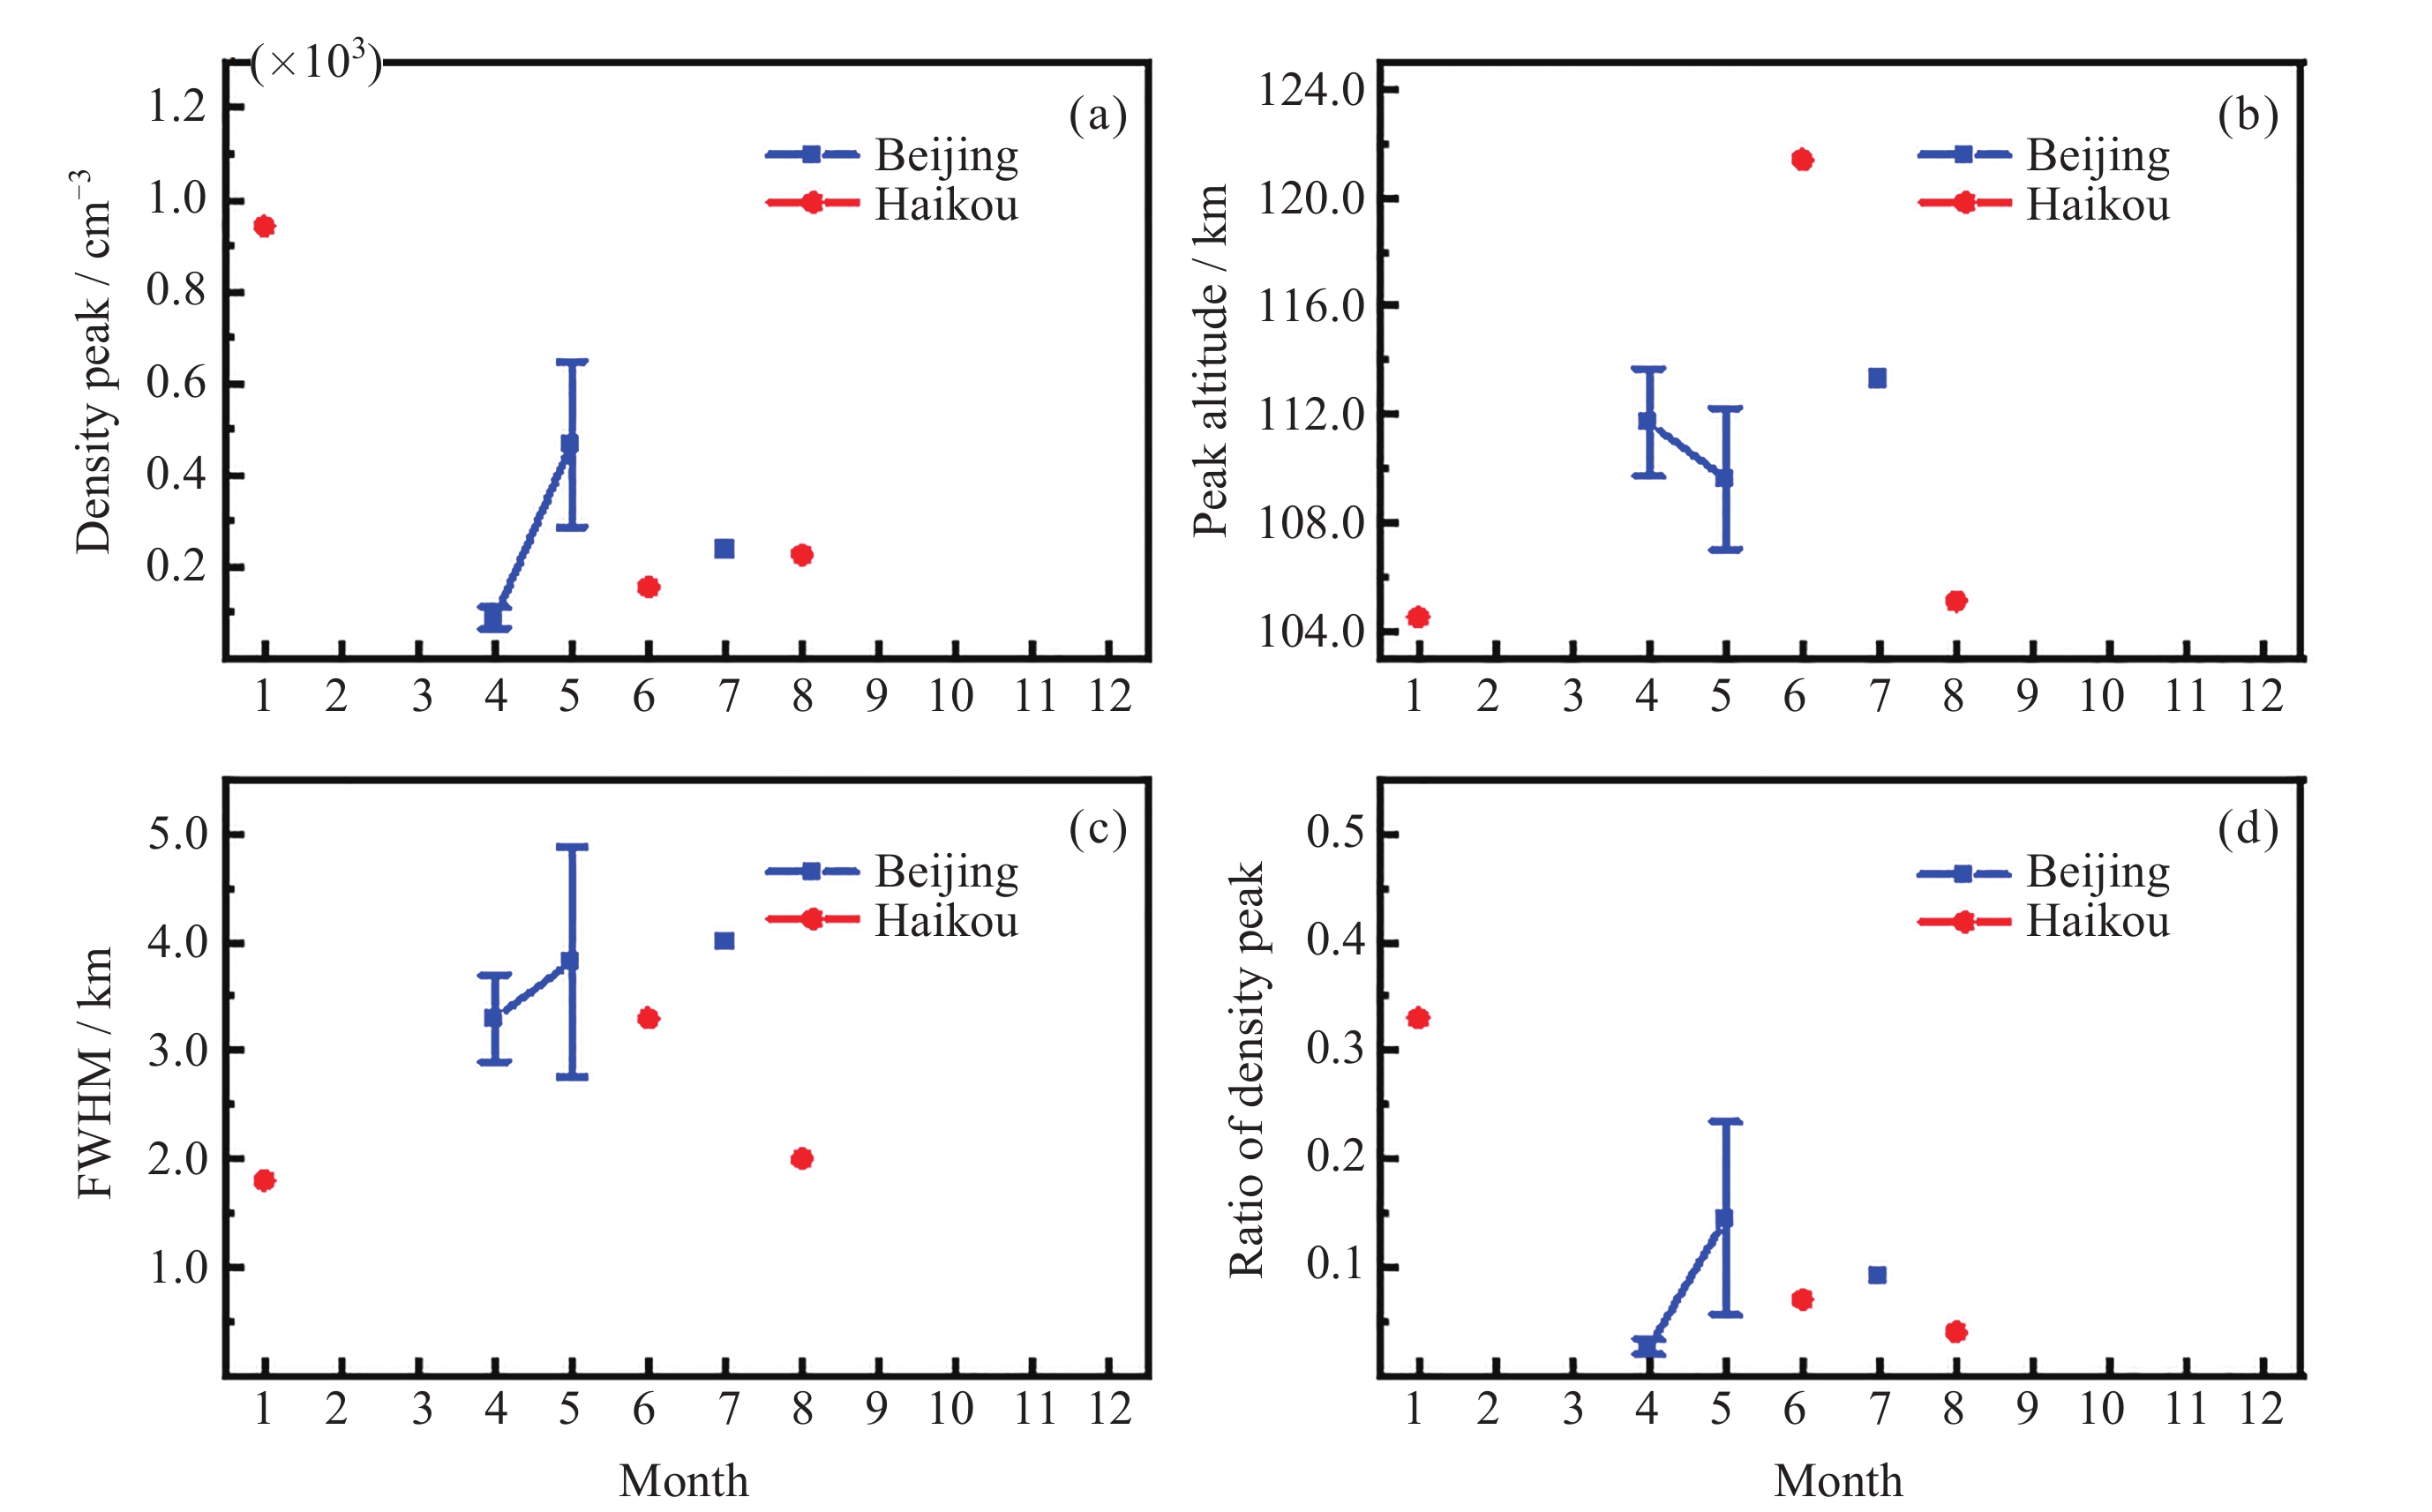
图 14 海口和北京上空2020年双钠层绝对密度峰值 (a)、峰值高度 (b)、FWHM (c)以及峰值之比 (d)的月变化分布
Figure 14. Monthly variation of absolute density peak value (a), peak altitude (b), FWHM (c) and ratio of density peak value (d) of DSL over Haikou and Beijing in 2020
表 1 2020年北京突发钠层主要参数
Table 1. Characteristics of SSL over Beijing in 2020
年-月-日 峰值时刻 (LT) 持续时间/min 绝对密度峰值/cm–3 峰值高度/km FWHM/km 强度因子 2020-01-09 00:21 59 3479.9 101.0 2.6 2.3 2020-02-03 04:49 31 1553.4 102.9 1.4 2.8 2020-02-05 02:21 253 791.4 105.0 1.9 10.6 2020-02-08 23:49 88 2105.2 100.6 1.7 3.1 2020-03-23 05:01 161 1905.7 99.5 1.3 2.5 2020-05-19 00:31 57 3978.2 106.1 2.1 8.7 03:09 17 1546.2 105.2 3.7 2.8 2020-09-18 00:57 23 3415.6 97.1 1.3 2.7  下载: 导出CSV
表 2 2020年北京双钠层事件主要参数
Table 2. Characteristics of DSL over Beijing in 2020
年-月-日 峰值时刻 (LT) 持续时间/min 绝对密度峰值/cm–3 峰值高度/km FWHM
/km第二钠层与主钠层
密度峰值比/(%)2020-04-12 21:04 88 63.5 109.3 2.9 1.9 2020-04-22 03:51 >224 110.2 114.1 3.7 3.3 2020-05-12 00:27 >434 108.5 111.2 5.7 4.3 2020-05-16 21:52 >142 856.1 104.0 3.3 34.6 2020-05-17 03:02 57 190.9 112.2 4.9 5.8 2020-05-18 21:27 65 654.2 111.0 2.5 16.4 2020-05-23 22:26 >131 526.4 109.7 2.7 11.3 2020-07-07 21:05 >393 236.1 113.3 4.0 9.1 注 持续时间中“>”表示没有观察到SSL或DSL第二钠层的开始或结束时刻.
下载: 导出CSV
表 3 2020年海口突发钠层主要参数
Table 3. Characteristics of SSL over Haikou in 2020
年-月-日 峰值时刻 (LT) 持续时间/min 绝对密度峰值/cm–3 峰值高度/km FWHM/km 强度因子 2020-01-13 01:35 113 10009.4 97.1 2.8 3.7 2020-01-14 22:33 15 1819.6 102.2 2.4 4.2 23:20 145 1994.2 97.7 1.7 4.1 2020-01-15 04:02 124 2783.5 101.4 1.4 5.6 05:40 112 2783.7 101.7 1.2 5.7 22:48 91 20235.6 98.2 2.7 5.4 2020-01-30 20:48 14 2412.4 95.8 2.1 2.3 2020-01-31 06:04 92 1678.8 100.2 1.9 3.4 2020-03-30 03:51 15 3600.0 99.3 3.0 2.5 05:41 40 5879.7 98.9 2.5 3.1 2020-04-20 00:54 63 1989.3 99.3 2.7 4.7 02:33 19 2265.4 97.2 5.0 3.0 05:07 43 2147.6 98.6 4.1 2.5 2020-05-07 00:52 17 7405.5 91.7 5.0 2.6 2020-05-16 21:45 46 7904.6 96.0 2.2 4.4 23:48 31 7939.3 96.1 3.0 2.8 2020-06-12 05:18 87 1350.4 97.9 4.2 2.9 2020-06-23 01:51 113 6552.3 97.3 4.9 4.0 2020-09-01 23:39 55 6324.9 98.4 3.3 2.2 2020-09-02 00:23 34 6690.6 99.1 3.2 2.2 2020-09-03 23:20 12 5732.7 92.6 1.9 2.2 2020-09-05 05:22 92 3571.1 95.0 3.0 3.3 2020-09-06 05:40 36 4267.8 93.0 5.0 2.6 2020-09-22 22:31 21 4928.4 95.8 2.2 3.4 23:08 55 4020.4 95.7 3.4 3.2 2020-09-23 00:51 35 5597.5 93.8 2.8 3.3 2020-10-04 05:57 72 1106.0 98.4 2.7 3.3 2020-11-01 00:00 84 4000.3 95.3 1.8 2.8 2020-11-27 01:29 15 6700.5 93.1 4.1 2.2 2020-12-26 00:05 12 5025.8 97.0 3.2 2.3 2020-12-28 20:54 39 10696.7 97.0 3.1 4.0
下载: 导出CSV
表 4 2020年海口双钠层事件主要参数
Table 4. Characteristics of DSL over Haikou in 2020
年-月-日 峰值时刻 (LT) 持续时间/min 绝对密度峰值/cm–3 峰值高度/km FWHM
/km第二钠层与主钠层
密度峰值比/(%)2020-01-14 20:53 >409 942.0 104.5 1.8 32.7 2020-06-22 04:19 262 154.9 121.4 3.3 7.4 2020-08-08 20:53 >579 224.9 105.1 2.0 4.4 注 持续时间中“>”表示没有观察到SSL或DSL第二钠层的开始或结束时刻.
下载: 导出CSV
表 5 2020年海口上空SSL和Es事件主要参数
Table 5. Main parameters of SSL (20°N, 110°E) and Es (19°N, 109°E) events over Haikou in 2020
年-月-日 SSL Es 峰值时间(LT) 峰值高度/km 强度因子 时间差/min 突发高度/km f0Es/MHz 2020-01-30 20:48 95.8 2.3 57 102.5 4.1 2020-04-20 05:07 98.6 2.5 8 96.0 3.5 2020-05-07 00:52 91.7 2.6 53 102.5 3.2 2020-05-16 21:45 96.0 4.4 –15 108.8 2.6 2020-06-12 05:18 97.9 2.9 –18 97.5 3.0 2020-06-23 01:51 97.3 3.8 –71 106.3 7.2 2020-09-01 23:39 98.4 2.2 –159 100 7.1 2020-09-02 00:23 99.1 2.2 7 105.0 5.6 2020-09-03 23:20 92.6 2.2 10 102.5 3.1 2020-09-22 22:31 95.8 3.4 –76 95.0 4.8 2020-12-26 00:05 96.2 2.3 –50 97.5 5.2
下载: 导出CSV
-
[1] BOWMAN M R, GIBSON A J, SANDFORD M C W. Atmospheric sodium measured by a tuned laser radar[J]. Nature, 1969, 221(5179): 456-457 doi: 10.1038/221456a0 [2] FAN Z Y, PLANE J M C, GUMBEL J, et al. Satellite measurements of the global mesospheric sodium layer[J]. Atmospheric Chemistry and Physics, 2007, 7(15): 4107-4115 doi: 10.5194/acp-7-4107-2007 [3] PRASANTH P V, SIVAKUMAR V, SRIDHARAN S, et al. Lidar observations of sodium layer over low latitude, Gadanki (13.5°N, 79.2°E): seasonal and nocturnal variations[J]. Annales Geophysicae, 2009, 27(10): 3811-3823 doi: 10.5194/angeo-27-3811-2009 [4] XIA Y, CHENG X W, LI F Q, et al. Diurnal variation of atmospheric metal Na layer and nighttime top extension detected by a Na lidar with narrowband spectral filters at Beijing, China[J]. Journal of Quantitative Spectroscopy and Radiative Transfer, 2020, 255: 107256 doi: 10.1016/j.jqsrt.2020.107256 [5] XIA Y, JIAO J, NOZAWA S, et al. Significant enhancements of the mesospheric Na layer bottom below 75 km observed by a full-diurnal-cycle lidar at Beijing (40.41°N, 116.01°E), China[J]. Atmospheric Chemistry and Physics, 2022, 22(20): 13817-13831 doi: 10.5194/acp-22-13817-2022 [6] CHEN Y F, CHU X Z. Lidar observations of predawn thermosphere‐ionosphere Na (TINa) layers over boulder (40.13°N, 105.24°W): annual phase variations and correlation with sunrise and tidal winds[J]. Geophysical Research Letters, 2023, 50(18): e2023GL105626 doi: 10.1029/2023GL105626 [7] CLEMESHA B R, KIRCHHOFF V W J H, SIMONICH D M, et al. Evidence of an extra-terrestrial source for the mesospheric sodium layer[J]. Geophysical Research Letters, 1978, 5(10): 873-876 doi: 10.1029/GL005i010p00873 [8] SHI M X, QIU S C, SOON W, et al. Peculiar wave structure of the mesospheric sporadic sodium layer observed by Lidars in Hefei (31.8°N, 117.3°E) and Wuhan (30.5°N, 114°E), Central China[J]. Journal of Geophysical Research: Atmospheres, 2023, 128(16): e2023JD039111 doi: 10.1029/2023JD039111 [9] QIU S C, SHI M X, YOUSOF W, et al. Solitary wave characteristics on the fine structure of the mesospheric sporadic sodium layer[J]. Frontiers in Astronomy and Space Sciences, 2023, 10: 1241663 doi: 10.3389/fspas.2023.1241663 [10] CHEN X C, HUANG W T, BAN C, et al. Dynamic properties of a sporadic sodium layer revealed by observations over Zhongshan, Antarctica: a case study[J]. Journal of Geophysical Research Space Physics, 2021, 126(11): e2021JA029787 doi: 10.1029/2021JA029787 [11] QIU S C, WANG N, SOON W, et al. The sporadic sodium layer: a possible tracer for the conjunction between the upper and lower atmospheres[J]. Atmospheric Chemistry and Physics, 2021, 21(15): 11927-11940 doi: 10.5194/acp-21-11927-2021 [12] GONG S S, YANG G T, WANG J M, et al. A double sodium layer event observed over Wuhan, China by lidar[J]. Geophysical Research Letters, 2003, 30(5): 1209 [13] ANDRIOLI V F, XU J Y, BATISTA P P, et al. Simultaneous observation of sporadic potassium and sodium layers Over Sao José dos Campos, Brazil (23.1°S, 45.9°W)[J]. Journal of Geophysical Research Space Physics, 2021, 126(5): e2020JA028890 doi: 10.1029/2020JA028890 [14] WU F J, CHU X Z, DU L F, et al. First simultaneous Lidar observations of thermosphere-ionosphere sporadic Ni and Na (TISNi and TISNa) layers (∼105-120 km) over Beijing (40.42°N, 116.02°E)[J]. Geophysical Research Letters, 2022, 49(16): e2022GL100397 doi: 10.1029/2022GL100397 [15] YU B K, XUE X H, SCOTT C J, et al. Comparison of middle- and low-latitude sodium layer from a ground-based lidar network, the Odin satellite, and WACCM-Na model[J]. Atmospheric Chemistry and Physics, 2022, 22(17): 11485-11504 doi: 10.5194/acp-22-11485-2022 [16] CHU X Z, CHEN Y F, CULLENS C Y, et al. Mid-latitude thermosphere-ionosphere Na (TINa) layers observed with high-sensitivity Na doppler Lidar Over boulder (40.13°N, 105.24°W)[J]. Geophysical Research Letters, 2021, 48(11): e2021GL093729 doi: 10.1029/2021GL093729 [17] GARDNER C S, VOELZ D G, SECHRIST C F, et al. Lidar studies of the nighttime sodium layer over Urbana, Illinois: 1. Seasonal and nocturnal variations[J]. Journal of Geophysical Research: Space Physics, 1986, 91(A12): 13659-13673 doi: 10.1029/JA091iA12p13659 [18] SHE C Y, KRUEGER D A, YAN Z A, et al. Climatology, long‐term trend and solar response of Na density based on 28 Years (1990-2017) of Midlatitude Mesopause na lidar observation[J]. Journal of Geophysical Research: Space Physics, 2023, 128(11): e2023JA031652 doi: 10.1029/2023JA031652 [19] STATES R J, GARDNER C S. Structure of the mesospheric Na layer at 40°N latitude: Seasonal and diurnal variations[J]. Journal of Geophysical Research: Atmospheres, 1999, 104(D9): 11783-11798 doi: 10.1029/1999JD900002 [20] SWIDER W. Enhanced seasonal variations for chemical rates with inverse temperature dependencies: application to seasonal abundance of mesospheric sodium[J]. Geophysical Research Letters, 1985, 12(9): 589-591 doi: 10.1029/GL012i009p00589 [21] ANDRIOLI V F, XU J Y, BATISTA P P, et al. Nocturnal and seasonal variation of Na and K layers simultaneously observed in the MLT region at 23°S[J]. Journal of Geophysical Research Space Physics, 2020, 125(3): e2019 JA027164 doi: 10.1029/2019JA027164 [22] CLEMESHA B R, BATISTA P P, SIMONICH D M. Long-term variations in the centroid height of the atmospheric sodium layer[J]. Advances in Space Research, 2003, 32(9): 1707-1711 doi: 10.1016/S0273-1177(03)90466-2 [23] SIMONICH D, CLEMESHA B. Sporadic sodium layers and the average vertical distribution of atmospheric sodium: Comparison of different Nas layer strengths[J]. Advances in Space Research, 2008, 42(1): 229-233 doi: 10.1016/j.asr.2008.03.027 [24] WANG W X, JIANG C H, WEI L H, et al. Comparative study of the Es layer between the plateau and plain regions in China[J]. Remote Sensing, 2022, 14(12): 2871 doi: 10.3390/rs14122871 [25] XUE X H, DOU X K, LEI J H, et al. Lower thermospheric-enhanced sodium layers observed at low latitude and possible formation: Case studies[J]. Journal of Geophysical Research: Space Physics, 2013, 118(5): 2409-2418 doi: 10.1002/jgra.50200 [26] DOU X K, QIU S C, XUE X H, et al. Sporadic and thermospheric enhanced sodium layers observed by a lidar chain over China[J]. Journal of Geophysical Research: Space Physics, 2013, 118(10): 6627-6643 doi: 10.1002/jgra.50579 [27] DOU X K, XUE X H, CHEN T D, et al. A statistical study of sporadic sodium layer observed by Sodium lidar at Hefei (31.8°N, 117.3°E)[J]. Annales Geophysicae, 2009, 27(6): 2247-2257 doi: 10.5194/angeo-27-2247-2009 [28] GONG S S, YANG G T, WANG J M, et al. Occurrence and characteristics of sporadic sodium layer observed by lidar at a mid-latitude location[J]. Journal of Atmospheric and Solar-Terrestrial Physics, 2002, 64(18): 1957-1966 doi: 10.1016/S1364-6826(02)00216-X [29] XIA Y, NOZAWA S, JIAO J, et al. Statistical study on sporadic sodium layers (SSLs) based on diurnal sodium lidar observations at Beijing, China (40.5°N, 116°E)[J]. Journal of Atmospheric and Solar-Terrestrial Physics, 2021, 212: 105512 doi: 10.1016/j.jastp.2020.105512 [30] QIU S C, TANG Y H, JIA M J, et al. A review of latitudinal characteristics of sporadic sodium layers, including new results from the Chinese Meridian Project[J]. Earth-Science Reviews, 2016, 162: 83-106 doi: 10.1016/j.earscirev.2016.07.004 [31] YANG D L, ZHANG T M, WANG J H, et al. Characteristics of double sodium layer over Haikou, China (20.0°N, 110.1°E)[J]. Solar-Terrestrial Physics, 2019, 5(2): 30-34 -
-

 下载:
下载:

计量
- 文章访问数: 778
- HTML全文浏览量: 247
- PDF下载量: 13
-
被引次数:
0(来源:Crossref)
0(来源:其他)

