


太阳活动下降年昆明地区TEC变化特征与IRI-2020模拟比较分析
doi: 10.11728/cjss2023.02.2022-0066 cstr: 32142.14.cjss2023.02.2022-0066
Analysis of Variation Characteristic of TEC at Kunming Region and Comparison with IRI-2020 during Descending Phase of Solar Activity
-
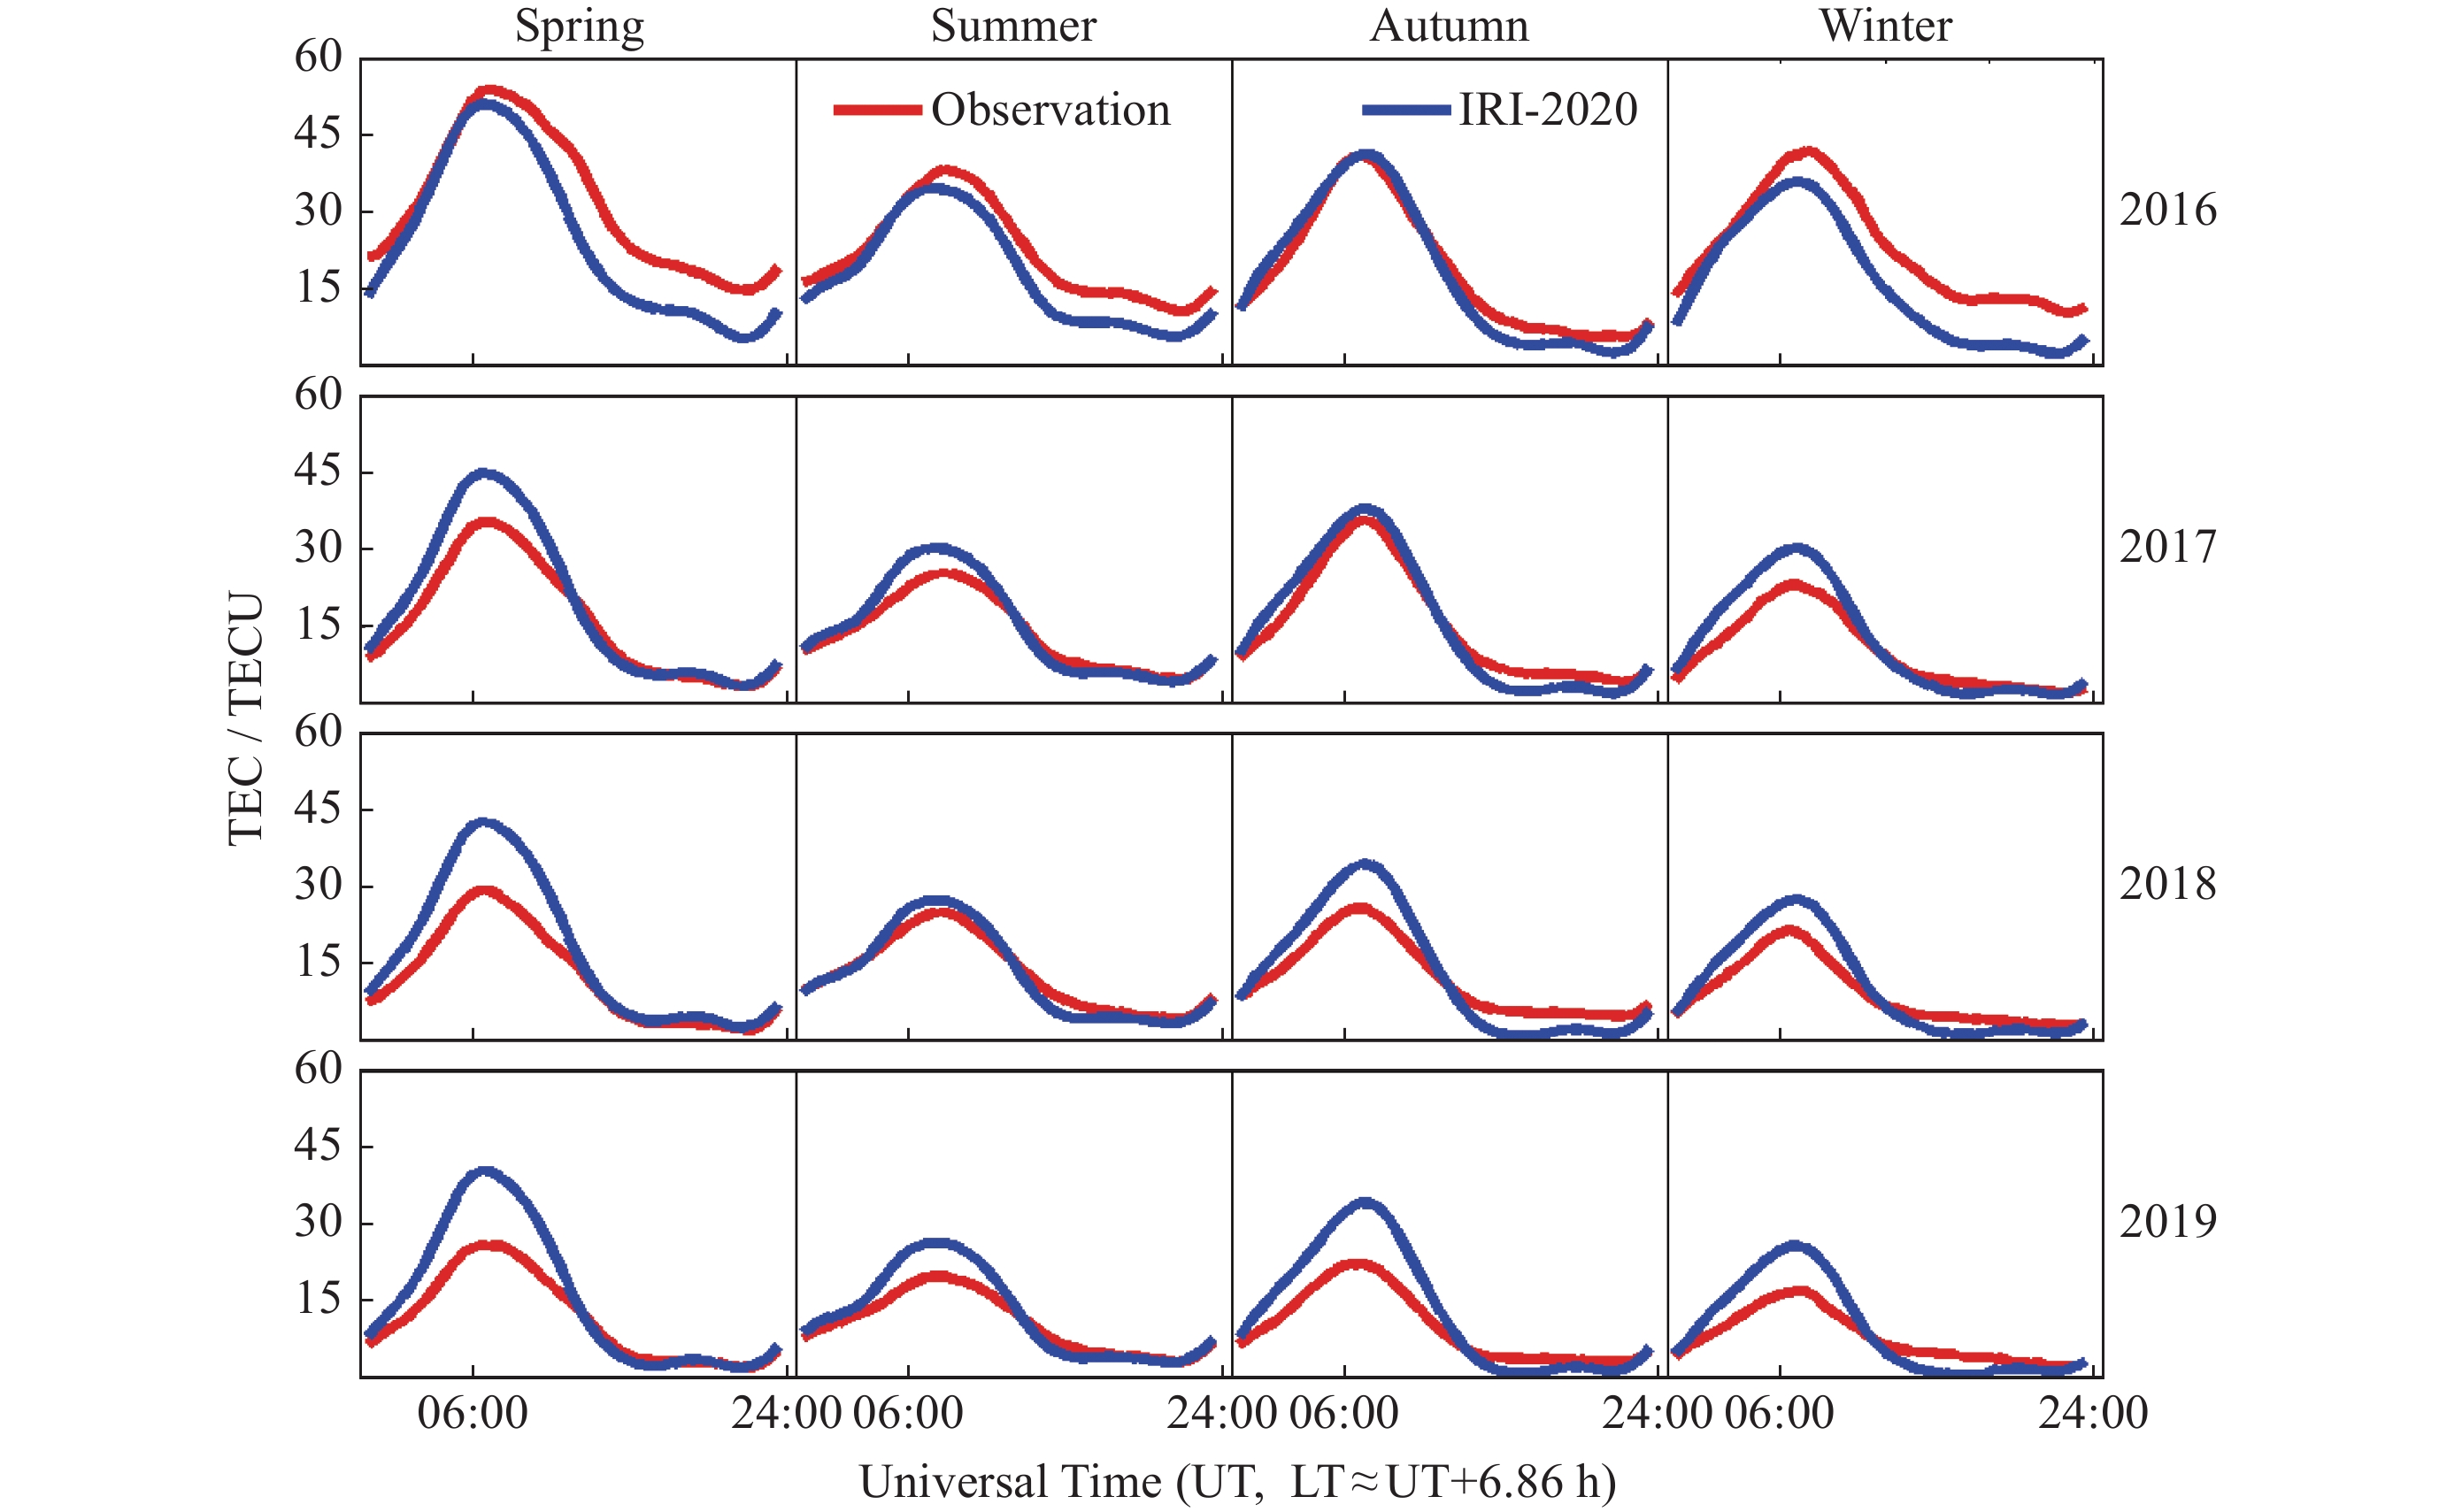
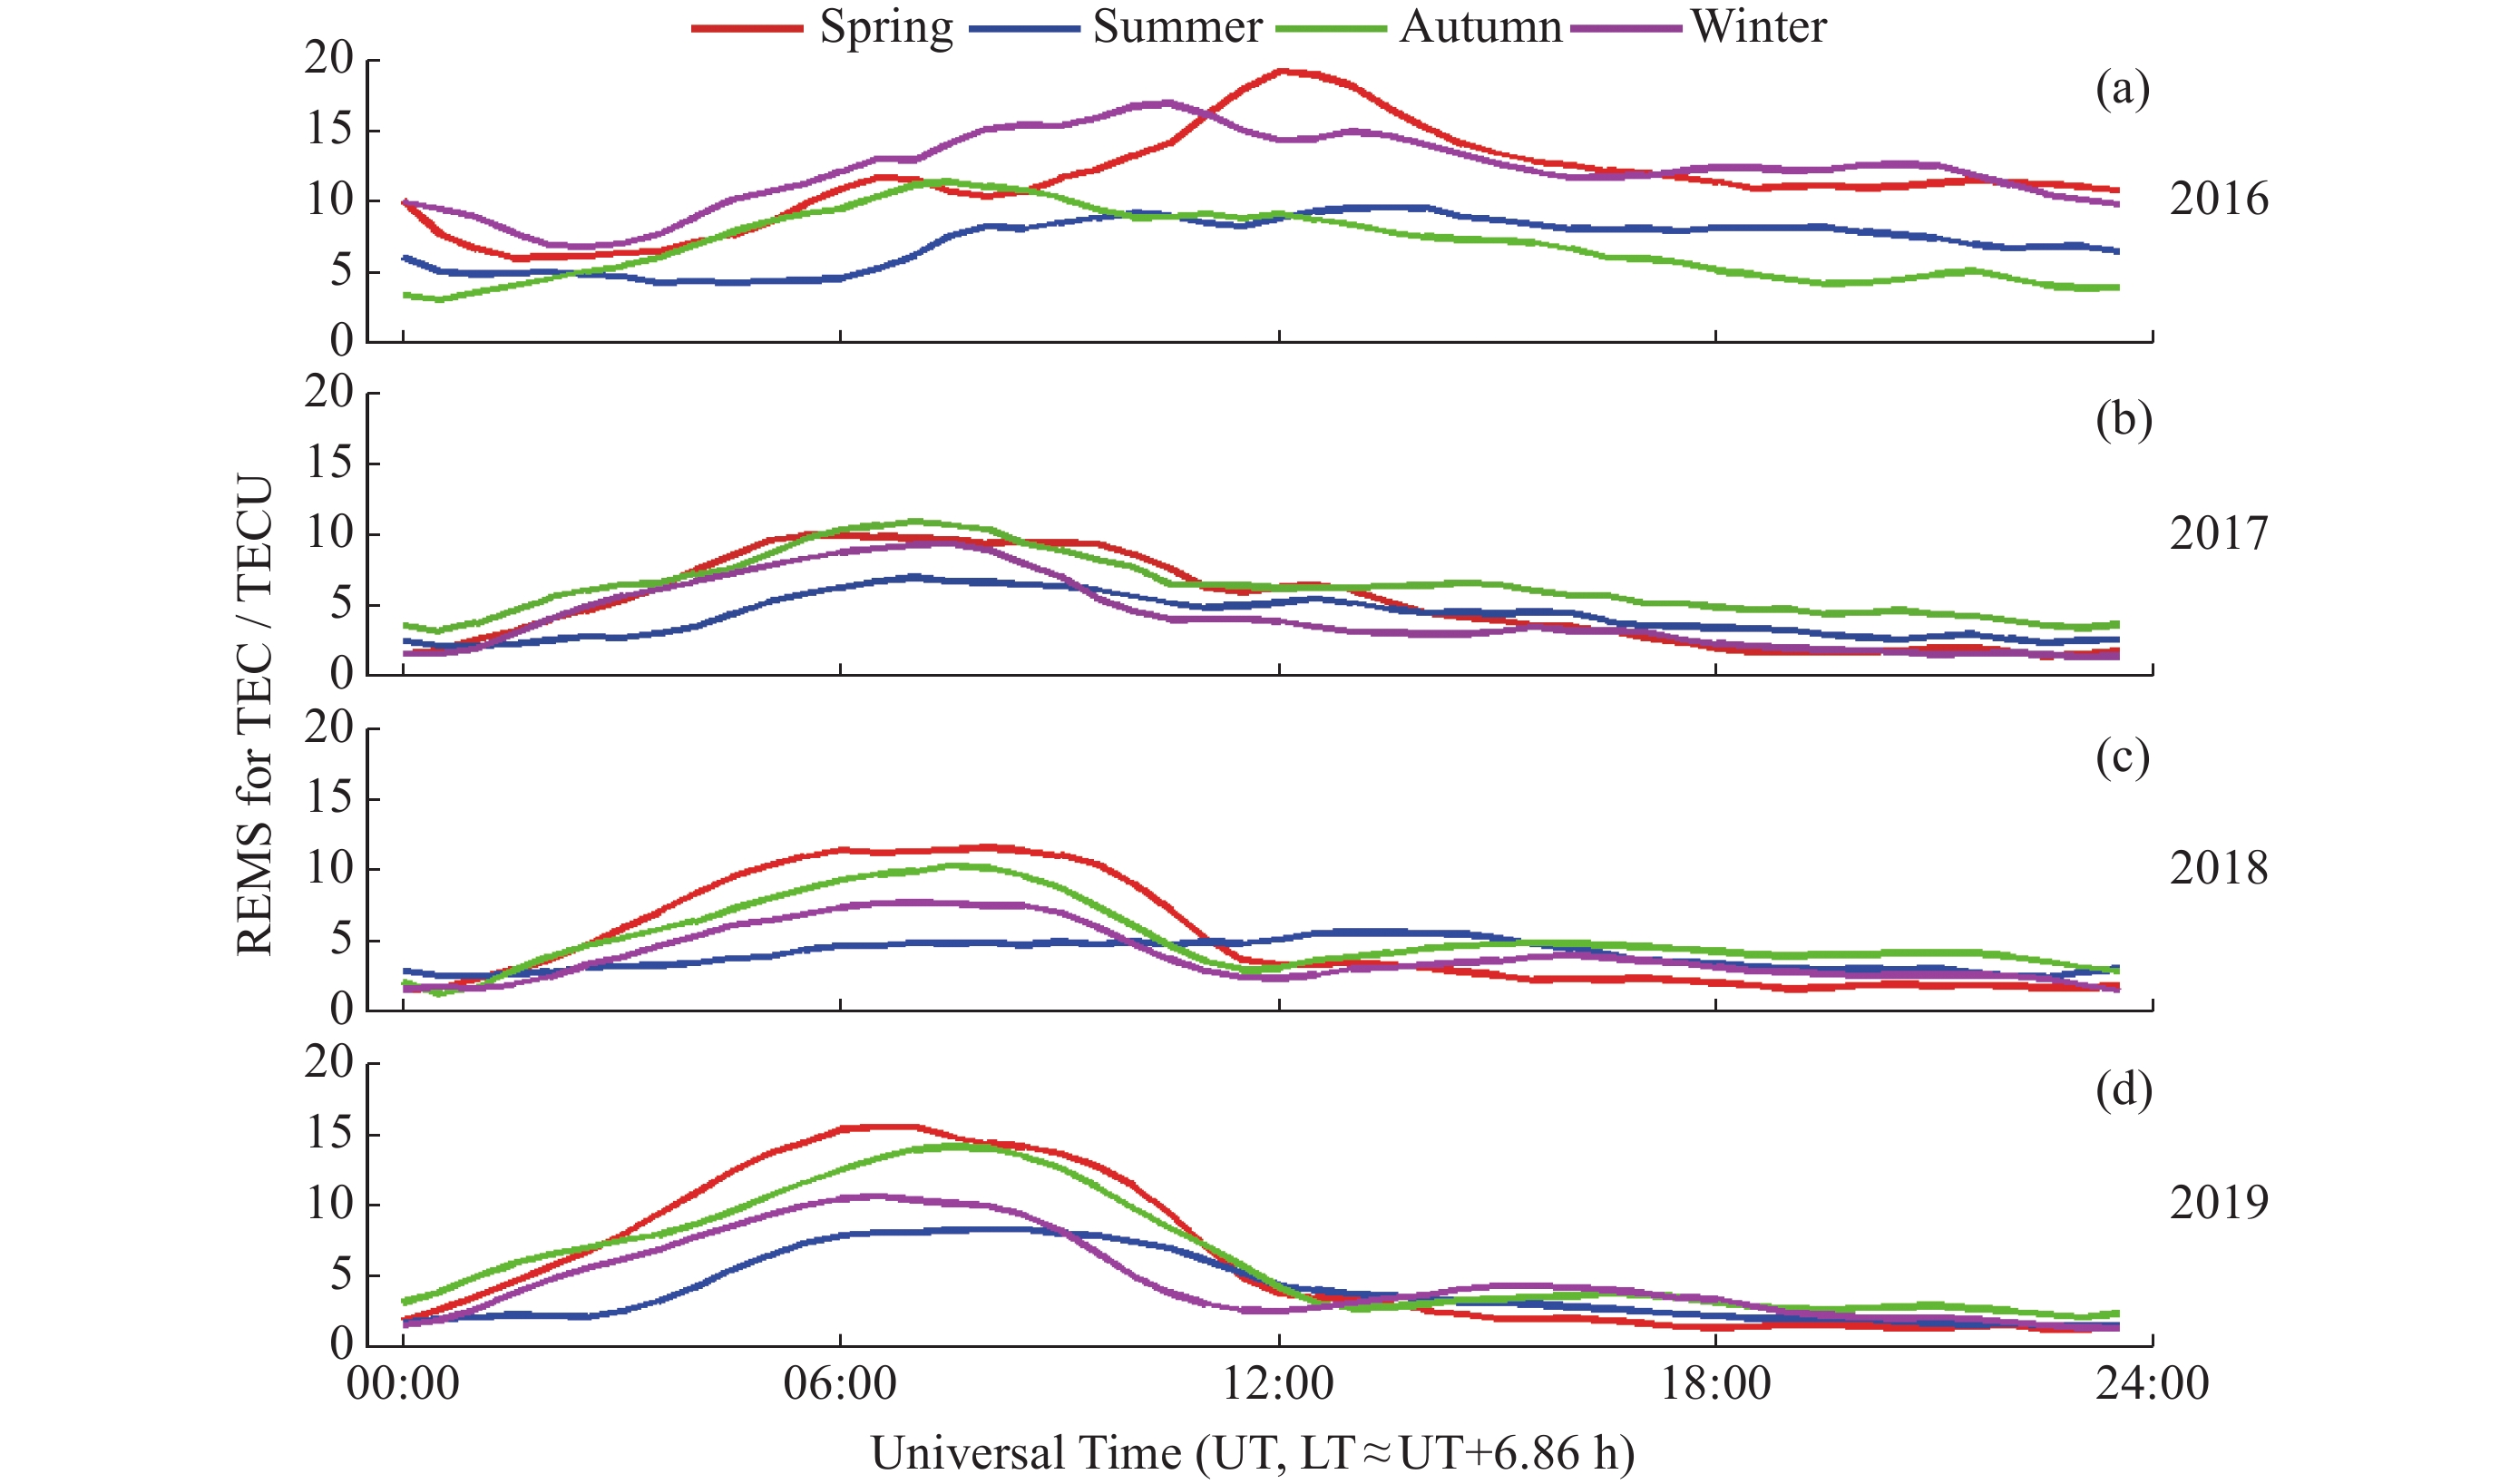
摘要: 利用昆明低纬度测站(24.7°N,102.9°E,磁纬15.1°N)2016-2019年的观测数据和最新版的国际参考电离层(IRI-2020)模拟结果,对昆明地区电离层总电子含量(TEC)在太阳活动下降年期间的变化特征及与模型输出进行对比研究。结果表明, 昆明TEC存在明显的春秋高值、夏冬低值的半年异常;白天高值、夜间低值的日变化特点突出,日峰值出现在06:30-08:00 UT(约13:00-15:00 LT);TEC随太阳活动减弱而明显下降,年平均峰值在2016-2019年分别为48,33,27,24 TECU;日峰值TEC与F10.7存在显著相关,月均值相关系数达到0.86,而与Ap指数则表现为弱相关; IRI-2020能较好地模拟昆明地区TEC的季节变化,但与观测值存在较大差异;均方根偏差值多集中在2~15 TECU,相对偏差百分比值主要在–85%~50%范围变化。对比结果表明IRI-2020的预测精度仍有待提高。
-
关键词:
- 电离层 /
- 总电子含量 /
- 变化特征 /
- 国际参考电离层-2020
Abstract: The variation characteristics of ionospheric Total Electron Content (TEC) recorded at the low latitude station, Kunming (24.7°N, 102.9°E, geomagnetic latitude 15.1°N) China, during the descending phase of solar activity in 2016-2019 and its comparison with the output by the latest version model of the International Reference Ionosphere (IRI-2020) have been studied and discussed in this paper. The results show that the TEC at Kunming has an obvious semi-annual anomaly, with the high values during the spring and autumn seasons while the low values during the summer and winter seasons. The diurnal variation of TEC is prominent with that the high value levels in daytime and the low value levels in nighttime, and the daily peak TEC at Kunming appears mainly between 06:30-08:00 UT (about 13:00-15:00 LT). The magnitudes of the average annual TEC decrease obviously as the solar activity weakens, with the values of 48, 33, 27 and 24 TECU during the year of 2016-2019, respectively. The correlation analysis results indicate that there is a significant correlation between the peak TEC and the F10.7, and with a correlation coefficient of 0.86 between the monthly value of peak TEC and F10.7, but shows weak correlation between the peak TEC and the Ap index during the descending phase of solar activity in 2016-2019. The comparative results reveal that the latest version of International Reference Ionosphere could simulate well the seasonal variation of TEC at Kunming. However, there is a big difference between the output value and the observed result. The values of the root mean square deviation from model prediction and observational results are mostly between 2~15 TECU, and the relative deviation percentage values are mainly between –85% and 50%, which manifest that the prediction accuracy of the model IRI-2020 still needs to be improved in the application of forecast.-
Key words:
- Ionosphere /
- Total electron content /
- Variation characteristic /
- IRI-2020
-

图 1 2016-2019年F10.7及Ap指数的变化情况
Figure 1. Variation conditions of F10.7 and Ap during 2016-2019
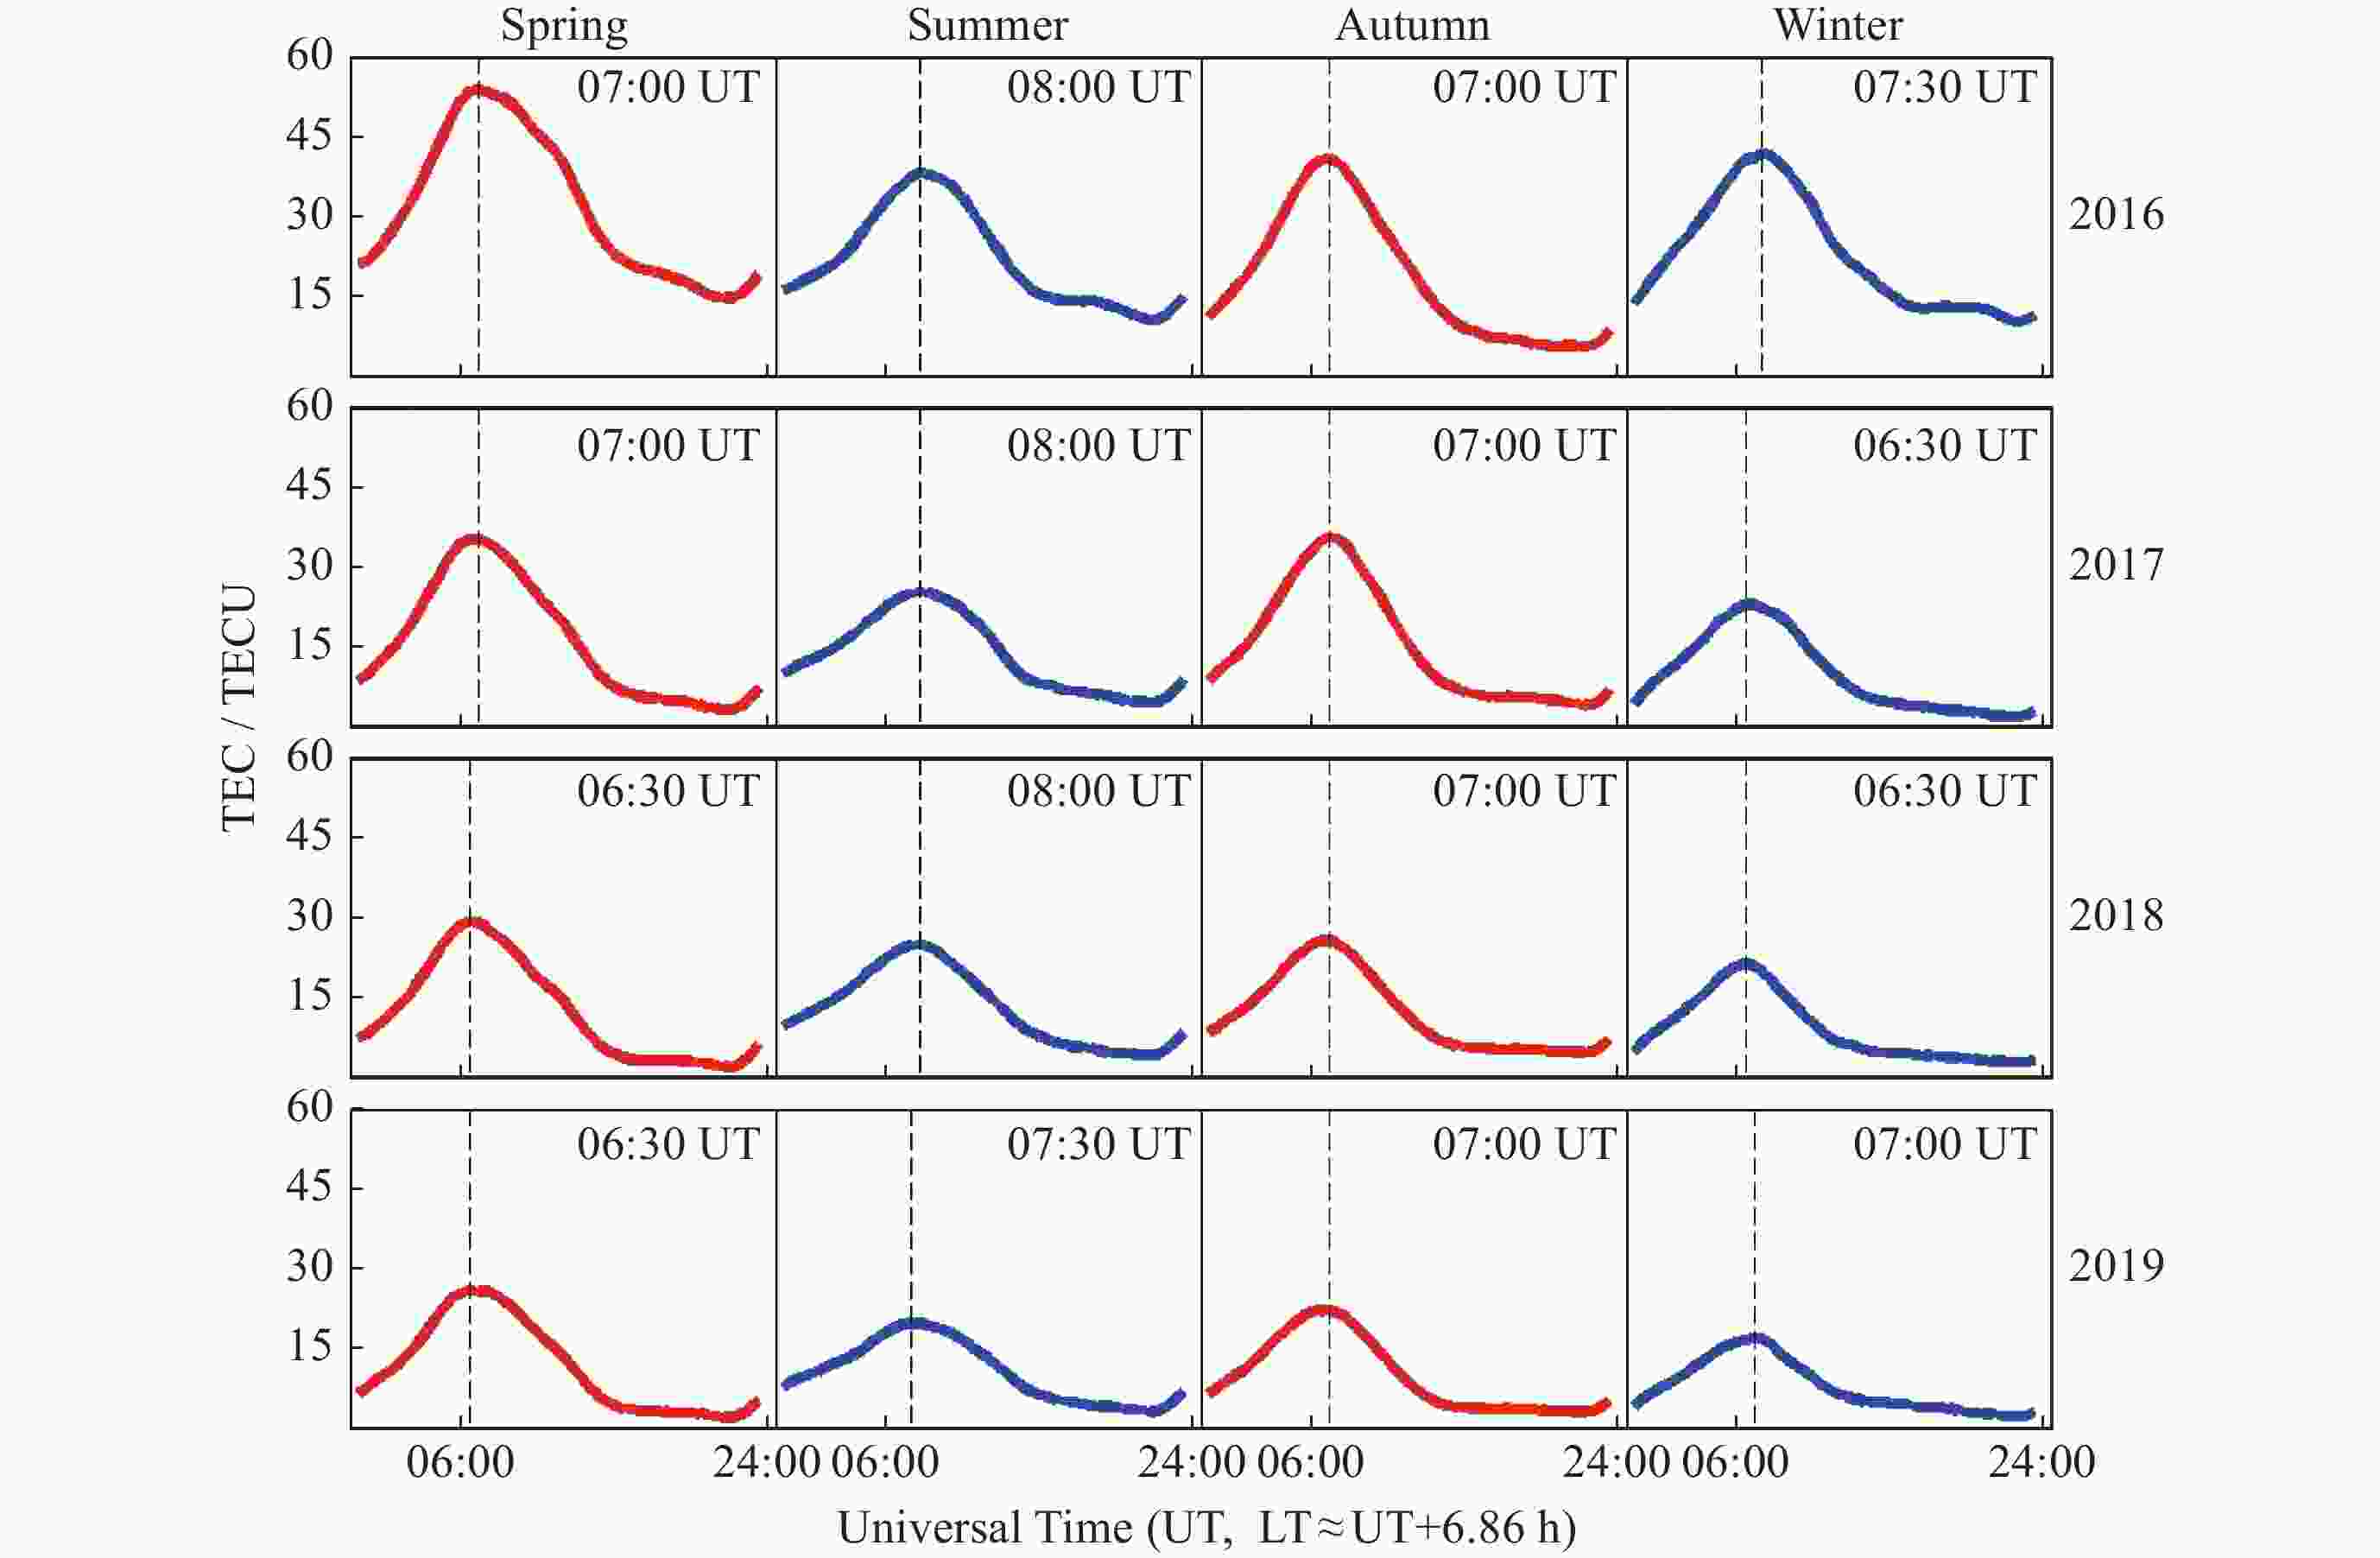
图 2 TEC在2016-2019年季节平均的日变化(虚线为各季节平均最高值对应的时间)
Figure 2. Diurnal variations of seasonal average of TEC during 2016-2019 (Dotted line is the time corresponding to the average maximum value of each season)
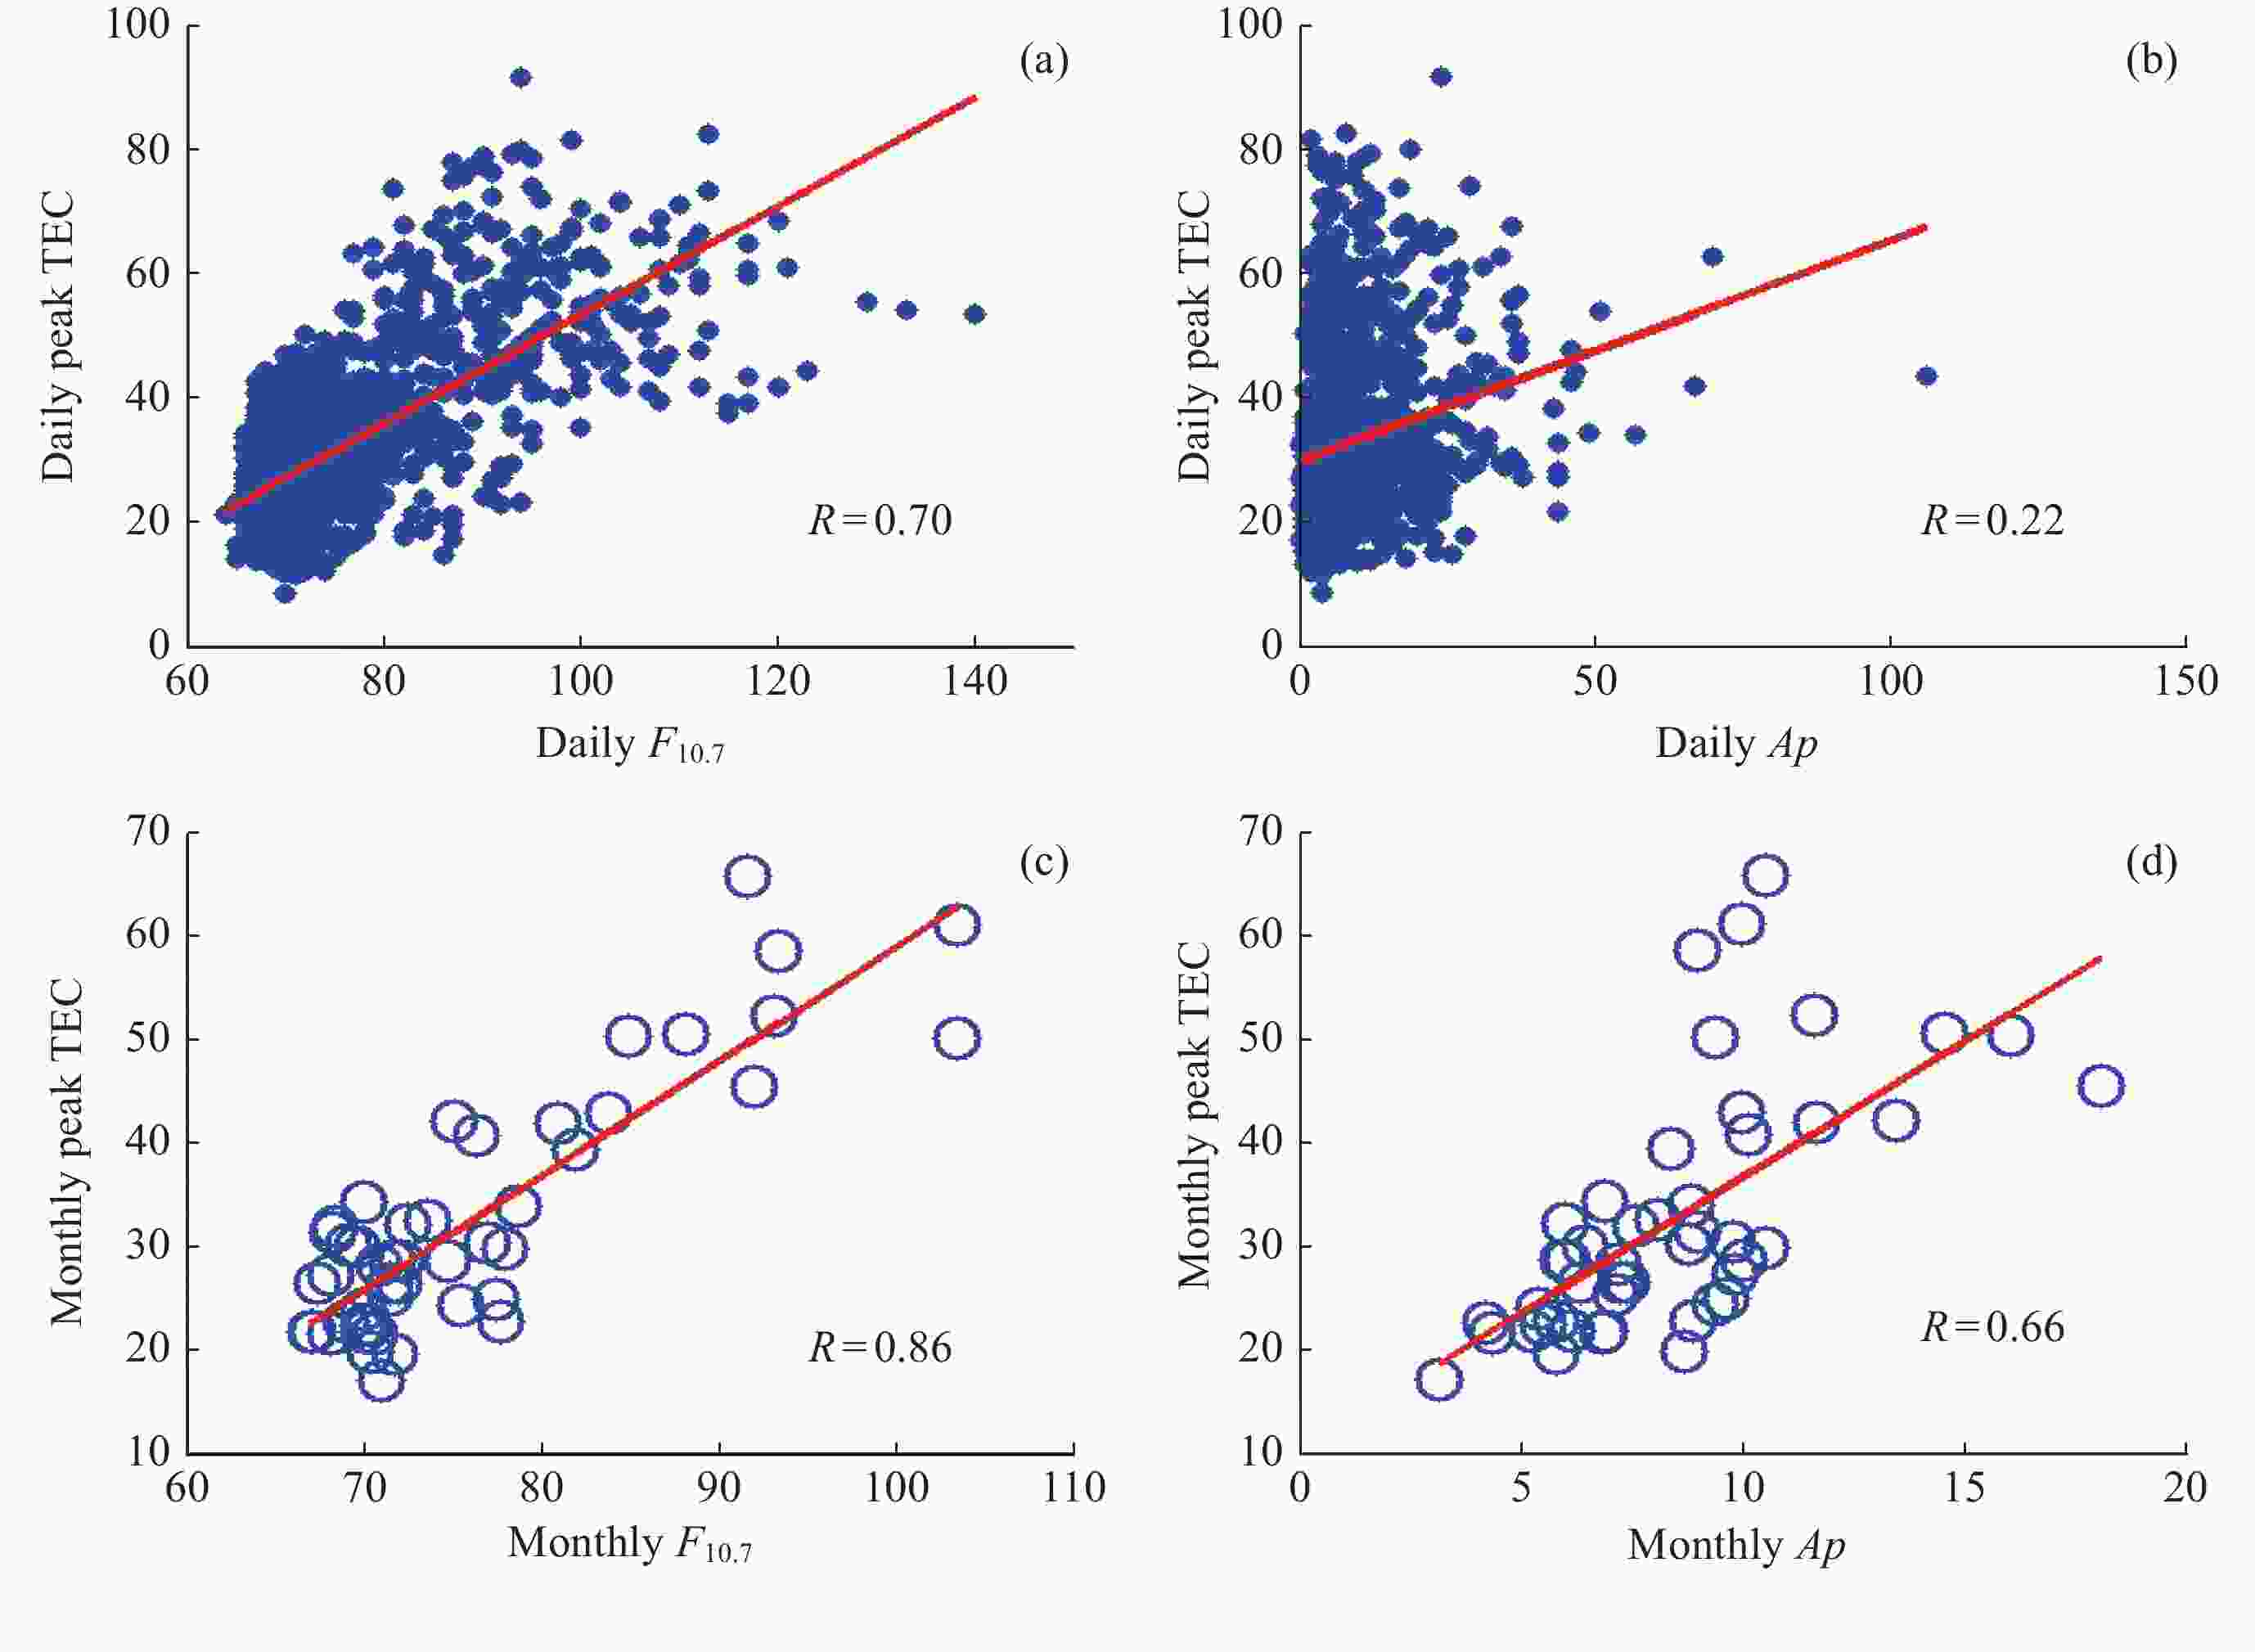
图 3 TEC日最大值和月均最大值与F10.7及Ap指数之间的相关系数(R为线性相关系数,红色直线是线性拟合结果)
Figure 3. Correlation coefficients among daily and monthly averaged peak TEC with F10.7 and Ap (R is linear correlation coefficient, and the red line is linear fitting result)
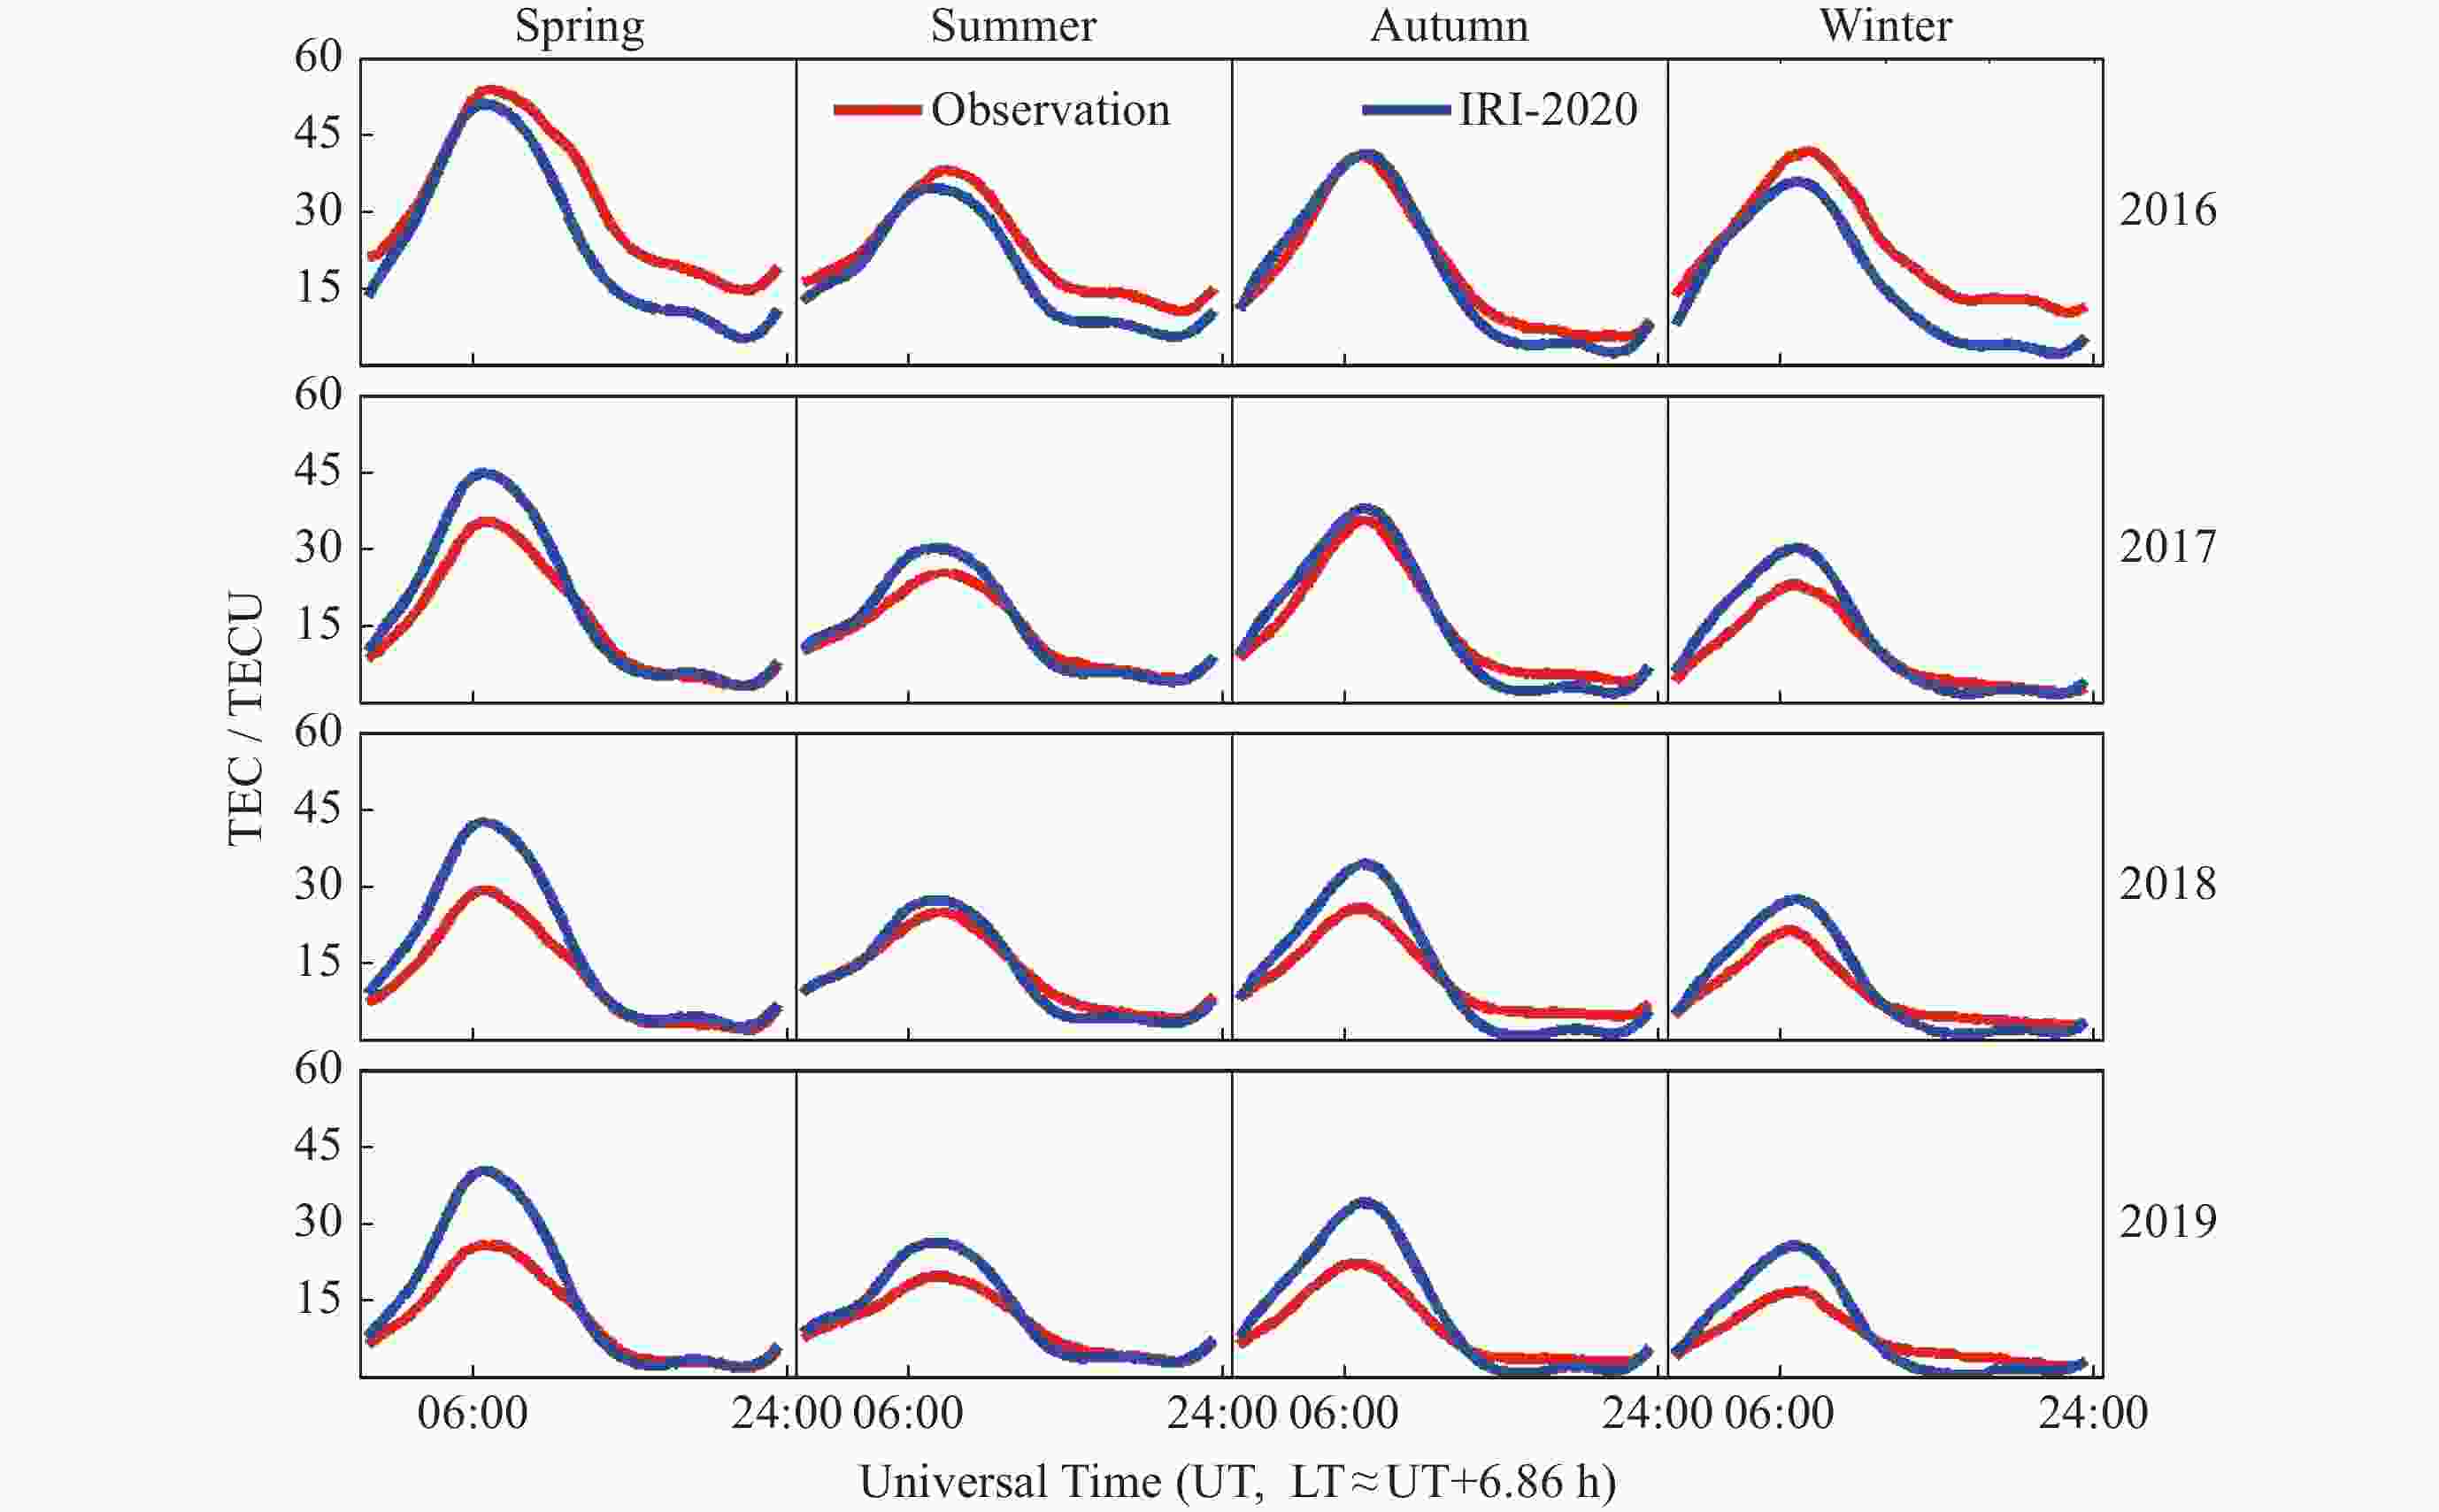
图 4 TEC观测值与IRI-2020模拟的季节平均值对比
Figure 4. Comparison of seasonal average of TEC from monitor and modeled by IRI-2020
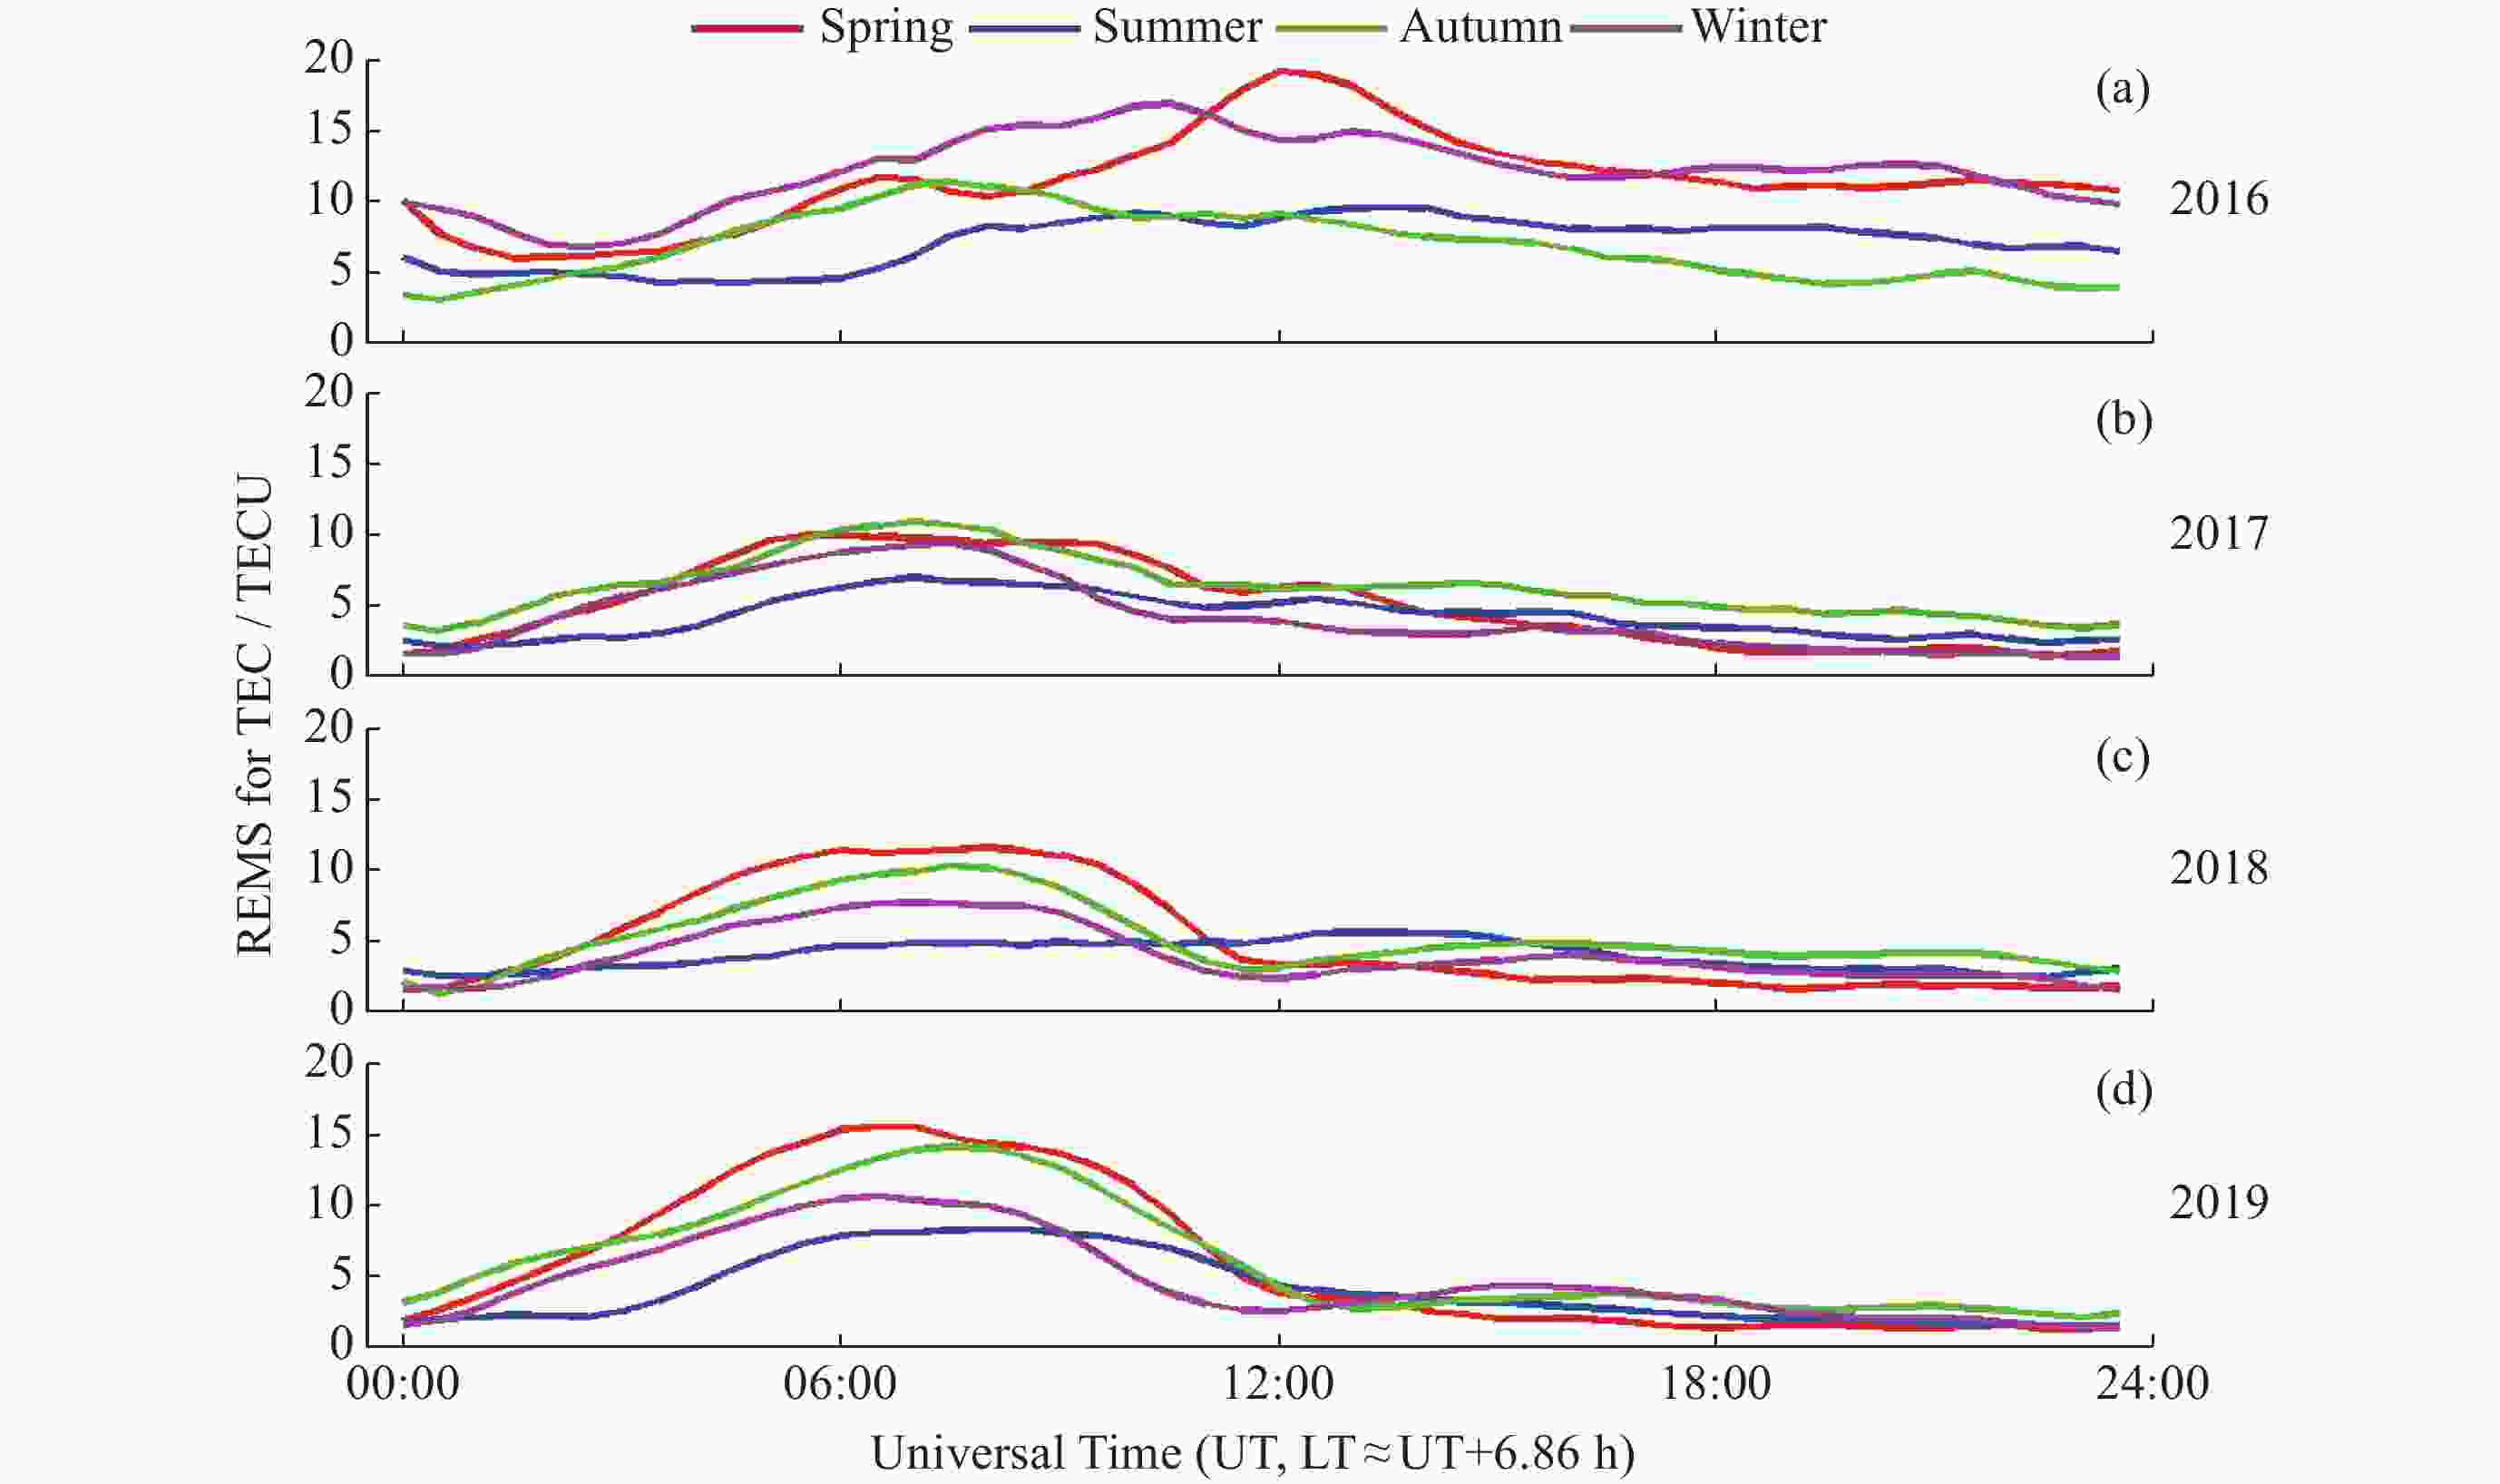
图 5 IRI-2020对观测值的均方根偏差值在不同季节的变化
Figure 5. Variations of REMS for TEC from IRI-2020 with observation in different seasons
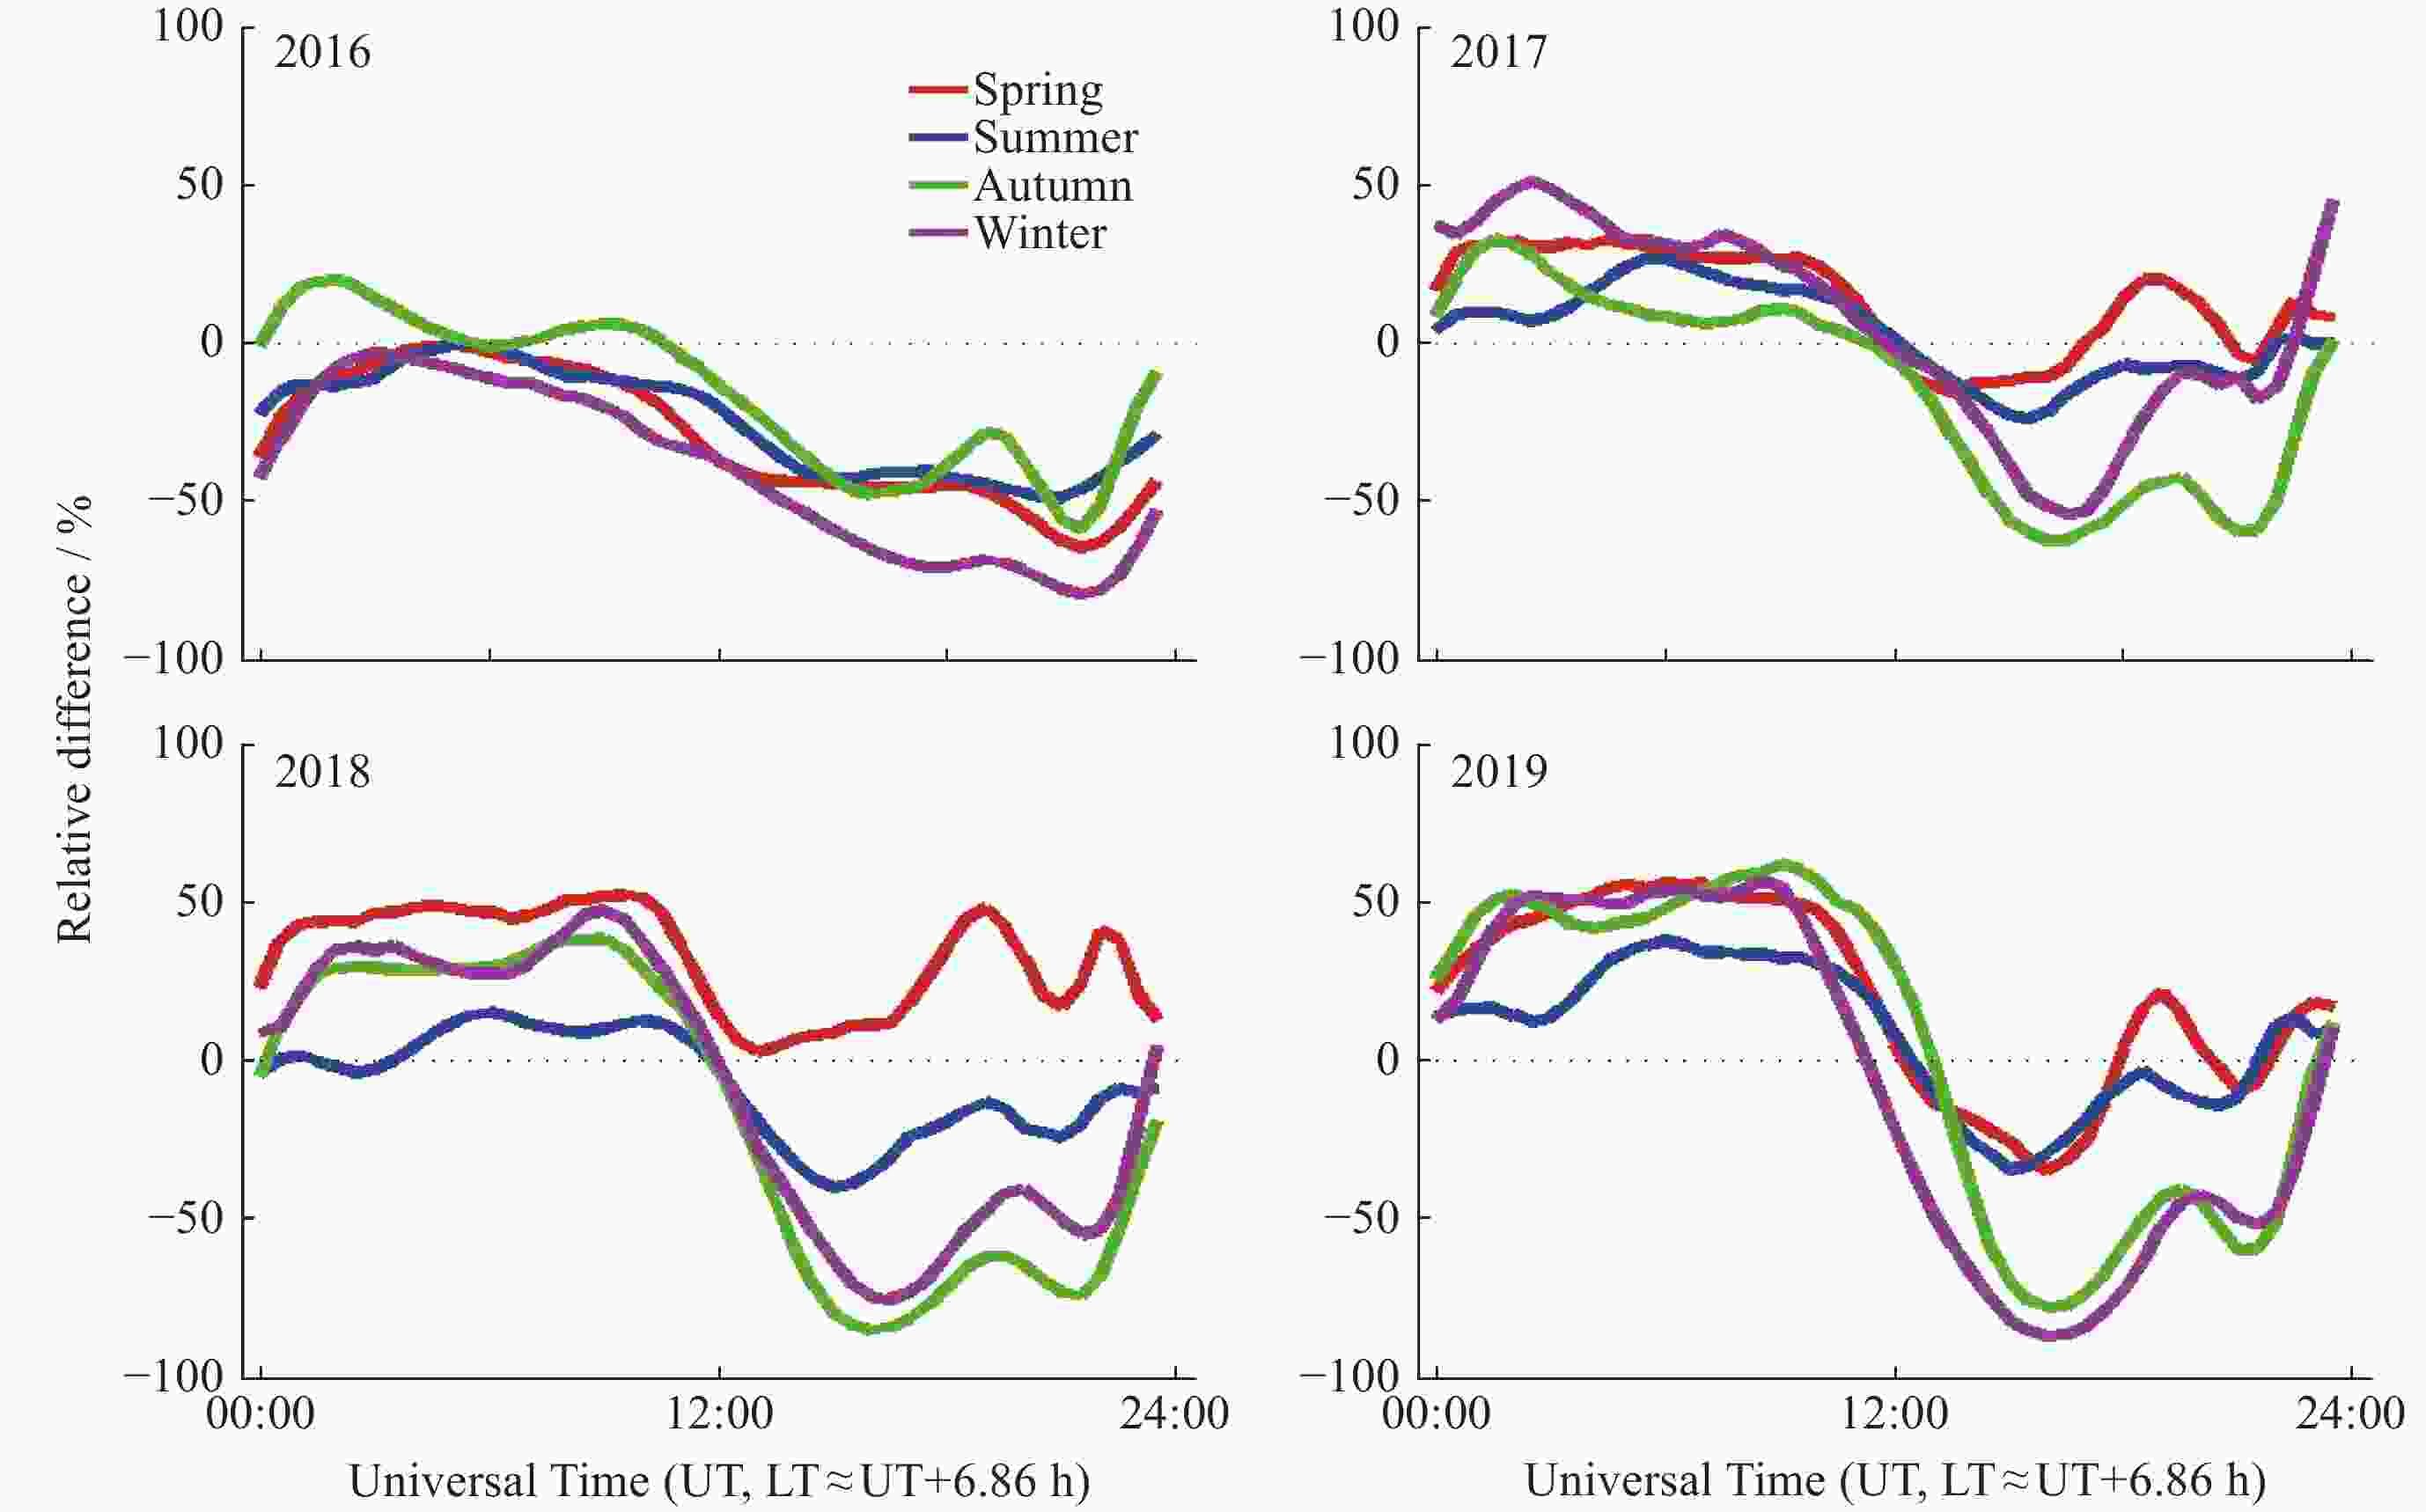
图 6 IRI-2020对观测值的相对偏差在2016-2019年中随季节和时间的分布
Figure 6. Daily and seasonal distributions of the relative difference of IRI-2020 with observation regardless seasons during 2016-2019
表 1 2016-2019年各季节及全年TEC最大 平均值(单位TECU)
Table 1. Seasonal and annually average peak value of TEC during 2016-2019 (unit TECU)
年 2016 2017 2018 2019 春 53.97 35.27 29.44 25.98 夏 38.36 25.35 25.02 19.7 秋 40.97 35.67 25.78 22.18 冬 41.86 23.05 21.52 16.99 全年 48.29 32.51 27.35 23.98  下载: 导出CSV
表 2 F10.7和Ap指数与峰值TEC 在不同年份 的相关系数统计值
Table 2. Statistical values of correlation coefficients among F10.7 and Ap with TEC in different years
年 F10.7与峰值TEC Ap与峰值TEC 每日 月均 每日 月均 2016-2017 0.61 0.83 0.09 0.39 2018-2019 0.08 0.04 0.19 0.62
下载: 导出CSV
-
[1] 刘立波, 万卫星. 我国空间物理研究进展[J]. 地球物理学报, 2014, 57(11): 3493-3501 doi: 10.6038/cjg20141101LIU Libo, WAN Weixing. A brief overview on the issue on space physics and space weather[J]. Chinese Journal of Geophysics, 2014, 57(11): 3493-3501 doi: 10.6038/cjg20141101 [2] PANDA S K, GEDAM S S, RAJARAM G. Study of Ionospheric TEC from GPS observations and comparisons with IRI and SPIM model predictions in the low latitude anomaly Indian subcontinental region[J]. Advances in Space Research, 2015, 55(8): 1948-1964 doi: 10.1016/j.asr.2014.09.004 [3] KLOBUCHAR J A. Ionospheric effects on GPS[J]. GPS World, 1991, 2(4): 48-51 [4] OLUWADARE T S, THAI C N, AKALA A O O, et al. Characterization of GPS-TEC over African equatorial ionization anomaly (EIA) region during 2009-2016[J]. Advances in Space Research, 2019, 63(1): 282-301 doi: 10.1016/j.asr.2018.08.044 [5] BALAN N, BAILEY G J. Equatorial plasma fountain and its effects: possibility of an additional layer[J]. Journal of Geophysical Research: Space Physics, 1995, 100(A11): 21421-21432 doi: 10.1029/95JA01555 [6] 萧佐, 张东和. 通过GPS测量数据研究电离层电子总含量的逐日变化[J]. 空间科学学报, 2000, 20(2): 97-102 doi: 10.3969/j.issn.0254-6124.2000.02.001XIAO Zuo, ZHANG Donghe. An approach to study the day-to-day variations of ionospheric TEC directly by GPS time-delay signals[J]. Chinese Journal of Space Science, 2000, 20(2): 97-102 doi: 10.3969/j.issn.0254-6124.2000.02.001 [7] 徐继生, 朱劼, 程光晖. 2004年11月强磁暴期间武汉电离层TEC的响应和振幅闪烁特征的GPS观测[J]. 地球物理学报, 2006, 49(4): 950-956 doi: 10.3321/j.issn:0001-5733.2006.04.004XU Jisheng, ZHU Jie, CHENG Guanghui. GPS observations of ionospheric effects of the major storm of Nov. 7-10, 2004[J]. Chinese Journal of Geophysics, 2006, 49(4): 950-956 doi: 10.3321/j.issn:0001-5733.2006.04.004 [8] 刘国其, 龚建村, 黄文耿, 等. 太阳活动低年低纬地区VTEC变化特性分析[J]. 空间科学学报, 2013, 33(3): 270-276 doi: 10.11728/cjss2013.03.270LIU Guoqi, GONG Jiancun, HUANG Wengeng, et al. Analysis of variation characteristic of VTEC in the low latitude region during low solar activity[J]. Chinese Journal of Space Science, 2013, 33(3): 270-276 doi: 10.11728/cjss2013.03.270 [9] BILITZA D, ALTADILL D, TRUHLIK V, et al. International reference ionosphere 2016: from ionospheric climate to real-time weather predictions[J]. Space Weather, 2017, 15(2): 418-429 doi: 10.1002/2016SW001593 [10] XIANG Y, YUAN Y B, WANG N B. Comparison of IRI-2012 and rapid GIMs with GNSS-derived TEC over China[M]//SUN J D, JIAO W H, WU H T, et al. China Satellite Navigation Conference (CSNC) 2014 Proceedings: Volume II. Berlin, Heidelberg: Springer, 2014: 465-476 [11] WAN Q T, MA G Y, LI J H, et al. A comparison of GPS-TEC with IRI-TEC at low latitudes in China in 2006[J]. Advances in Space Research, 2017, 60(2): 250-256 doi: 10.1016/j.asr.2016.12.002 [12] WAN Q T, MA G Y, LI J H, et al. Performance evaluation of IRI-2016 with GPS-derived TEC at the meridian of 110o E in China of 2014[J]. Journal of Atmospheric and Solar–Terrestrial Physics, 2020, 201: 105206 doi: 10.1016/j.jastp.2020.105206 [13] DAVIES K. Ionospheric Radio[M]. London: Peter Peregrinus Ltd, 1990 [14] BAGIYA M S, JOSHI H P, IYER K N, et al. TEC variations during low solar activity period (2005– 2007) near the equatorial ionospheric anomaly crest region in India[J]. Annales Geophysicae, 2009, 27(3): 1047-1057 doi: 10.5194/angeo-27-1047-2009 [15] RISHBETH H, LYON A J, PEART M. Diffusion in the equatorial F layer[J]. Journal of Geophysics Research, 1963, 68(9): 2559-2569 doi: 10.1029/JZ068i009p02559 [16] TITHERIDGE J E. Winds in the ionosphere–A review[J]. Journal of Atmospheric and Terrestrial Physics, 1995, 57(14): 1681-1714 doi: 10.1016/0021-9169(95)00091-F [17] FEJER B G. Low latitude electrodynamic plasma drifts: a review[J]. Journal of Atmospheric and Terrestrial Physics, 1991, 53(8): 677-693 doi: 10.1016/0021-9169(91)90121-M [18] RISHBETH H, MÜLLER-WODARG I C F, ZOU L, et al. Annual and semiannual variations in the ionospheric F2-layer: II. Physical discussion[J]. Annales Geophysicae, 2000, 18(8): 945-956 doi: 10.1007/s00585-000-0945-6 [19] AKALA A O O, OYEDOKUN O J, BELLO D. Seasonal variation of quiet-time TEC over West and Central African equatorial/low-latitude ionosphere (2011-2014)[J]. Acta Geophysica, 2021, 69(6): 2483-2495 doi: 10.1007/s11600-021-00679-2 [20] BHUYAN P K, BORAH R R. TEC derived from GPS network in India and comparison with the IRI[J]. Advances in Space Research, 2007, 39(5): 830-840 doi: 10.1016/j.asr.2006.12.042 [21] WU C C, LIOU K, SHAN S J, et al. Variation of ionospheric total electron content in Taiwan region of the equatorial anomaly from 1994 to 2003[J]. Advances in Space Research, 2008, 41(4): 611-616 doi: 10.1016/j.asr.2007.06.013 [22] ABDU M A, BRUM C G M, BATISTA I S, et al. Solar flux effects on equatorial ionization anomaly and total electron content over Brazil: observational results versus IRI representations[J]. Advances in Space Research, 2008, 42(4): 617-625 doi: 10.1016/j.asr.2007.09.043 [23] KOURIS S S, POLIMERIS K V, Cander L R, et al. Solar and latitude dependence of TEC and SLAB thickness[J]. Journal of Atmospheric and Solar-Terrestrial Physics, 2008, 70(10): 1351-1365 doi: 10.1016/j.jastp.2008.03.009 [24] DABAS R S, LAKSHMI D R, REDDY B M. Solar activity dependence of ionospheric electron content and slab thickness using different solar indices[J]. Pure and Applied Geophysics, 1993, 140(4): 721-728 doi: 10.1007/BF00876585 [25] PATEL N C, KARIA S P, PATHAK K N. GPS-TEC variation during low to high solar activity period (2010-2014) under the northern crest of Indian equatorial ionization anomaly region[J]. Positioning, 2017, 8(2): 13-35 doi: 10.4236/pos.2017.82002 [26] LISSA D, VENKATESH K, PRASAD D S V V D, et al. GPS TEC variations under quiet and disturbed geomagnetic conditions during the descending phase of 24 th solar cycle over the Indian equatorial and low latitude regions[J]. Advances in Space Research, 2021, 68(4): 1836-1849 doi: 10.1016/j.asr.2021.04.021 [27] BHUYAN P K, HAZARIKA R. GPS TEC near the crest of the EIA at 95°E during the ascending half of solar cycle 24 and comparison with IRI simulations[J]. Advances in Space Research, 2013, 52(7): 1247-1260 doi: 10.1016/j.asr.2013.06.029 [28] CHAKRABORTY M, KUMAR S, KUMAR DE B, et al. Latitudinal characteristics of GPS derived ionospheric TEC: a comparative study with IRI 2012 model[J]. Annals of Geophysics, 2014, 57(5): A0539 [29] KUMAR S, TAN E L, MURTI D S. Impacts of solar activity on performance of the IRI-2012 model predictions from low to mid latitudes[J]. Earth, Planets and Space, 2015, 67: 42 doi: 10.1186/s40623-015-0205-3 [30] COÏSSON P, RADICELLA S M. Ionospheric topside models compared with experimental electron density profiles[J]. Annals of Geophysics, 2005, 48(3): 497-503 [31] KARIA S P, PATEL N C, PATHAK K N. A comparison of TEC predicted by IRI-2012 with that measured at three different stations in low latitude Indian region for the years (2010-2012)[J]. Advances in Space Research, 2017, 60(2): 238-249 doi: 10.1016/j.asr.2016.10.022 -
-

 下载:
下载:


计量
- 文章访问数: 842
- HTML全文浏览量: 440
- PDF下载量: 70
-
被引次数:
0(来源:Crossref)
0(来源:其他)

