Seasonal Variation Characteristics of Sodium Layer in Low Latitude by Lidar
-
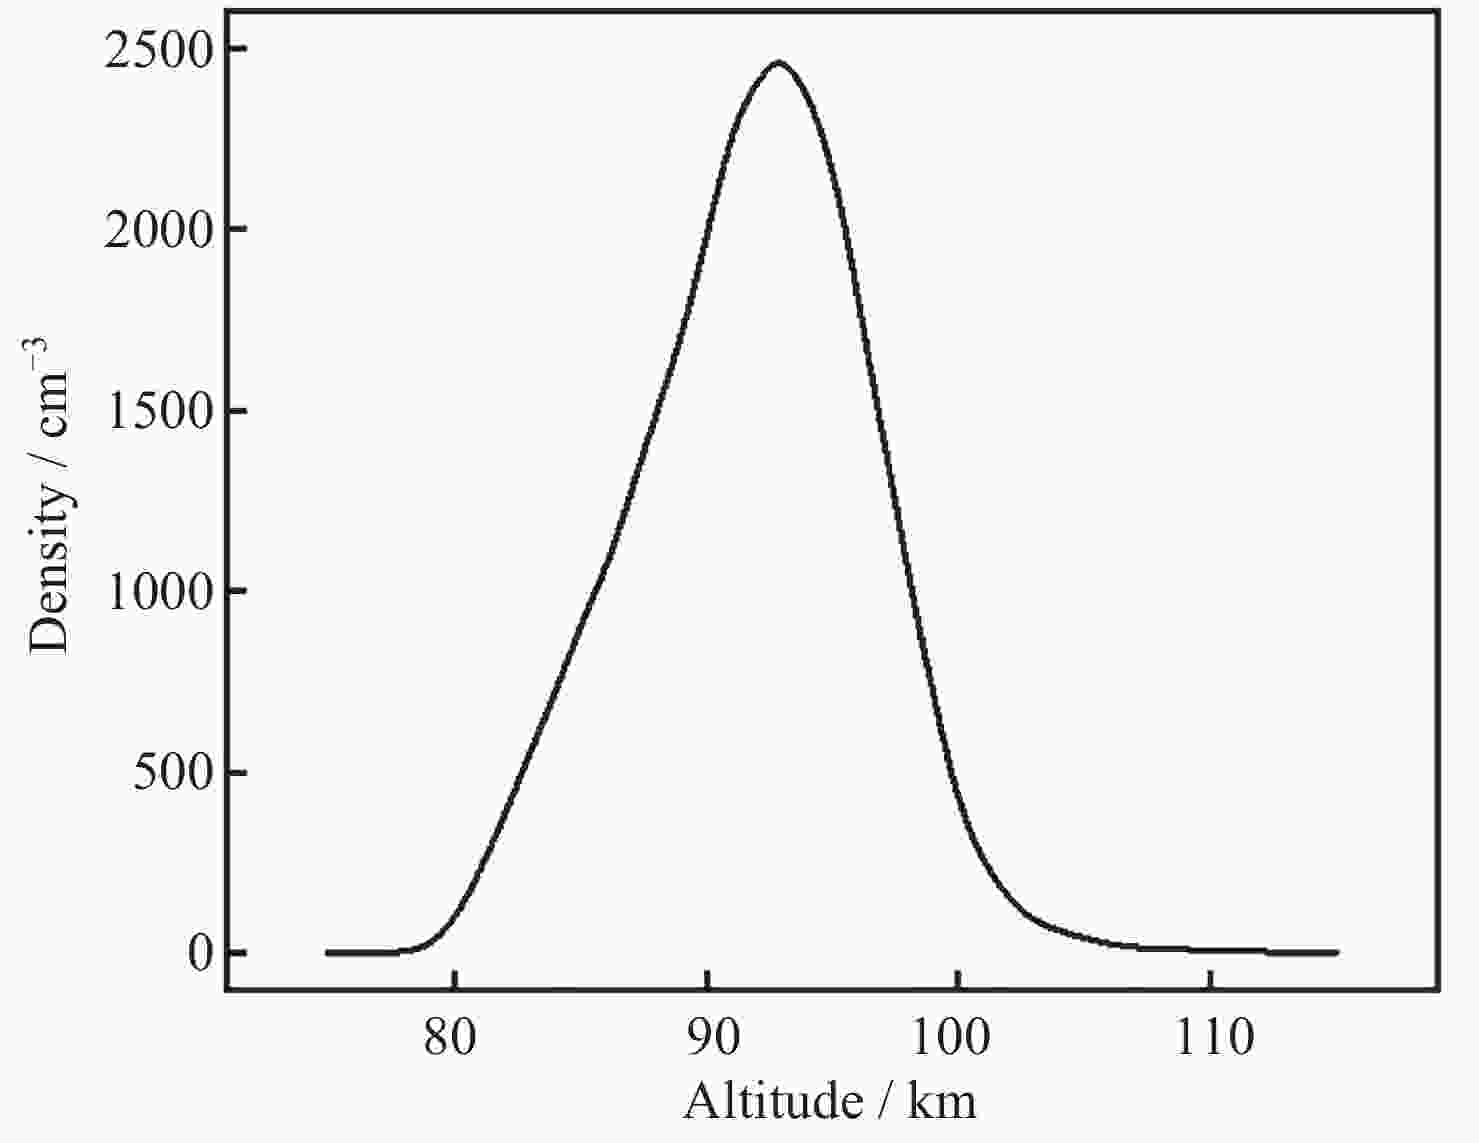
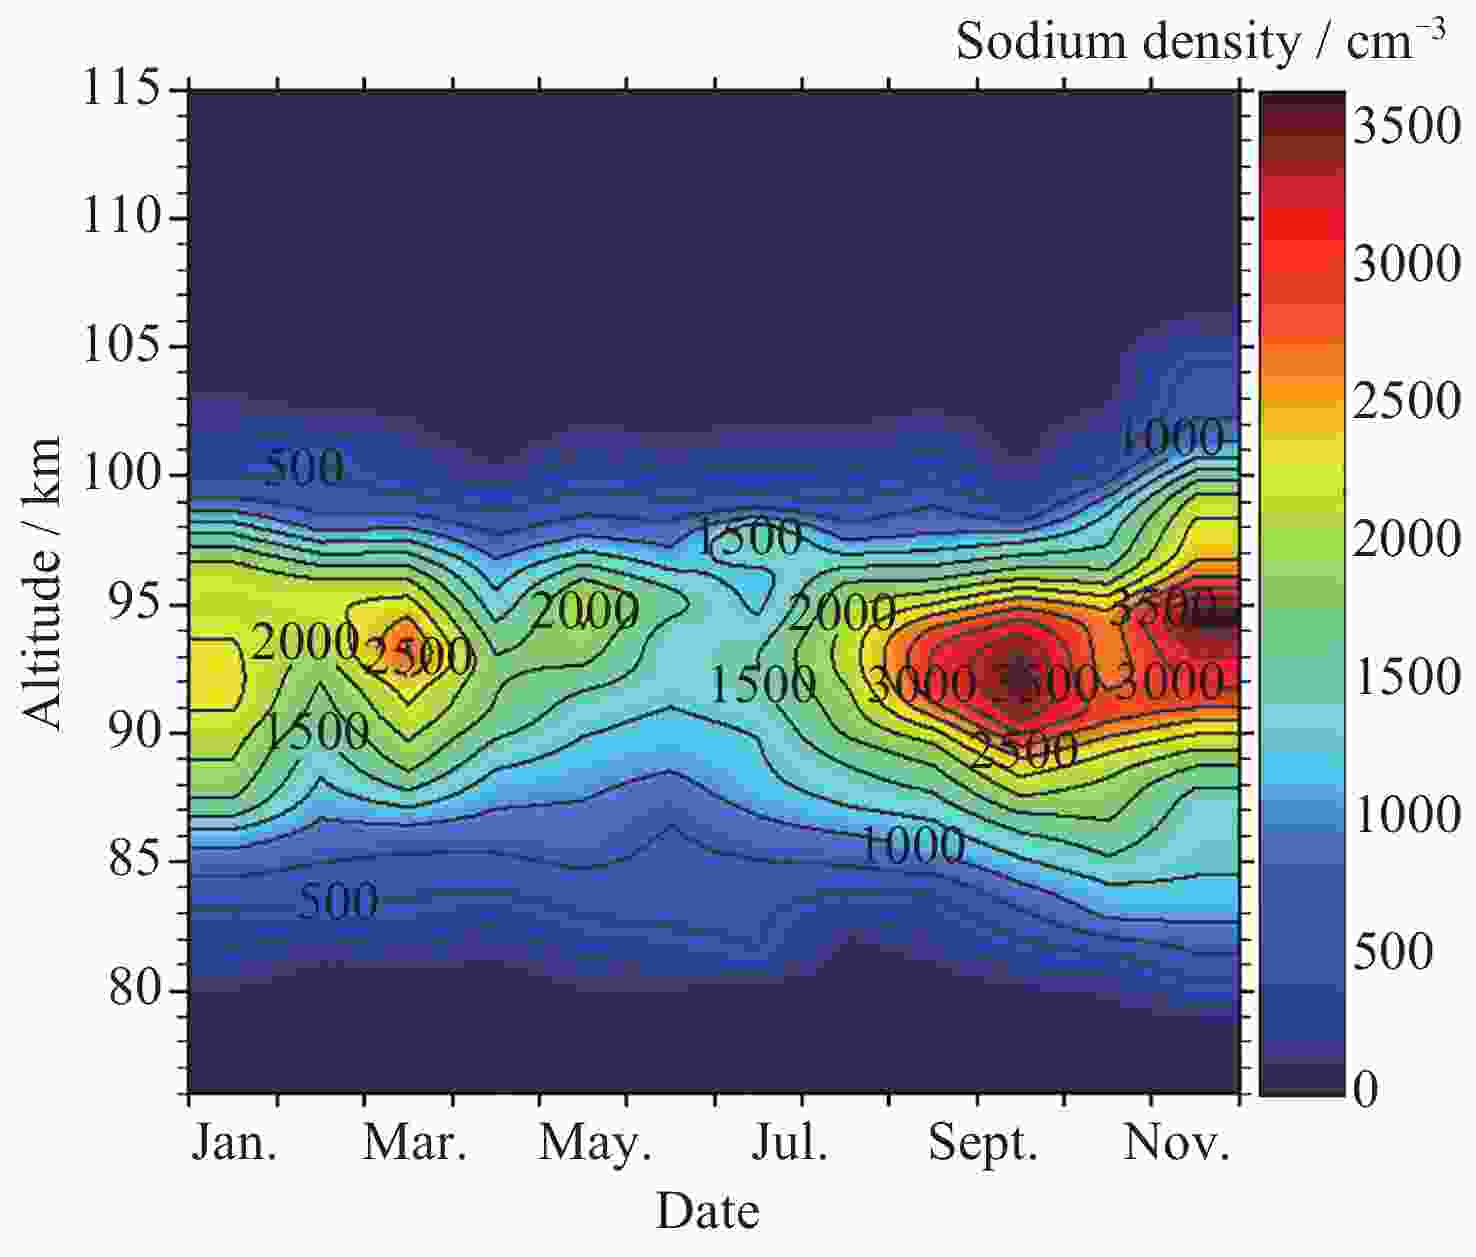
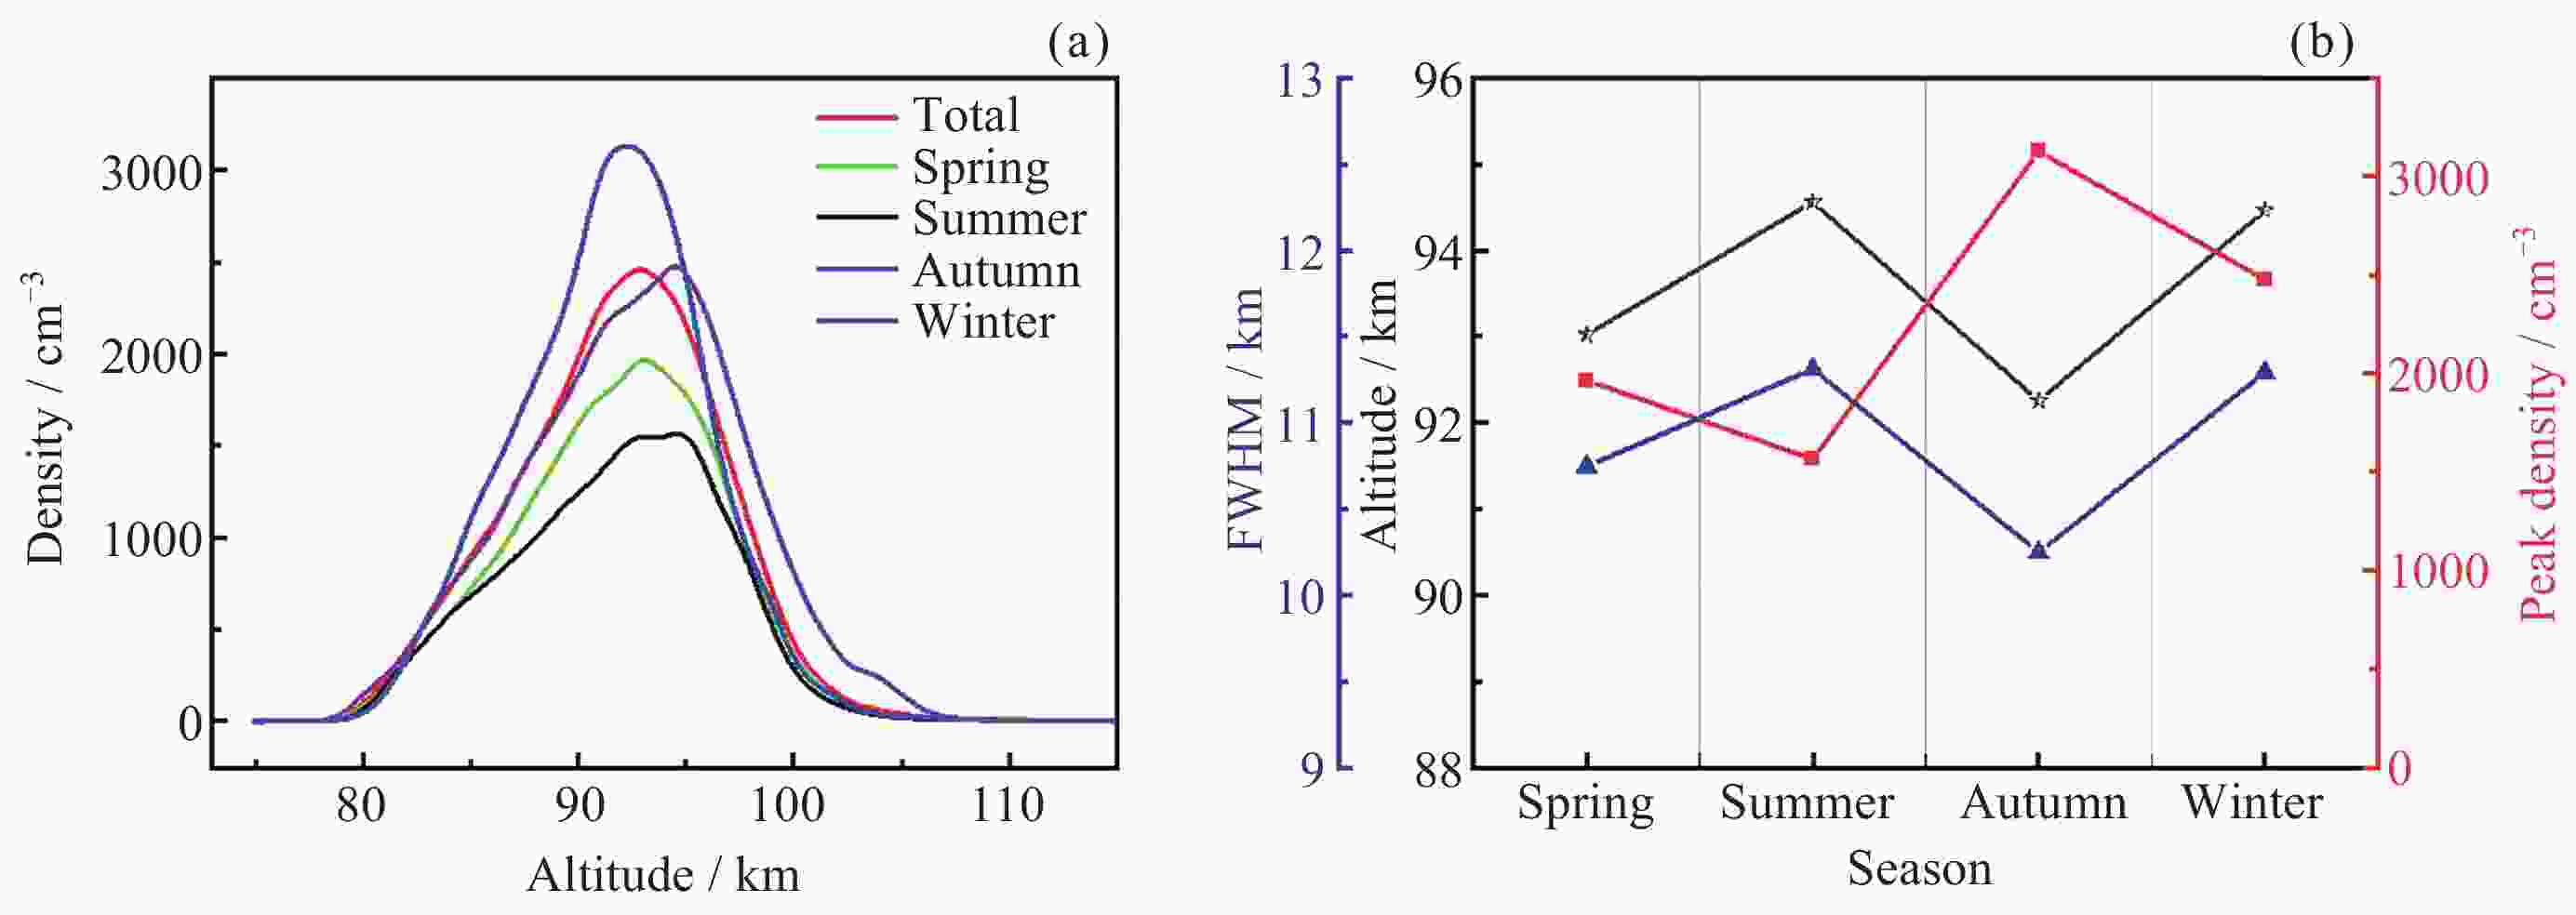
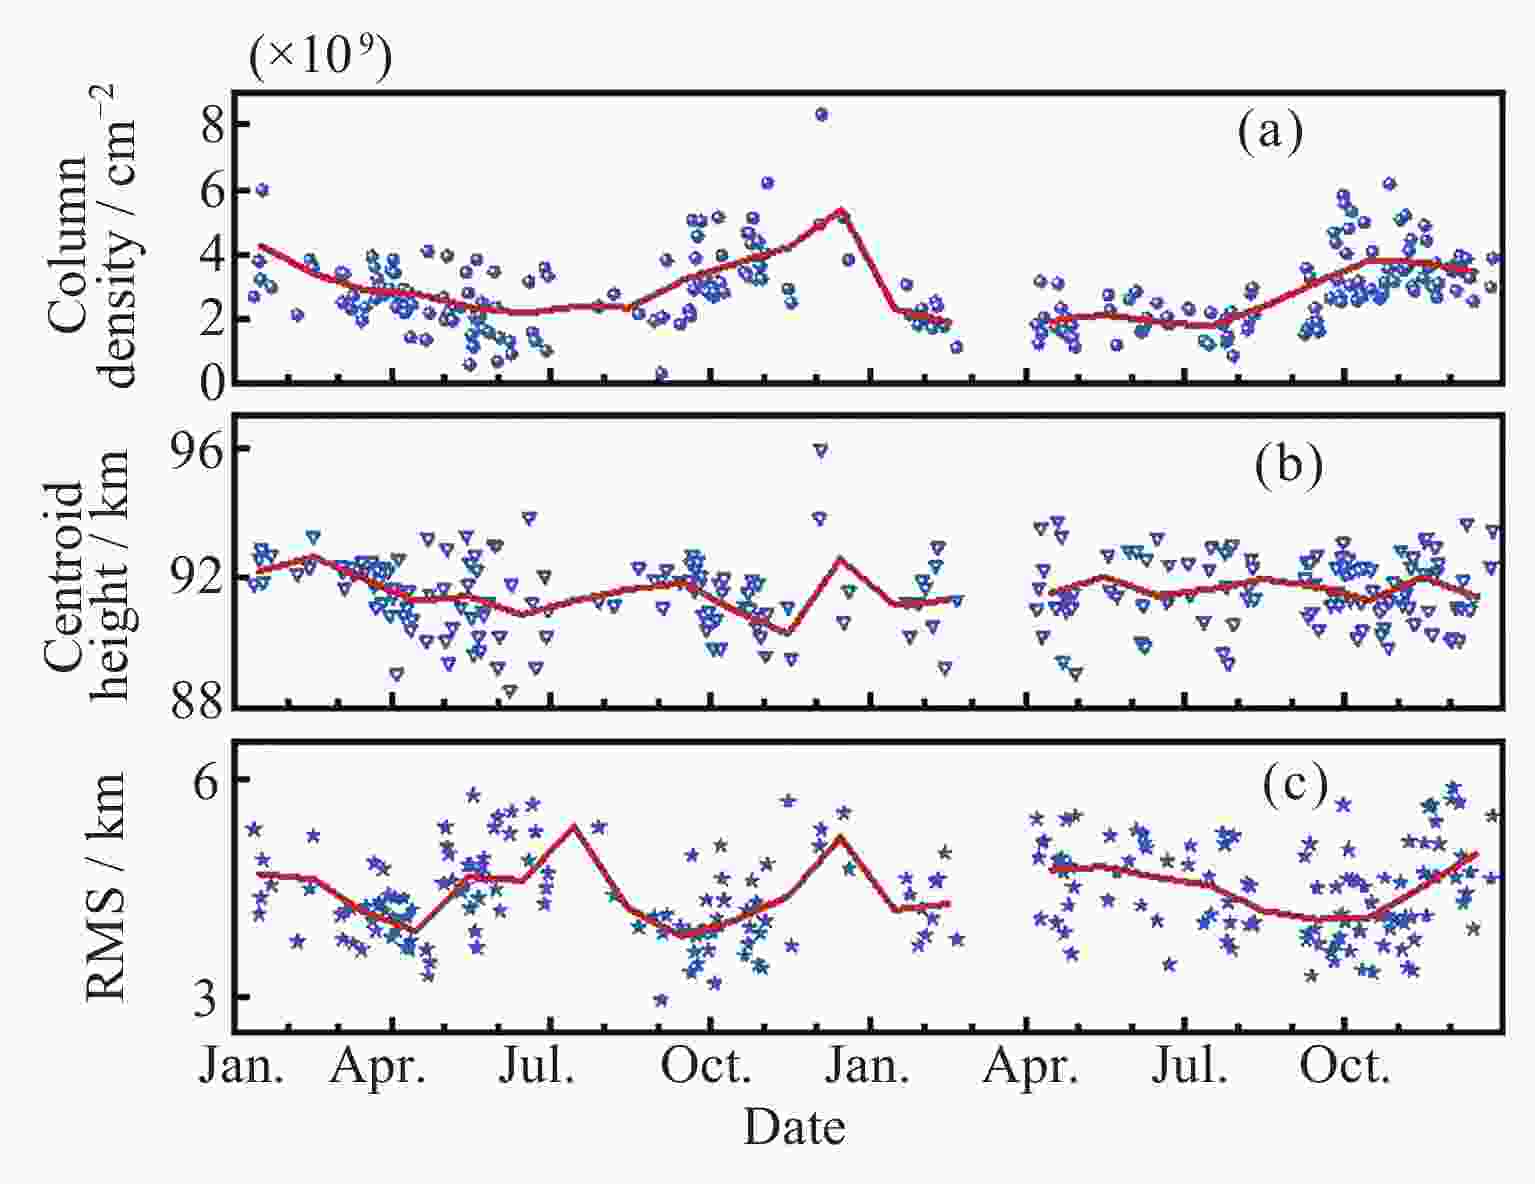
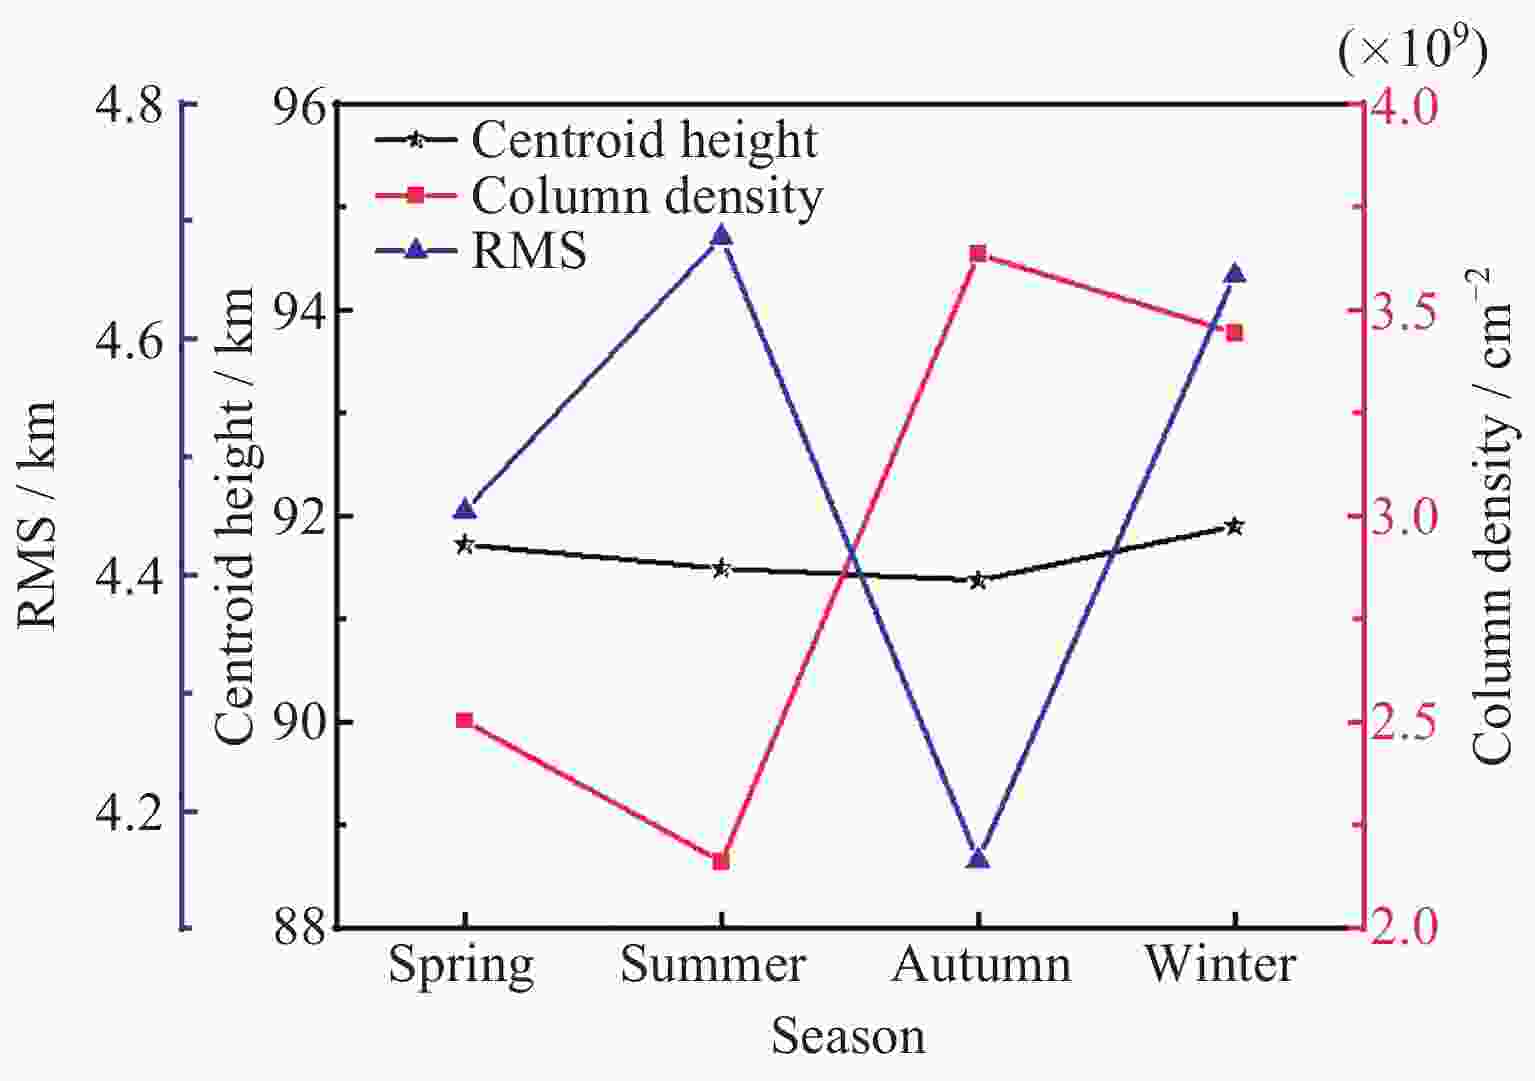
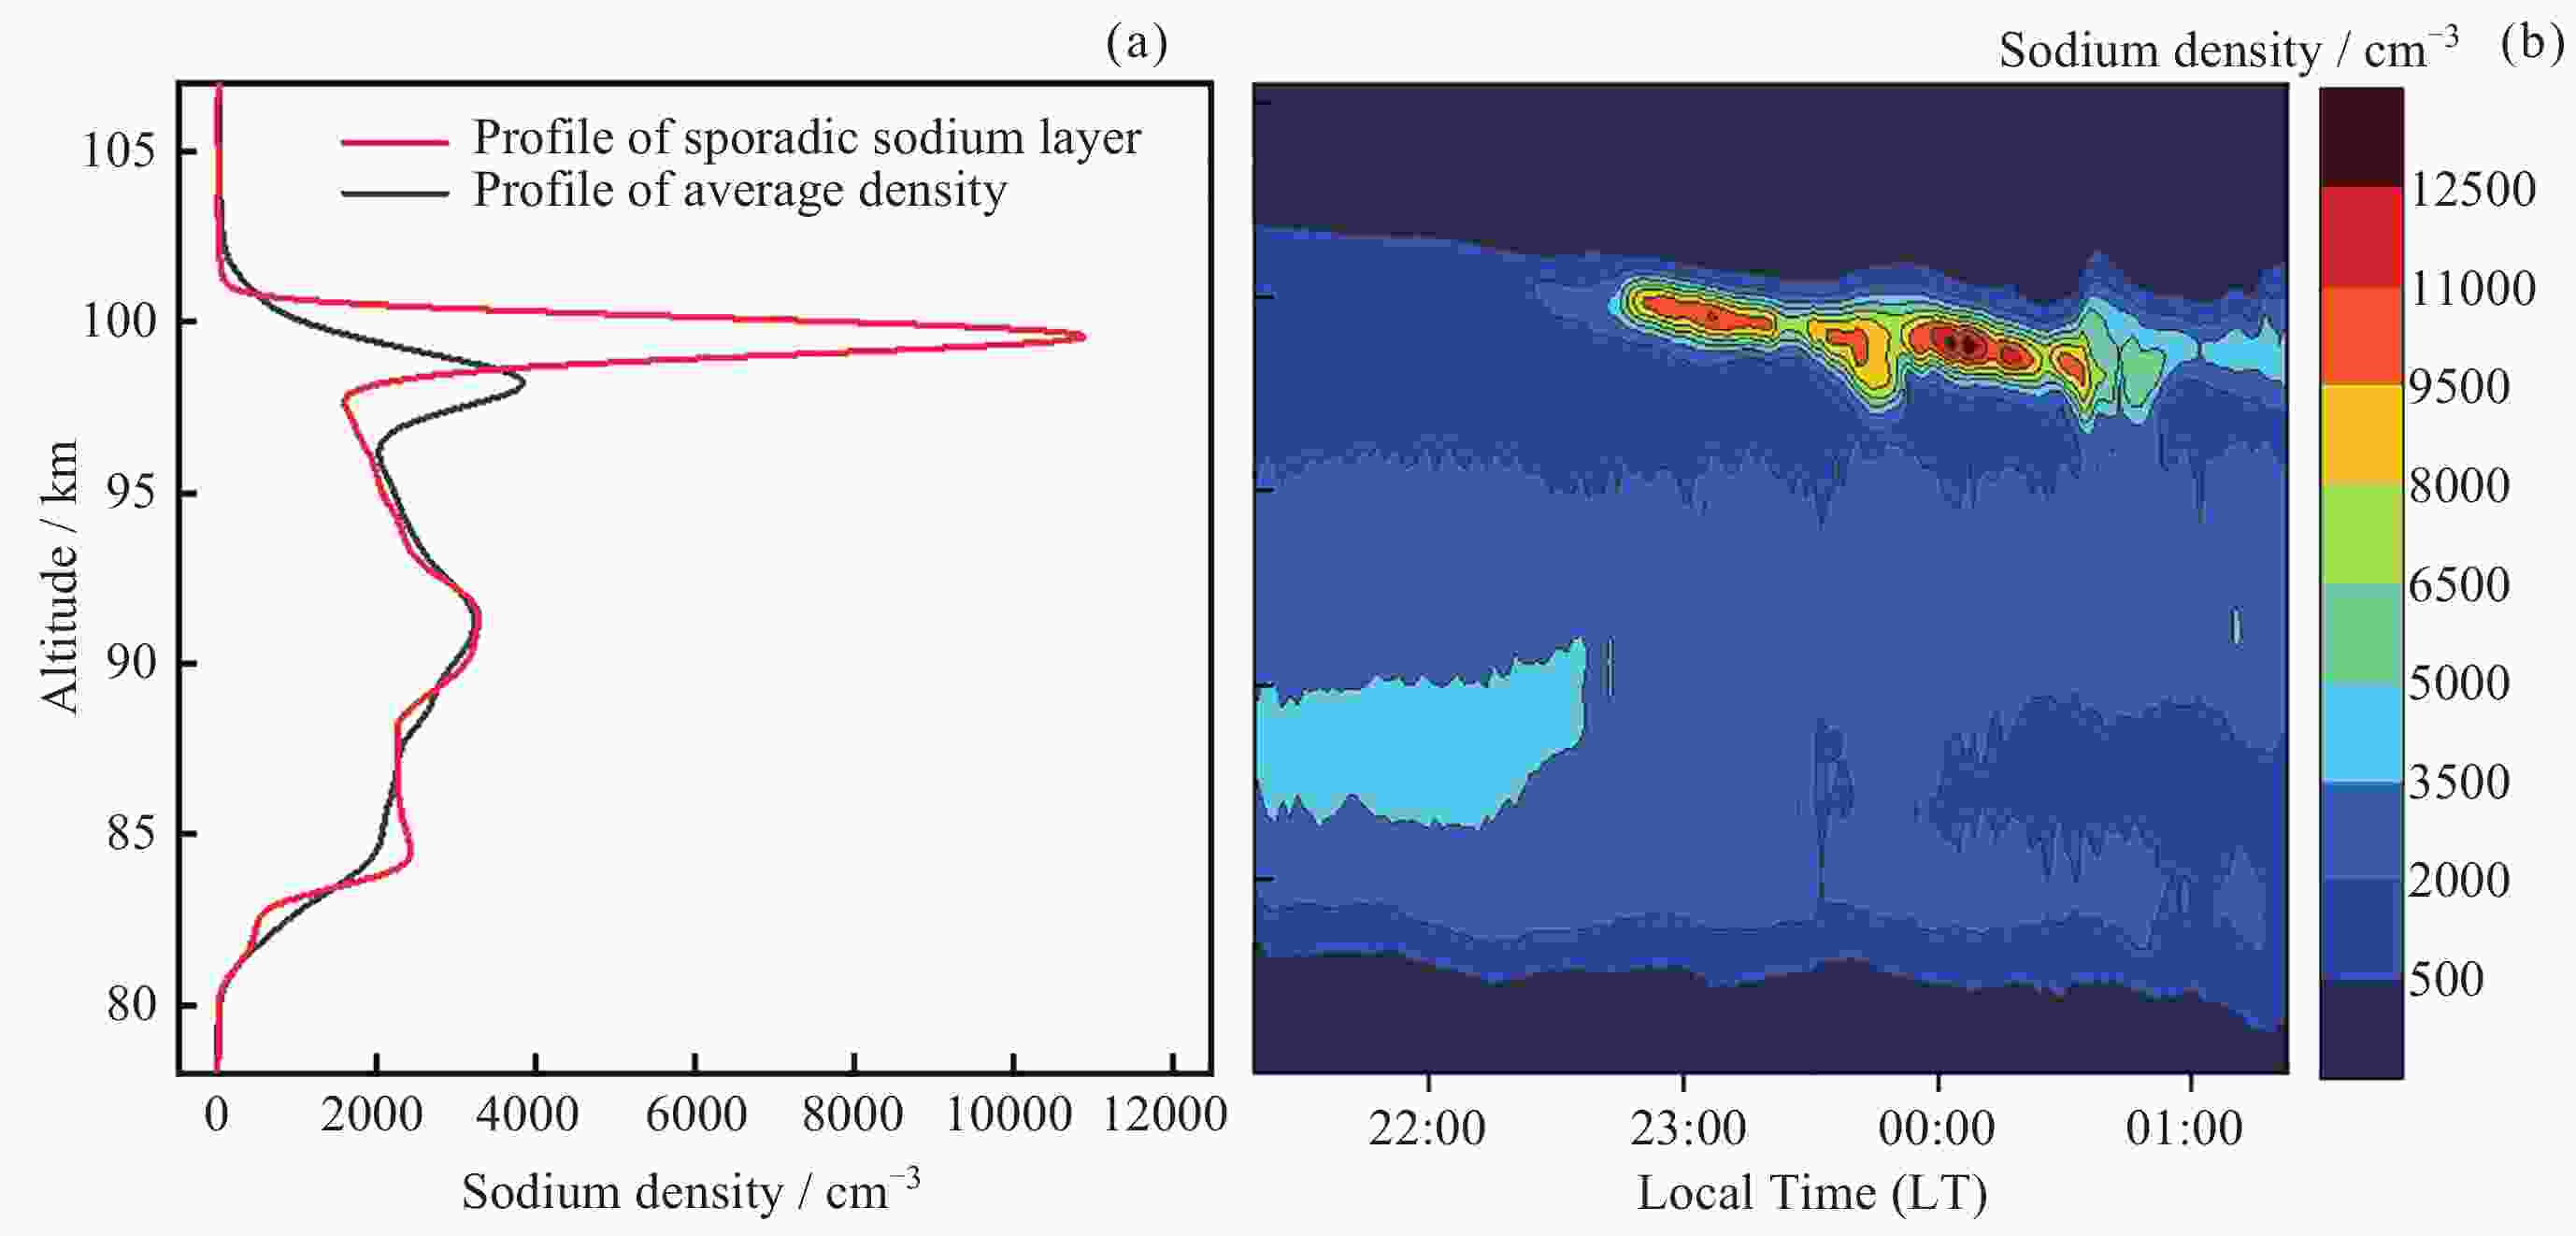
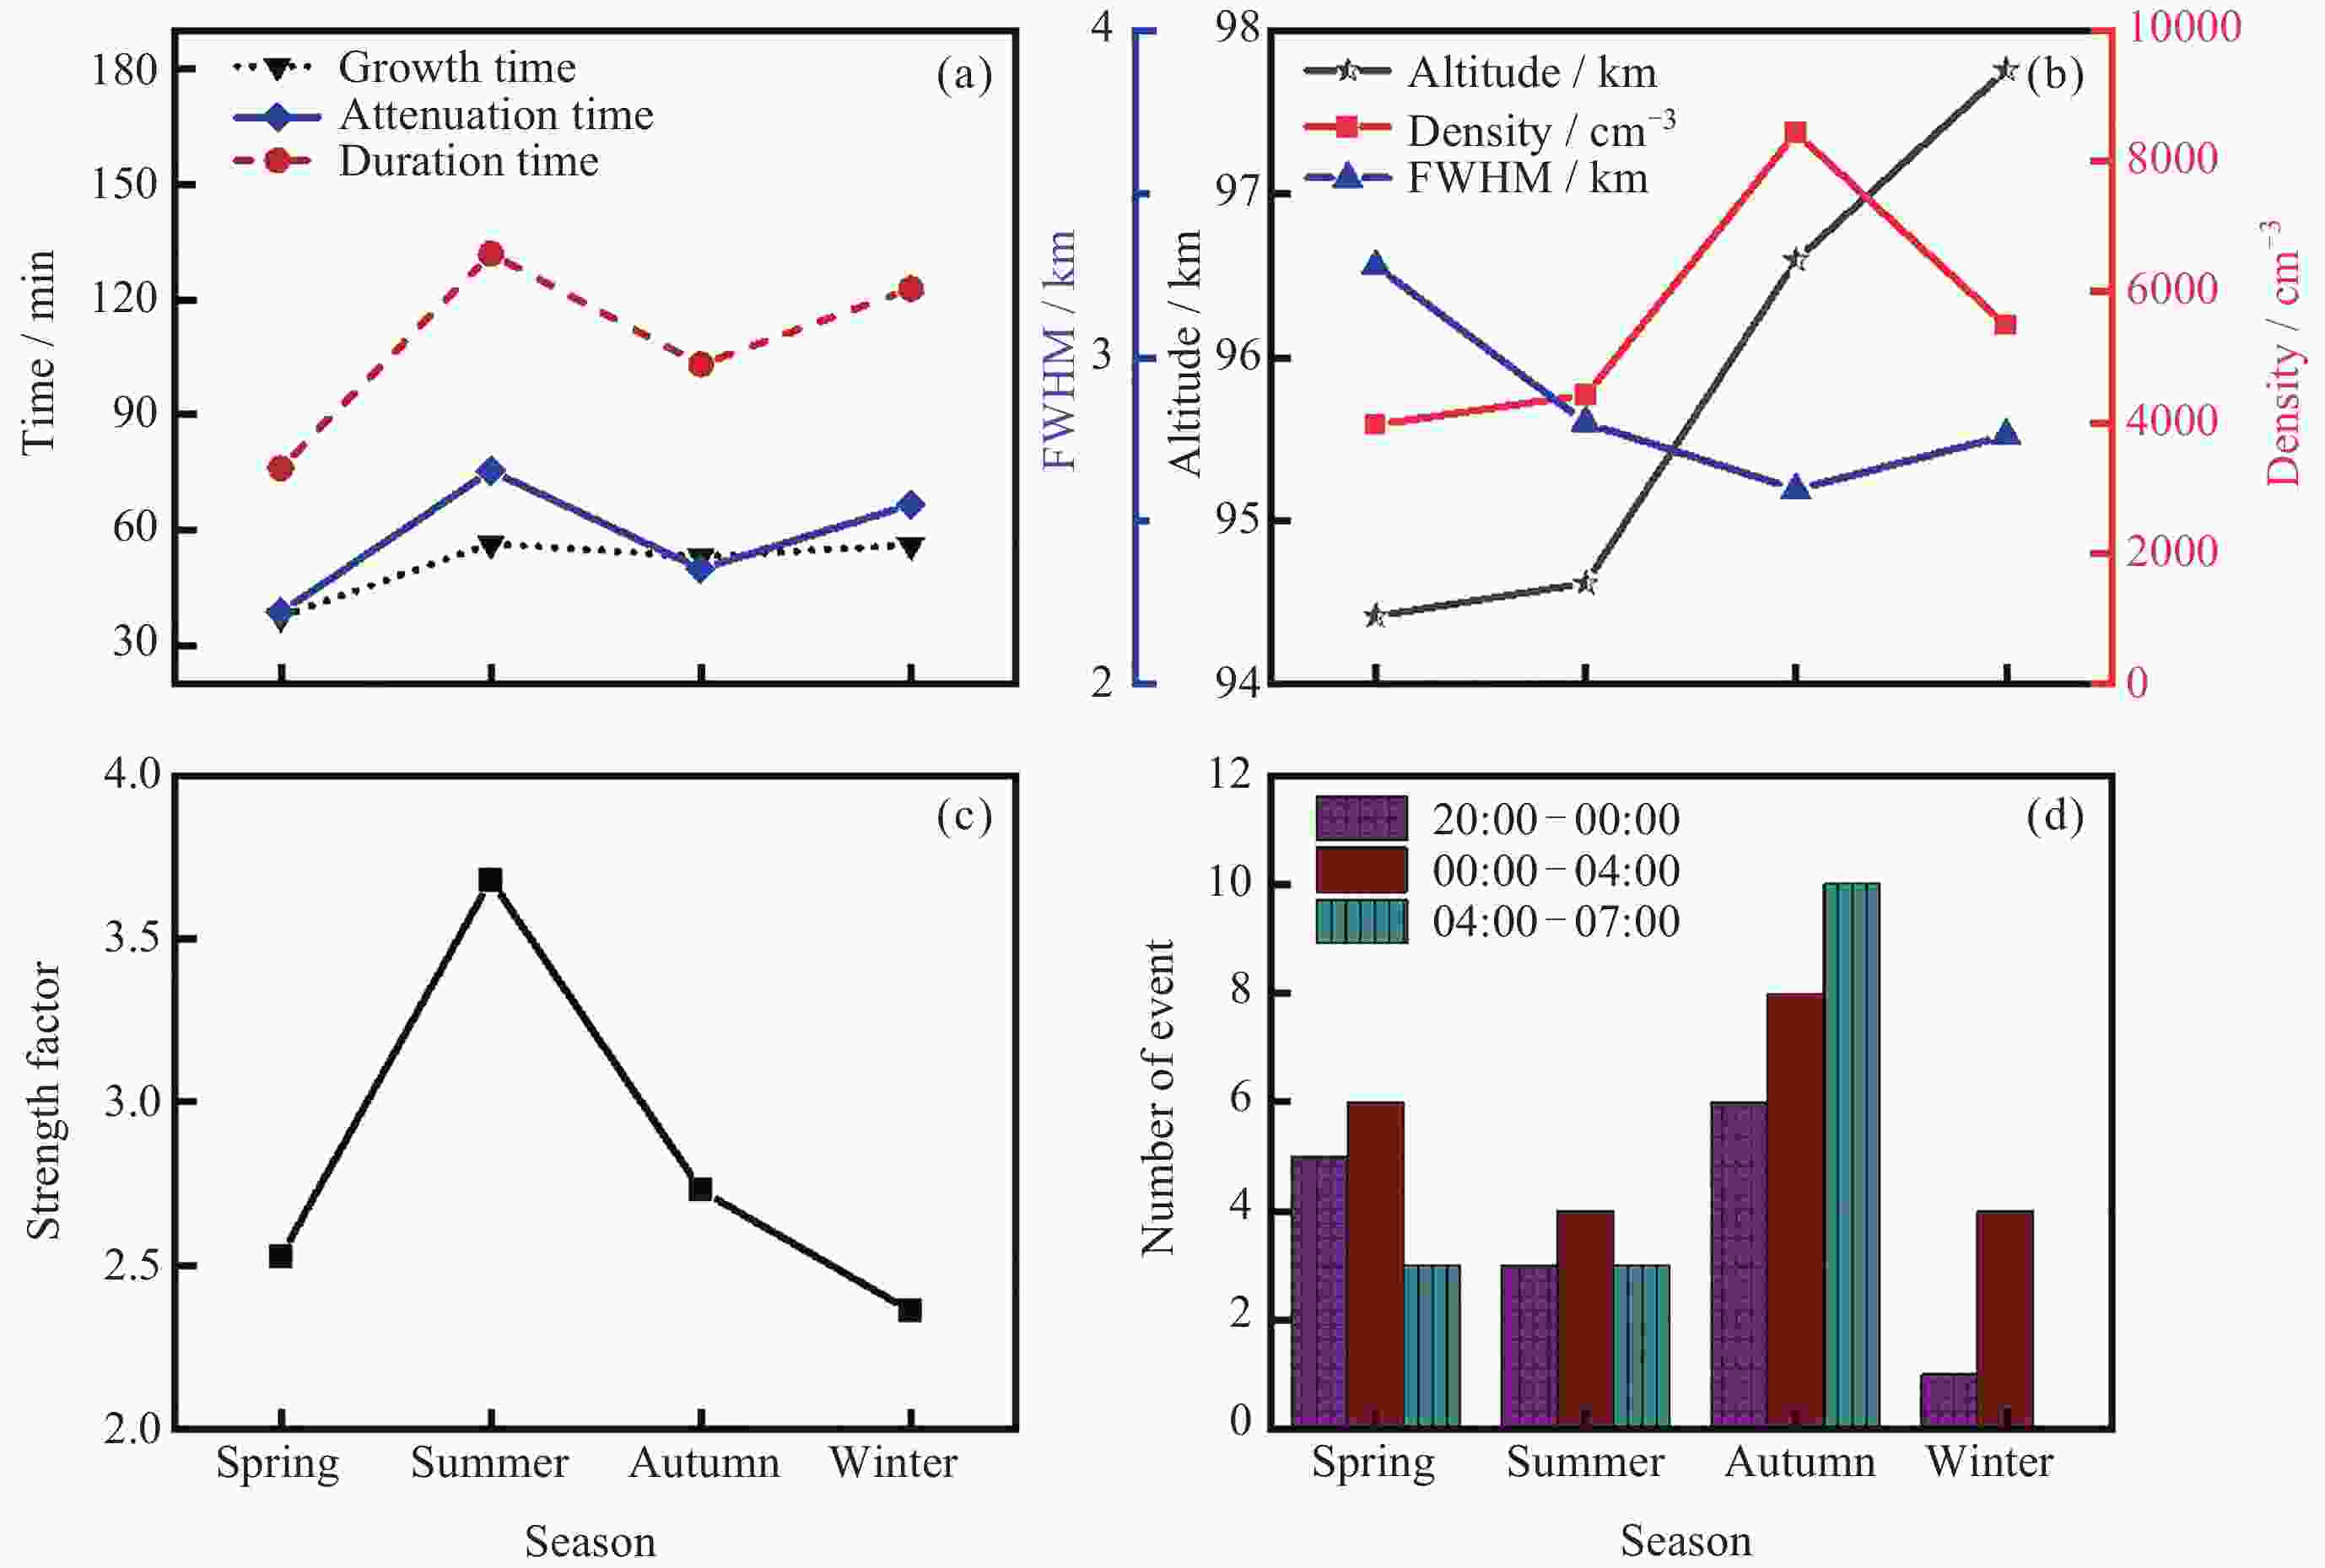
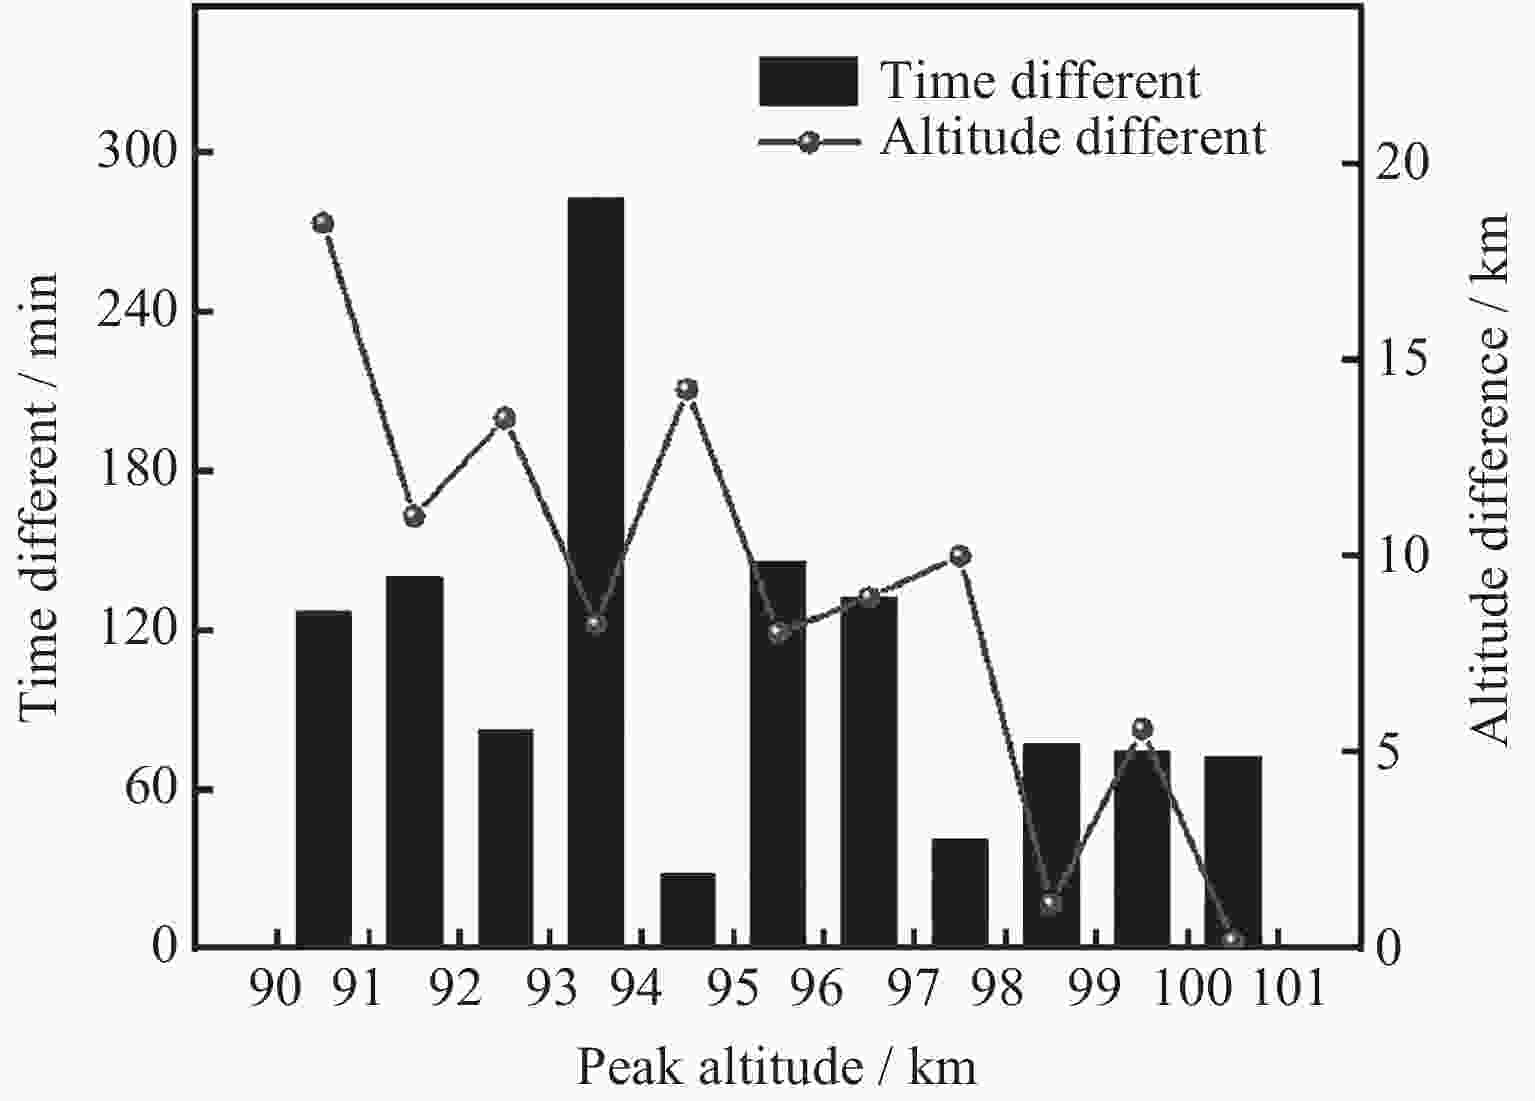
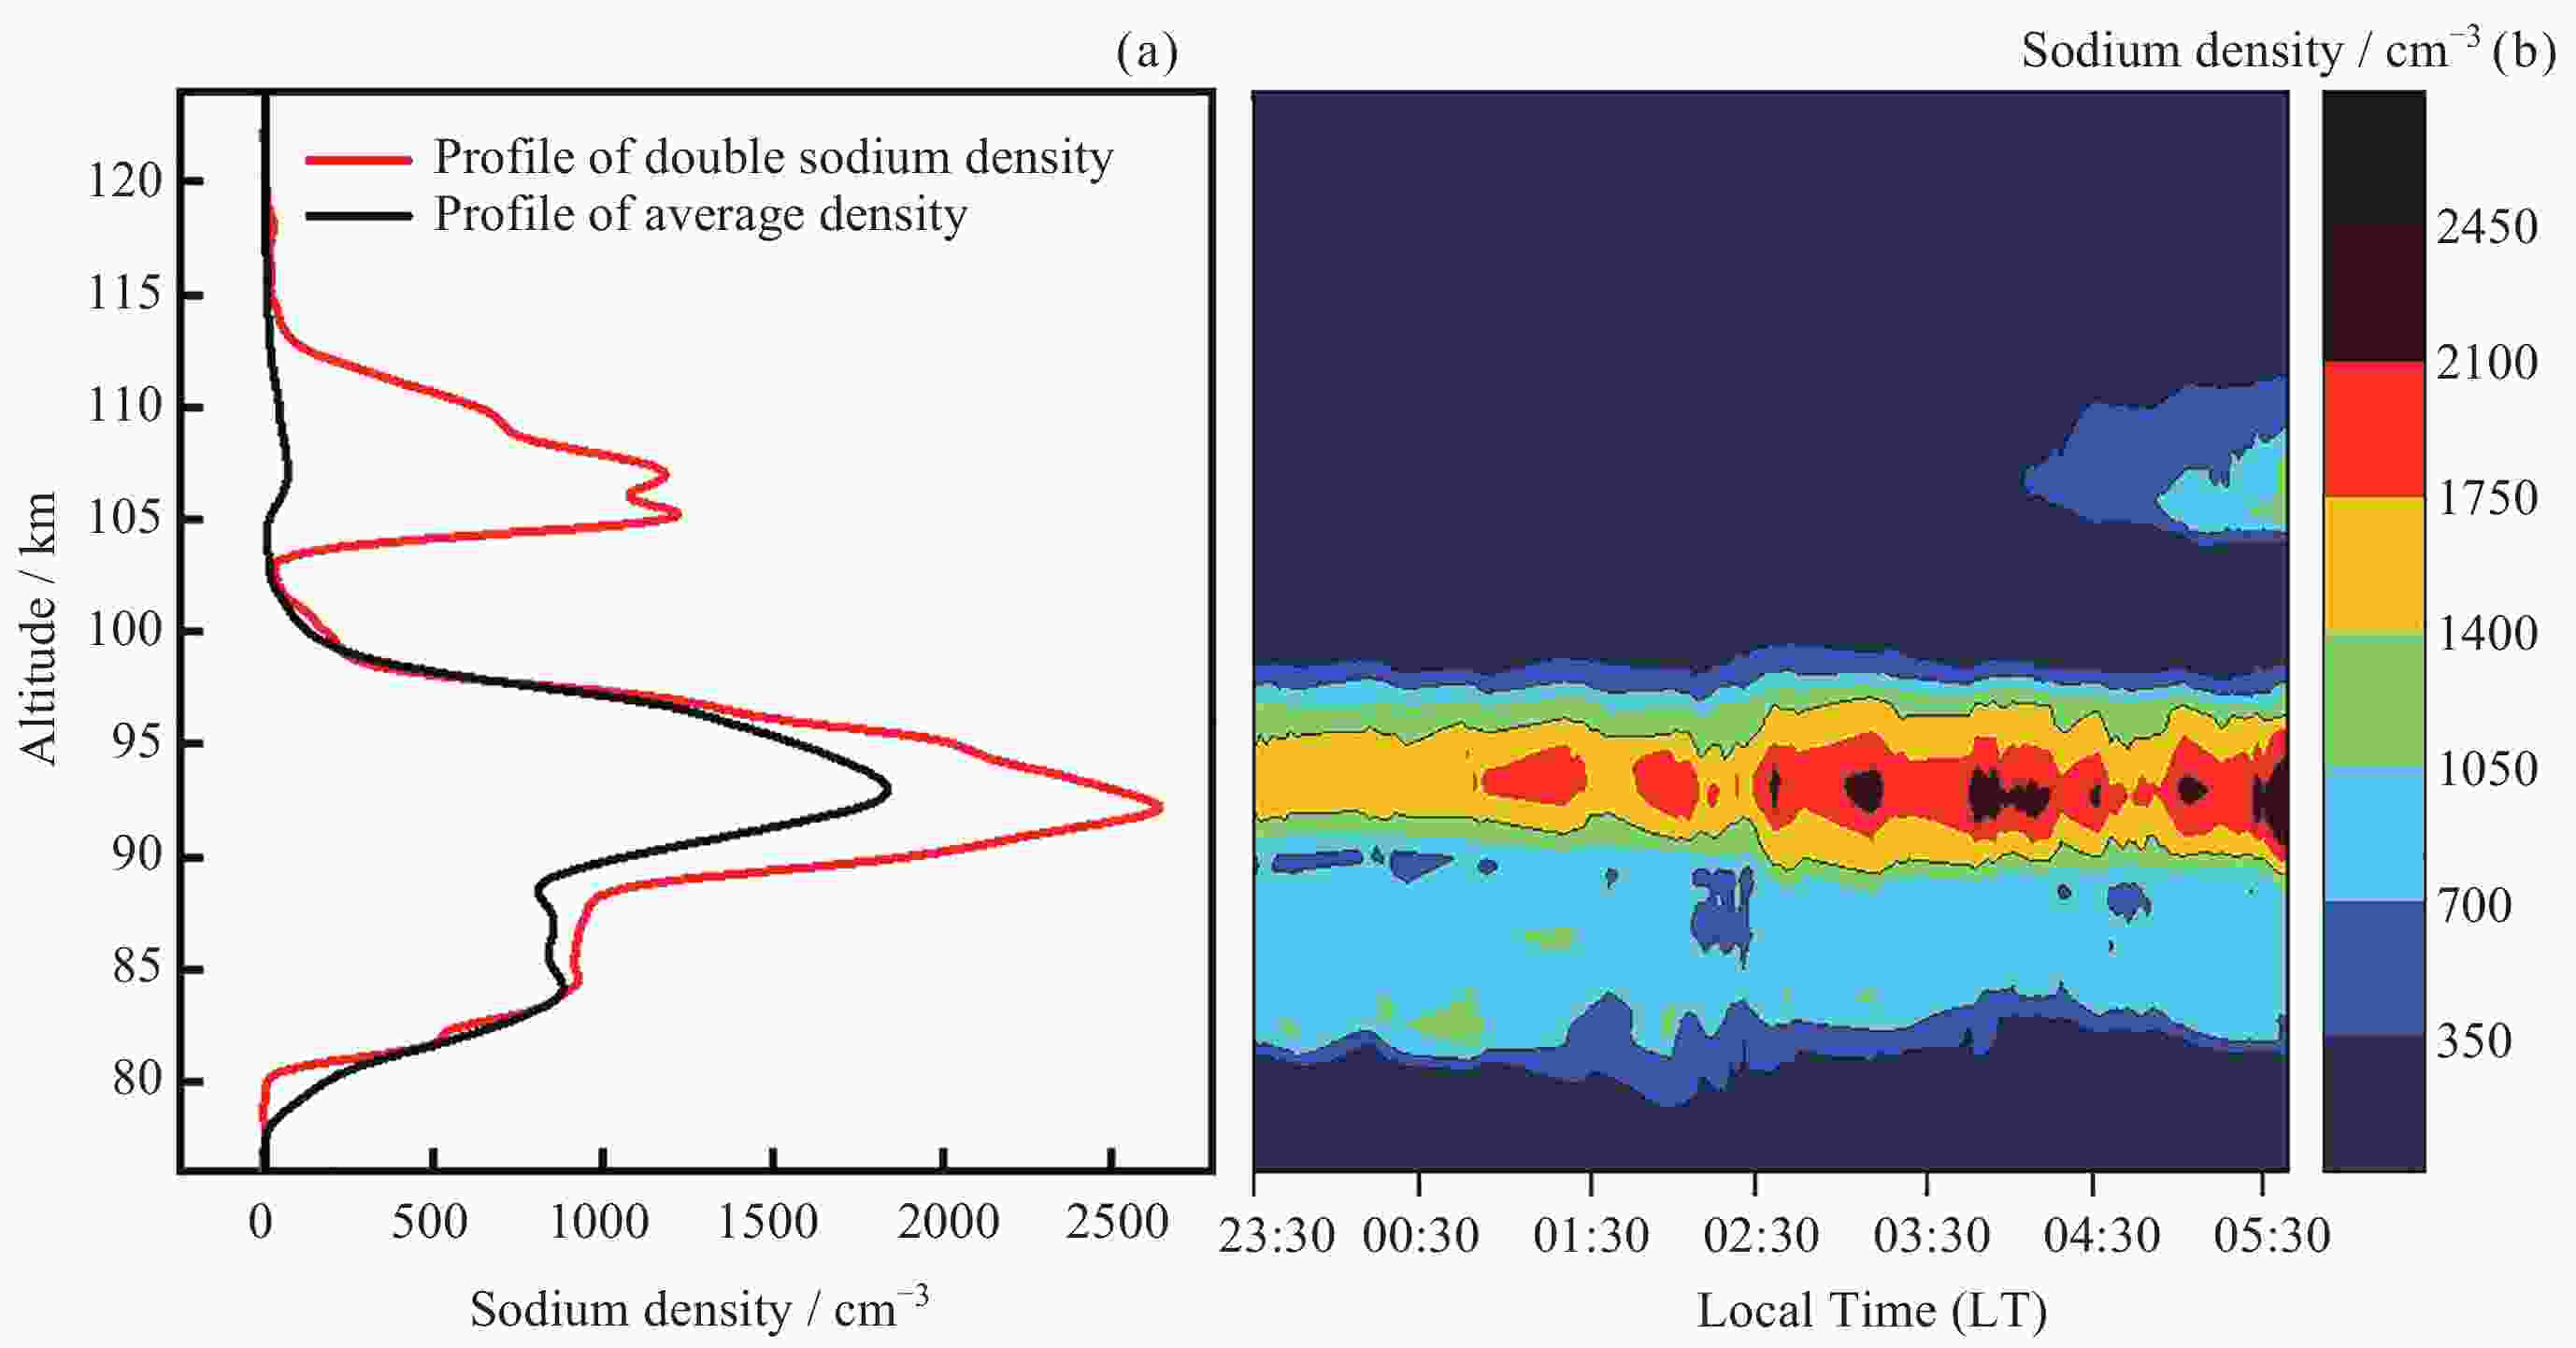
摘要: 使用钠荧光激光雷达观测2018-2019年低纬度地区海口(20.0°N, 110.3°E)上空钠层变化规律, 统计分析了钠层密度分布与其季节变化特征以及特殊事件的季节变化特征, 发现海口钠层变化与季节之间有较大关联. 钠层平均密度呈现基本对称的高斯分布特点, 柱密度和峰值秋冬季大, 峰值位置夏高秋低, 质心高度变化稳定, 半高全宽与均方根宽度秋季小冬季大. 突发钠层事件 (Sporadic Sodium Layer, SSL)随季节变化明显, 持续时间夏长春短, 峰值秋季大、春季小, 秋冬季峰值位置较高, 夏季突发强度最大, 除秋季外其他季节突发峰值多在后半夜. 结合海南儋州(19.5°N, 109.1°E)测高仪数据, 结果显示海口地区发生在97 km以上的SSL与突发E层(Es)有较大相关性. 低纬度地区冬季发生SSL的概率较高, 双钠层(Double Sodium Layer, DSL)多出现在春、夏季.Abstract: Sodium lidar observations of sodium layer from 2018 to 2019 at a low-latitude location (Haikou, China, 20°N, 110.3°E) are reported in this paper. The purpose is to reveal characteristics of seasonal variations of the sodium layer, including density distribution characteristics, seasonal variation characteristics and special events of sodium layer. According to statistical analysis, there is a great correlation between the variation of sodium layer and seasons. Average density of sodium layer presents a basically symmetrical Gaussian distribution, with good morphological symmetry in autumn. Column density and peak value are small in spring and summer and vice versa in autumn and winter. Peak position is high in summer and low in autumn. There is no clear seasonal variation about the centroid height of the sodium layer. Full Width at Half Maximum (FWHM) and Root Mean Square (RMS) width of sodium layer are both small in autumn and large in winter. Sporadic Sodium Layers (SSLs) change obviously with seasons and the growth, decline and duration time are short in summer and long in spring. Peak value has the minimum in spring and maximum in autumn, respectively. Peak position tends to be higher during autumn and winter but lower during spring and summer. The intensity is the largest in summer. Except autumn, peak value of other seasons is mostly in the latter half of the night. With respect to the correlation with sporadic E, combining with the ionosphere data obtained by the nearest ionosonde at Danzhou, China ($ 19.5°\mathrm{N}, 109.1°\mathrm{E} $), there is a considerable correlation between sporadic E layers (Es) and SSLs above 97 km at low latitude, which is embodied in the time, height and intensity. By statistical analysis of special events, it is found that the probability of SSLs in winter is high and the Double Sodium Layer (DSL) mostly appears in spring and summer at Haikou.
-
表 1 海口地区钠荧光激光雷达参数
Table 1. Main parameters of Na fluorescence lidars at Haikou
组成部分 参数 激光发射单元 双波长/nm 532 / 589 脉冲能量/mJ 42 频率/Hz 50 发散角/mrad 1 接收单元 望远镜直径/mm 1000 视场角/mrad 2 滤光片带宽/nm 1 数据采集与控制单元 空间分辨率/m 96 时间分辨率/s 20 表 2 钠层突发事件的观测统计
Table 2. Statistical chart of SSL observation in different seasons
季节 总钠层
观测天数SSL观测天数 SSL产生概率/(%) SSL件数 SSL观测
过程完整件数春 70 9 12.86 16 14 夏 39 9 23.08 14 10 秋 88 18 20.45 33 22 冬 34 9 26.47 10 4 总计 231 45 19.91 73 50 表 3 2018-2019年海口观测SSL和海南儋州观测Es的主要参数
Table 3. Main parameters of SSL at Haikou ($ 20.0°\mathbf{N}, 110.3°\mathbf{E} $) and Es events observed at Danzhou ($ 19.5°\mathbf{N}, 109.1°\mathbf{E} $) in 2018-2019
序号 日期 SSL Es 时间差/min 峰值时刻(LT) 峰值高度/km 强度因子 最低高度/km F0Es/MHz 1 12 Jan. 2018 22:52 96.67 3.6 110 4.28 –37 2 21 Mar. 2018 21:53 92.83 2 106.3 3.55 –23 3 1 May. 2018 03:00 99.17 2.2 110 4.85 –60 4 06 May. 2018 04:41 97.63 3.4 115.8 5.35 –26 5 31 May. 2018 21:28 94.56 4.3 108.8 4.83 –28 6 3 Dec. 2018 01:24 104.4 2 102.5 4.28 –9 7 27 Apr. 2019 22:01 92.64 3.5 110 4.83 –121 8 27 Apr. 2019 22:15 93.22 2 110 5.38 –105 9 27 Apr. 2019 00:02 90.91 2.3 112.5 4.97 –152 10 27 Apr. 2019 00:31 90.62 2.3 107.5 5.45 –106 11 27 Apr. 2019 01:19 90.53 2 107.5 4.67 –124 12 19 May. 2019 23:54 97.25 2 105 5.78 –34 13 19 May. 2019 00:58 97.06 2.2 102.5 7.2 –63 14 23 May. 2019 04:51 93.02 2.3 100 5.2 –456 15 9 Jun. 2019 01:47 93.98 2.7 95 3.45 –287 16 27 Jul. 2019 03:12 92.83 2 102.5 3.8 –102 17 28 Jul. 2019 20:56 96 13 105 7.15 –206 18 28 Jul. 2019 21:20 96 2.3 102.5 6 –170 19 7 Aug. 2019 04:17 95.62 3 102.5 5.75 –167 20 30 Sept. 2019 19:34 102 2.4 103.3 15.43 –44 21 30 Sept. 2019 20:54 101.4 2.1 101.3 14.1 –99 22 30 Sept. 2019 21:52 101.1 2.1 102.5 8.6 –137 23 3 Oct. 2019 23:04 99.65 3 100 5.67 –88 24 3 Oct. 2019 00:07 98.88 2.8 100 6.83 –77 25 4 Oct. 2020 05:30 91.49 2.8 102.5 4.53 –140 26 5 Oct. 2019 00:44 96.38 2 107.5 4.83 –79 27 17 Nov. 2019 00:09 96.58 3.2 102.5 6.6 –114 28 12 Dec. 2019 02:20 95.81 2 105 3.77 –125 注 时间差为SSL达到最大峰值密度与Es突发最小高度的时间差, “–”表示Es突发达到最小高度早于SSL达到最大峰值密度. 表 4 SSL与Es随季节变化的对比
Table 4. Comparison between SSL and Es with seasonal variation
季节 SSL Es 高度差/km 时间差/min 峰值高度/km 强度因子 最低高度/km F0Es/MHz 春 97.78 2.45 108.32 5.8 10.54 –52.33 夏 - - - - - - 秋 100.61 2.48 101.42 10.13 0.81 –82.5 冬 104.4 2 102.5 4.28 1.9 –9 表 5 2018-2019年海口DSL事件主要参数
Table 5. Characteristics of double sodium layer over Haikou from 2018 to 2019
日期 开始时间(LT) 峰值高度/km 峰值密度/cm–3 FWHM
/km持续时间/min RCD/(%) RPD/(%) 9 Mar. 2018 21:46 104.5 881 1.6 523 8.42 18.27 24 May 2018 03:53 105.5 1273 5.6 137 29.51 48.22 6 Jun. 2019 23:26 108.7 196 3.6 222 4.88 9.10 -
[1] SHE C Y, YU J R, LATIFI H, et al. High-spectral-resolution fluorescence light detection and ranging for mesospheric sodium temperature measurements[J]. Applied Optics, 1992, 31(12): 2095-2106 doi: 10.1364/AO.31.002095 [2] BOWMAN M R, GIBSON A J, SANDFORD M C W. Atmospheric sodium measured by a tuned laser radar[J]. Nature, 1969, 221(5179): 456-457 doi: 10.1038/221456a0 [3] YUE X C, ZHOU Q H, YI F, et al. Simultaneous and common-volume lidar observations of K/Na layers and temperature at Arecibo Observatory (18°N, 67°W)[J]. Journal of Geophysical Research: Atmospheres, 2016, 121(13): 8038-8054 doi: 10.1002/2015JD024494 [4] WU F J, CHU X Z, DU L F, et al. First simultaneous lidar observations of thermosphere-ionosphere sporadic Ni and Na (TISNi and TISNa) layers (∼105-120 km) over Beijing (40.42°N, 116.02°E)[J]. Geophysical Research Letters, 2022, 49(16): e2022GL100397 doi: 10.1029/2022GL100397 [5] ANDRIOLI V F, XU J Y, BATISTA P P, et al. C-structures in mesospheric Na and K layers and their relations with dynamical and convective instabilities[J]. Atmosphere, 2022, 13(11): 1867 doi: 10.3390/atmos13111867 [6] CLEMESHA B R, KIRCHHOFF V W J H, SIMONICH D M, et al. Evidence of an extra-terrestrial source for the mesospheric sodium layer[J]. Geophysical Research Letters, 1978, 5(10): 873-876 doi: 10.1029/GL005i010p00873 [7] FONTES P A, MUELLA M T A H, RESENDE L C A, et al. Evidence of anti-correlation between sporadic (Es) layers occurrence and solar activity observed at low latitudes over the Brazilian sector[J]. Advances in Space Research, 2024, 73(7): 3563-3577 doi: 10.1016/j.asr.2023.09.040 [8] FONTES P A, DE ASSIS HONORATO MUELLA M T, RESENDE L C A, et al. Effects of the terdiurnal tide on the Sporadic E (Es) layer development at low latitudes over the Brazilian sector[J]. Annales Geophysicae, 2023, 41(1): 209-224 doi: 10.5194/angeo-41-209-2023 [9] GONG S S, YANG G T, WANG J M, et al. A double sodium layer event observed over Wuhan, China by lidar[J]. Geophysical Research Letters, 2003, 30(5): 1209 [10] CLEMESHA B R, SIMONICH D M, TAKAHASHI H, et al. The annual variation of the height of the atmospheric sodium layer at 23°S: Possible evidence for convective transport[J]. Journal of Geophysical Research: Atmospheres, 1992, 97(D5): 5981-5985 doi: 10.1029/91JD03146 [11] KWON K H, GARDNER C S, SENFT D C, et al. Daytime lidar measurements of tidal winds in the mesospheric sodium layer at Urbana, Illinois[J]. Journal of Geophysical Research: Space Physics, 1987, 92(A8): 8781-8786 doi: 10.1029/JA092iA08p08781 [12] FAN Z Y, PLANE J M C, GUMBEL J, et al. Satellite measurements of the global mesospheric sodium layer[J]. Atmospheric Chemistry and Physics, 2007, 7(15): 4107-4115 doi: 10.5194/acp-7-4107-2007 [13] SIMONICH D M, CLEMESHA B R, KIRCHHOFF V W J H. The mesospheric sodium layer at 23°S: nocturnal and seasonal variations[J]. Journal of Geophysical Research: Space Physics, 1978, 84(A4): 1543-1550 [14] VISHNU PRASANTH P, SIVAKUMAR V, SRIDHARAN S, et al. Lidar observations of sodium layer over low latitude, Gadanki (13.5°N, 79.2°E): Seasonal and nocturnal variations[J]. Annales Geophysicae, 2009, 27(10): 3811-3823 doi: 10.5194/angeo-27-3811-2009 [15] GONG S H, YANG G T, XU J Y, et al. Nighttime and seasonal variations of the sodium layer measured by lidar at different latitudes in China[J]. Chinese Journal of Geophysics, 2013, 56(4): 361-372 doi: 10.1002/cjg2.20035 [16] SIMONICH D, CLEMESHA B. Sporadic sodium layers and the average vertical distribution of atmospheric sodium: Comparison of different NaS layer strengths[J]. Advances in Space Research, 2008, 42(1): 229-233 doi: 10.1016/j.asr.2008.03.027 [17] ANDRIOLI V F, XU J, BATISTA P P, et al. Simultaneous observation of sporadic potassium and sodium layers over São José dos Campos, Brazil (23.1°S, 45.9°W)[J]. Journal of Geophysical Research: Space Physics, 2021, 126(5): e2020JA028890 doi: 10.1029/2020JA028890 [18] FONTES P A, MUELLA M T A H, RESENDE L C A, et al. Effects of the Northern Hemisphere sudden stratospheric warmings on the Sporadic-E layers in the Brazilian sector[J]. Journal of Atmospheric and Solar-Terrestrial Physics, 2024, 256: 106199 doi: 10.1016/j.jastp.2024.106199 [19] QIU S C, TANG Y H, JIA M J, et al. A review of latitudinal characteristics of sporadic sodium layers, including new results from the Chinese Meridian Project[J]. Earth-Science Reviews, 2016, 162: 83-106 doi: 10.1016/j.earscirev.2016.07.004 [20] QIU S C, WANG N, SOON W, et al. The sporadic sodium layer: a possible tracer for the conjunction between the upper and lower atmospheres[J]. Atmospheric Chemistry and Physics, 2021, 21(15): 11927-11940 doi: 10.5194/acp-21-11927-2021 [21] TANG Q, ZHOU C, LIU H X, et al. Global structure and seasonal variations of the tidal amplitude in sporadic-E layer[J]. Journal of Geophysical Research: Space Physics, 2022, 127(10): e2022JA030711 doi: 10.1029/2022JA030711 [22] TANG Q, ZHAO J Q, YU Z B, et al. Occurrence and variations of middle and low latitude sporadic E layer investigated with longitudinal and latitudinal chains of ionosondes[J]. Space Weather, 2021, 19(12): e2021SW002942 doi: 10.1029/2021SW002942 [23] XIA Y, NOZAWA S, JIAO J, et al. Statistical study on sporadic sodium layers (SSLs) based on diurnal sodium lidar observations at Beijing, China (40.5°N, 116°E)[J]. Journal of Atmospheric and Solar-Terrestrial Physics, 2021, 212: 105512 doi: 10.1016/j.jastp.2020.105512 [24] JIAO J, YANG G T, ZOU X, et al. Joint observations of sporadic sodium and sporadic E layers at middle and low latitudes in China[J]. Chinese Science Bulletin, 2014, 59(29/30): 3868-3876 [25] YANG D L, ZHANG T M, WANG J H, et al. Characteristics of double sodium layer over Haikou, China (20.0°N, 110.1°E)[J]. Solar-Terrestrial Physics, 2019, 5(2): 28-32 doi: 10.12737/stp-52201904 -
-


 何诗敏 女, 1998年3月出生于广东省茂名市, 现为海南师范大学物理与电子工程学院硕士研究生, 主要研究方向为激光雷达. E-mail:
 下载:
下载:
