


In-orbit Validation of SEM-II onboard FengYun-3E
doi: 10.11728/cjss2026.05.2025-0226 cstr: 32142.14.cjss.2025-0226
-
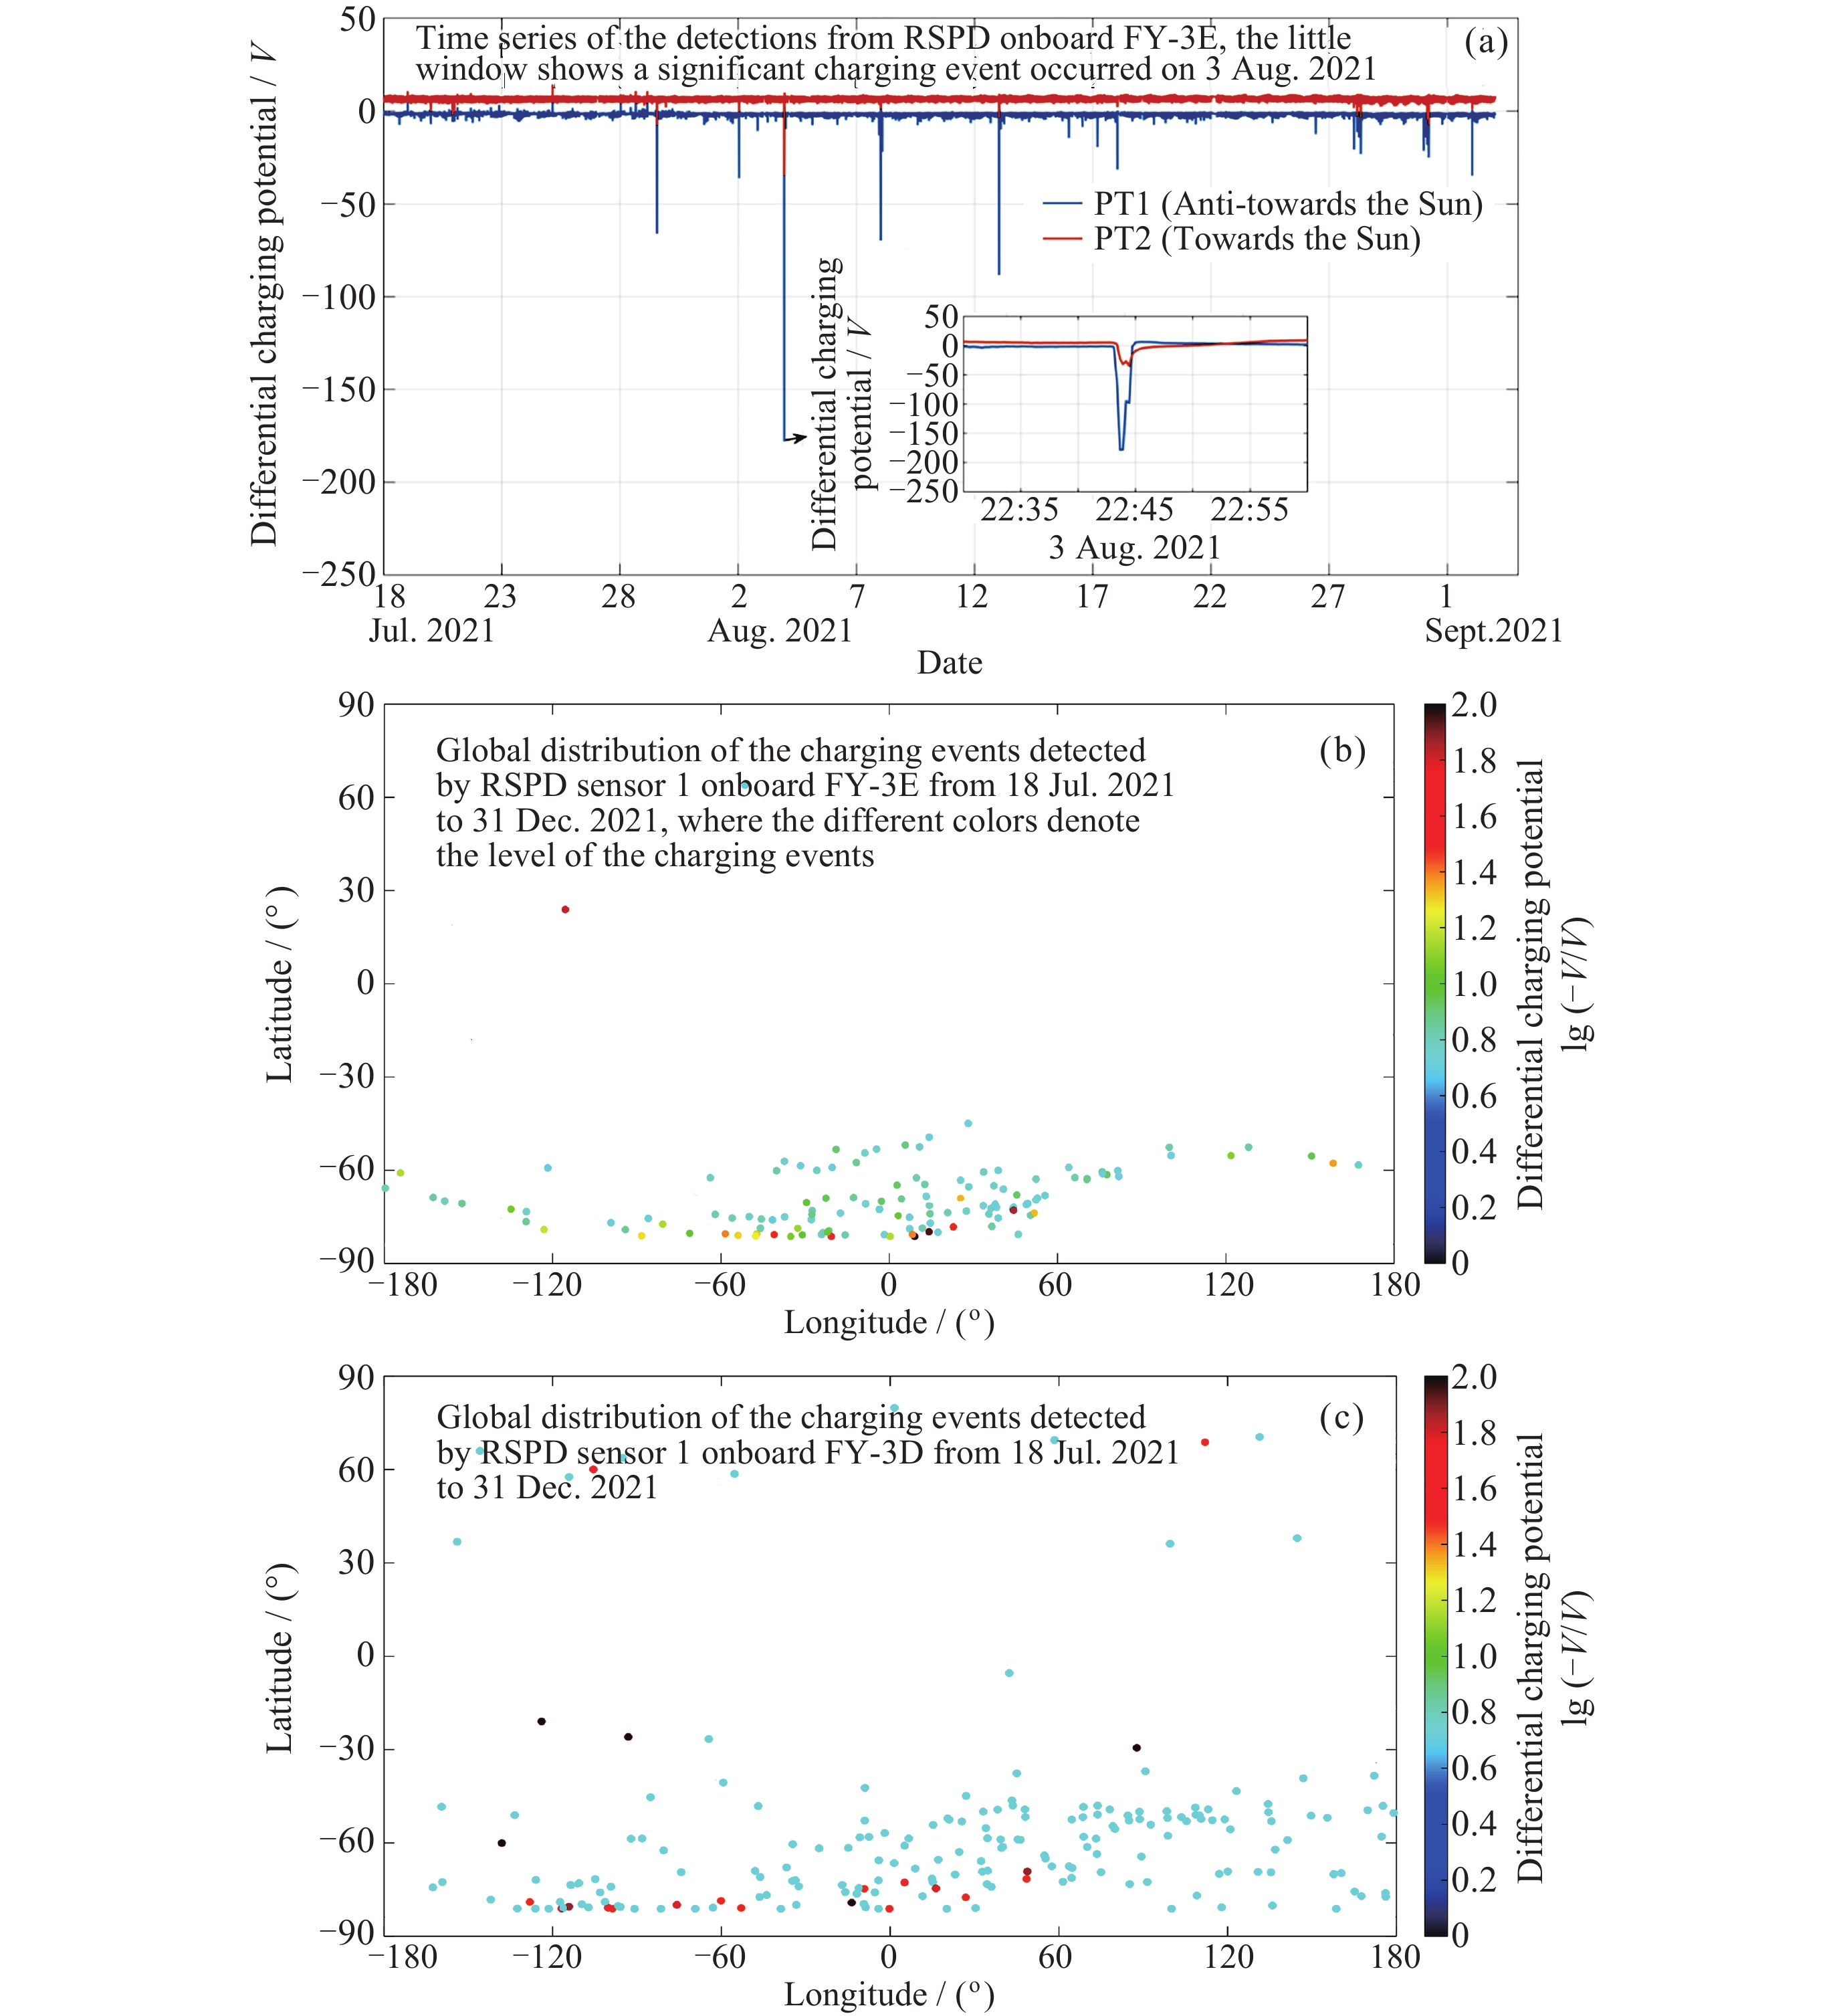
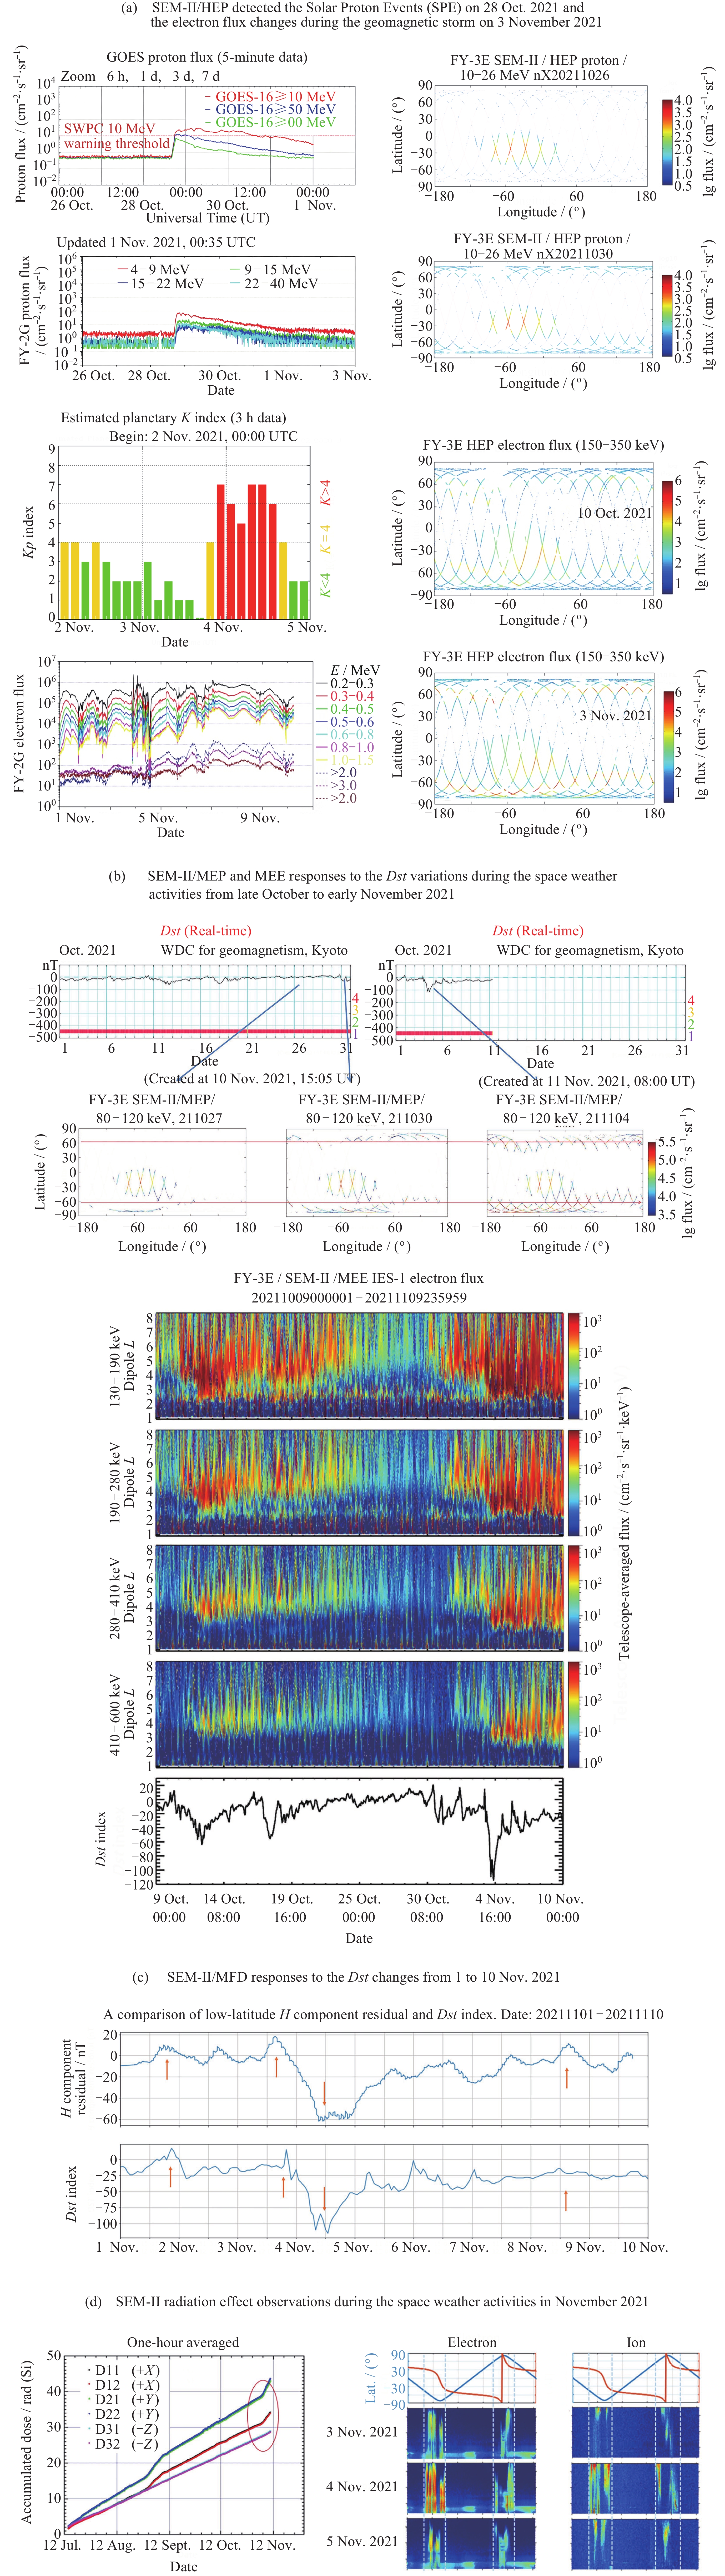
Abstract: The new generation of Space Environment Monitor (SEM), SEM-II, onboard the Chinese meteorological satellite, FengYun-3E, has the ability to measure the charged particle flux with particle energy from 30 eV to 300 MeV in multi-directions, the satellite surface potential, the radiation dose in sensors, and the geomagnetic field variations. The space environment detections derived from SEM-II can be utilized for satellite security designs, scientific studies, development of radiation belt models, and space weather event monitoring or disaster warning. In this paper, we introduce the SEM-II’s instrument characteristics, interpret the in-orbit calibration algorithm, perform the quantitative test to check the particle and the magnetic field detections’ biases by the cross-calibration methods, and do the qualitative tests to check whether the radiation dose and the surface potential detections follow the nature law of space environment by comparing with the historical records. The results show that the uncertainties of the particle detections are less than 20%, the uncertainties of the magnetic field detections are about 1%, the radiation dose and the surface potential detections coincide with the historical records and the space environment knowledge. The instruments’ responses to the space weather events are also presented.
-
Key words:
- FengYun-3E /
- Space environment /
- Radiation effects /
- Energetic particles /
- Space technology
-
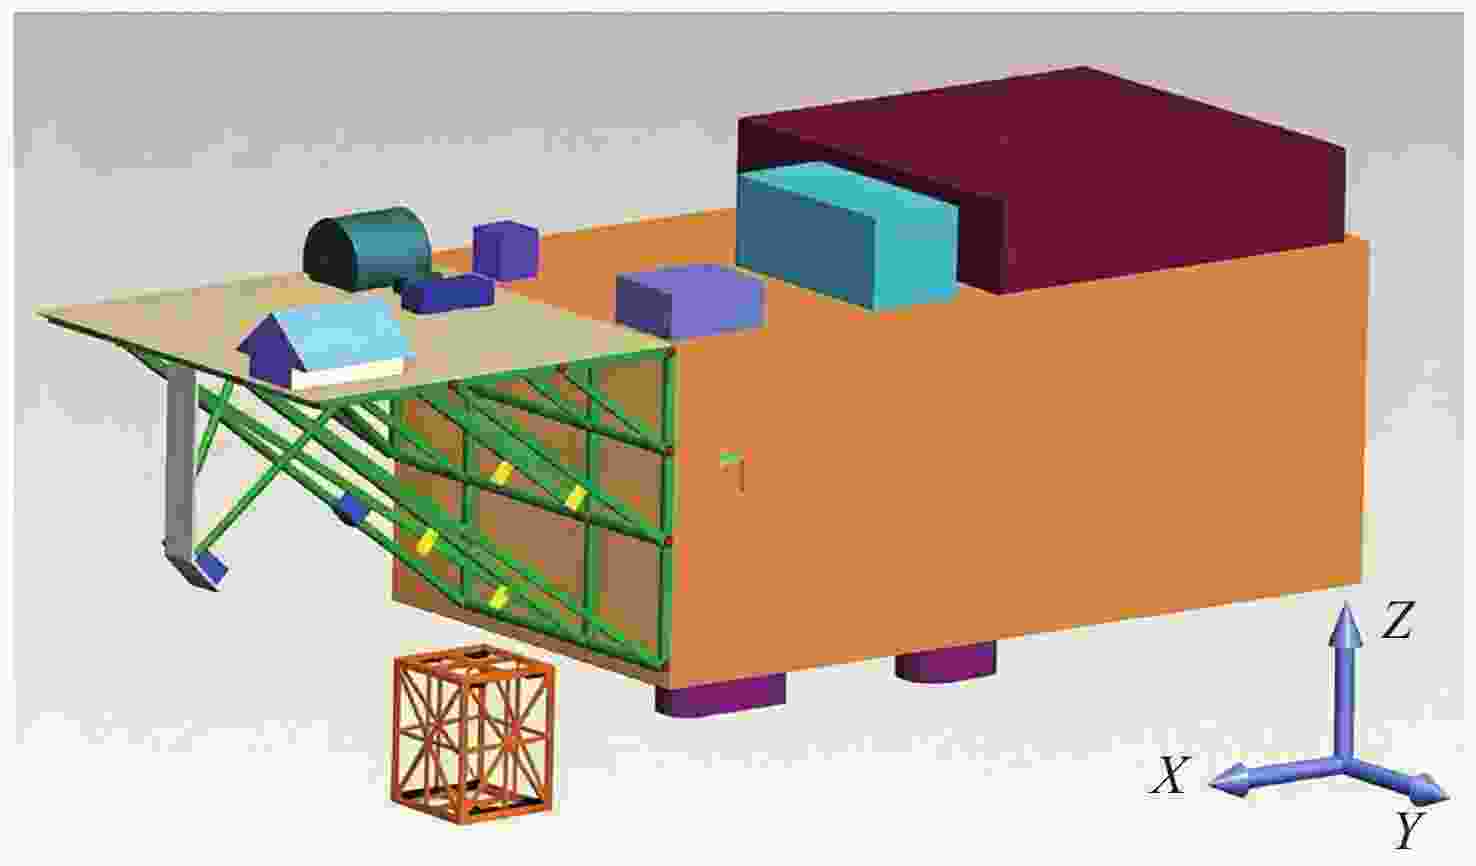
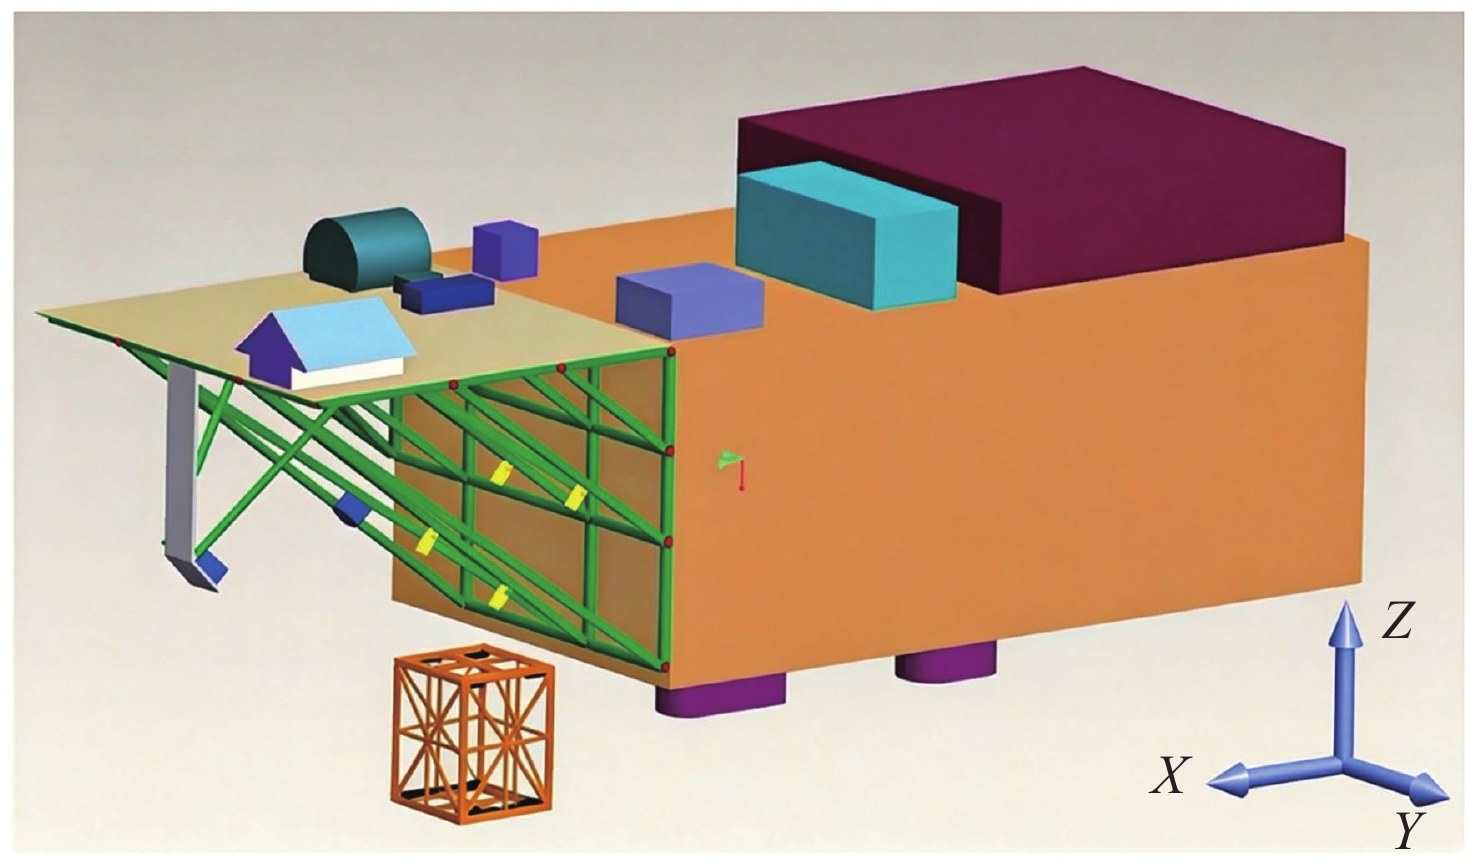
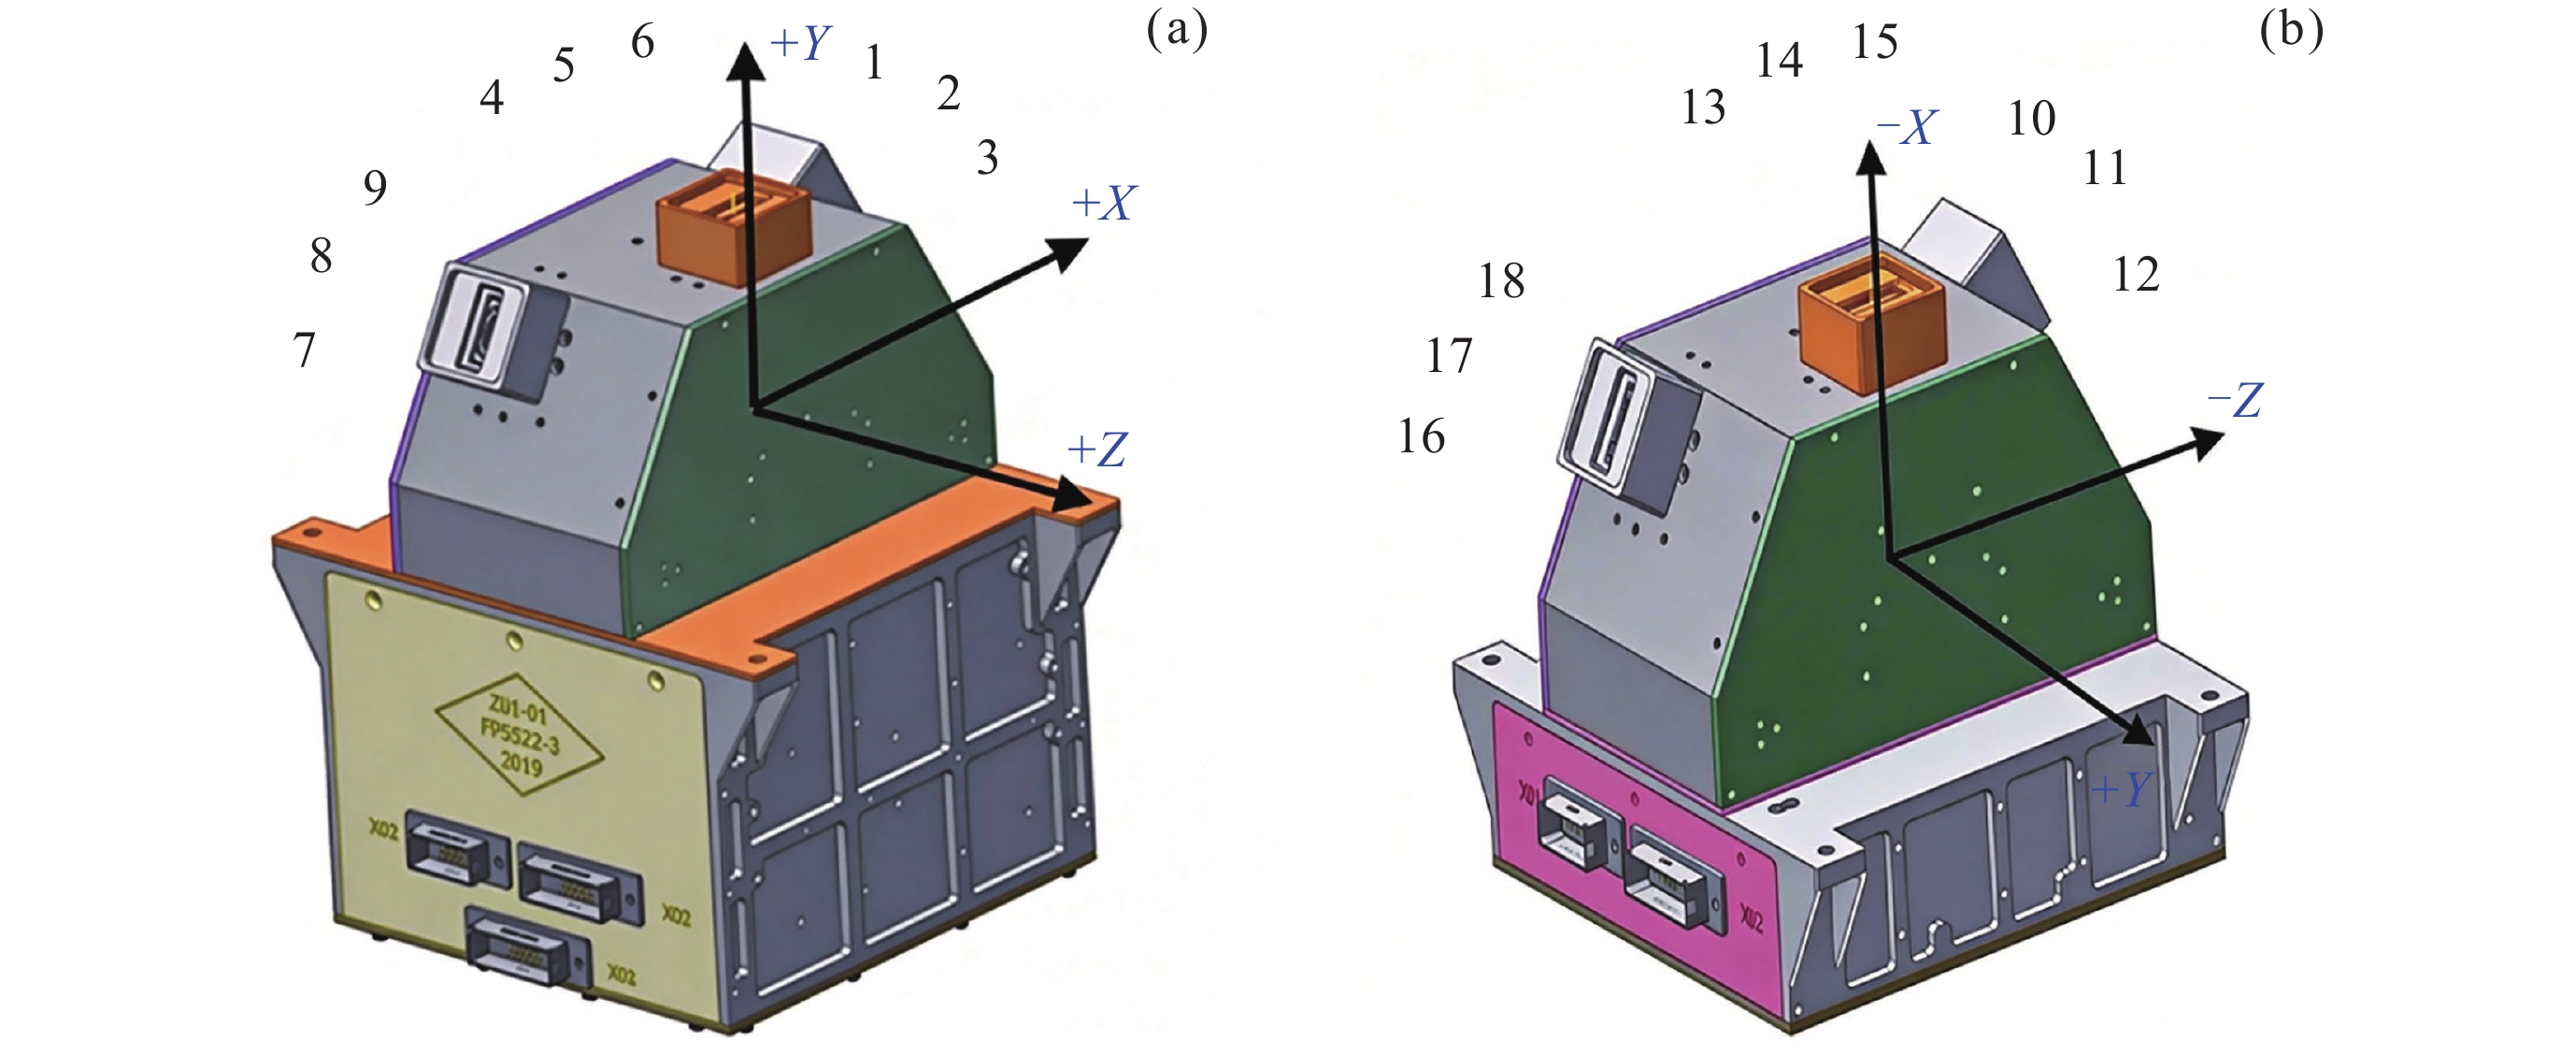
Figure 4. SEM-II MFD assembly map, the yellow (GMR, Giant Magneto Resistive) and blue blocks (FGM, Flux Gate Magnetometer) on the satellite truss (green) indicate where the six sensors are deployed
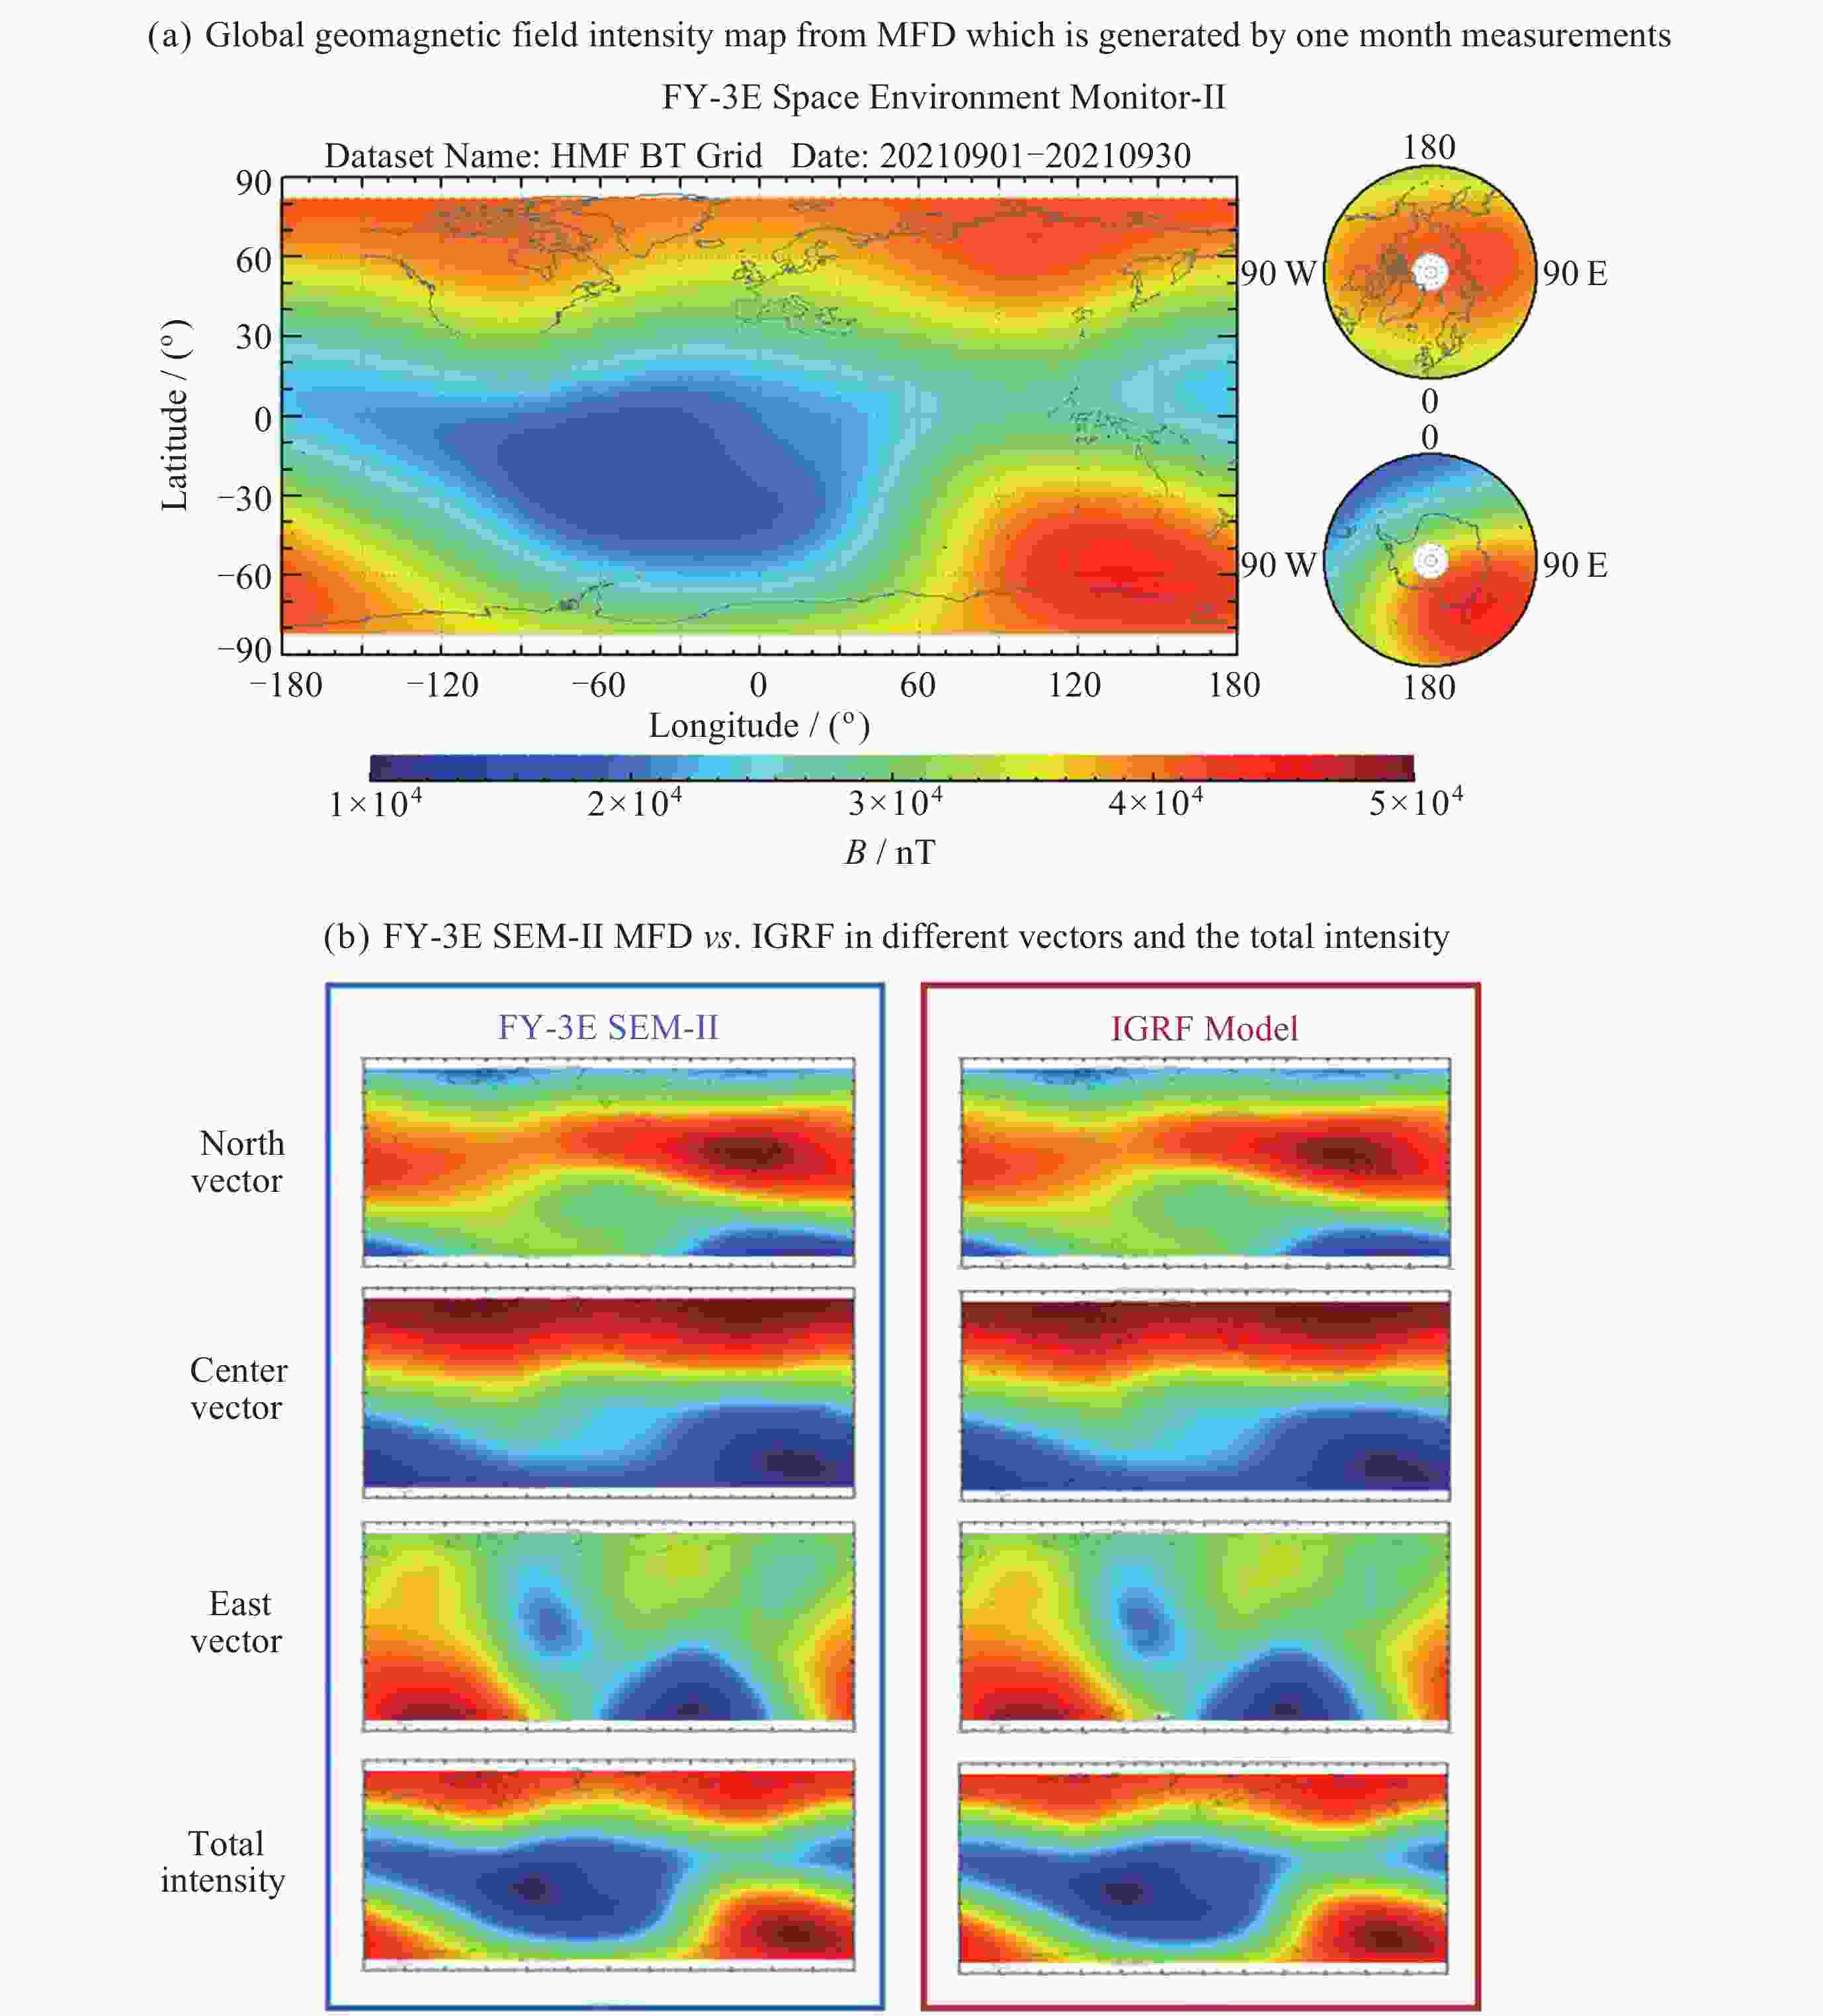
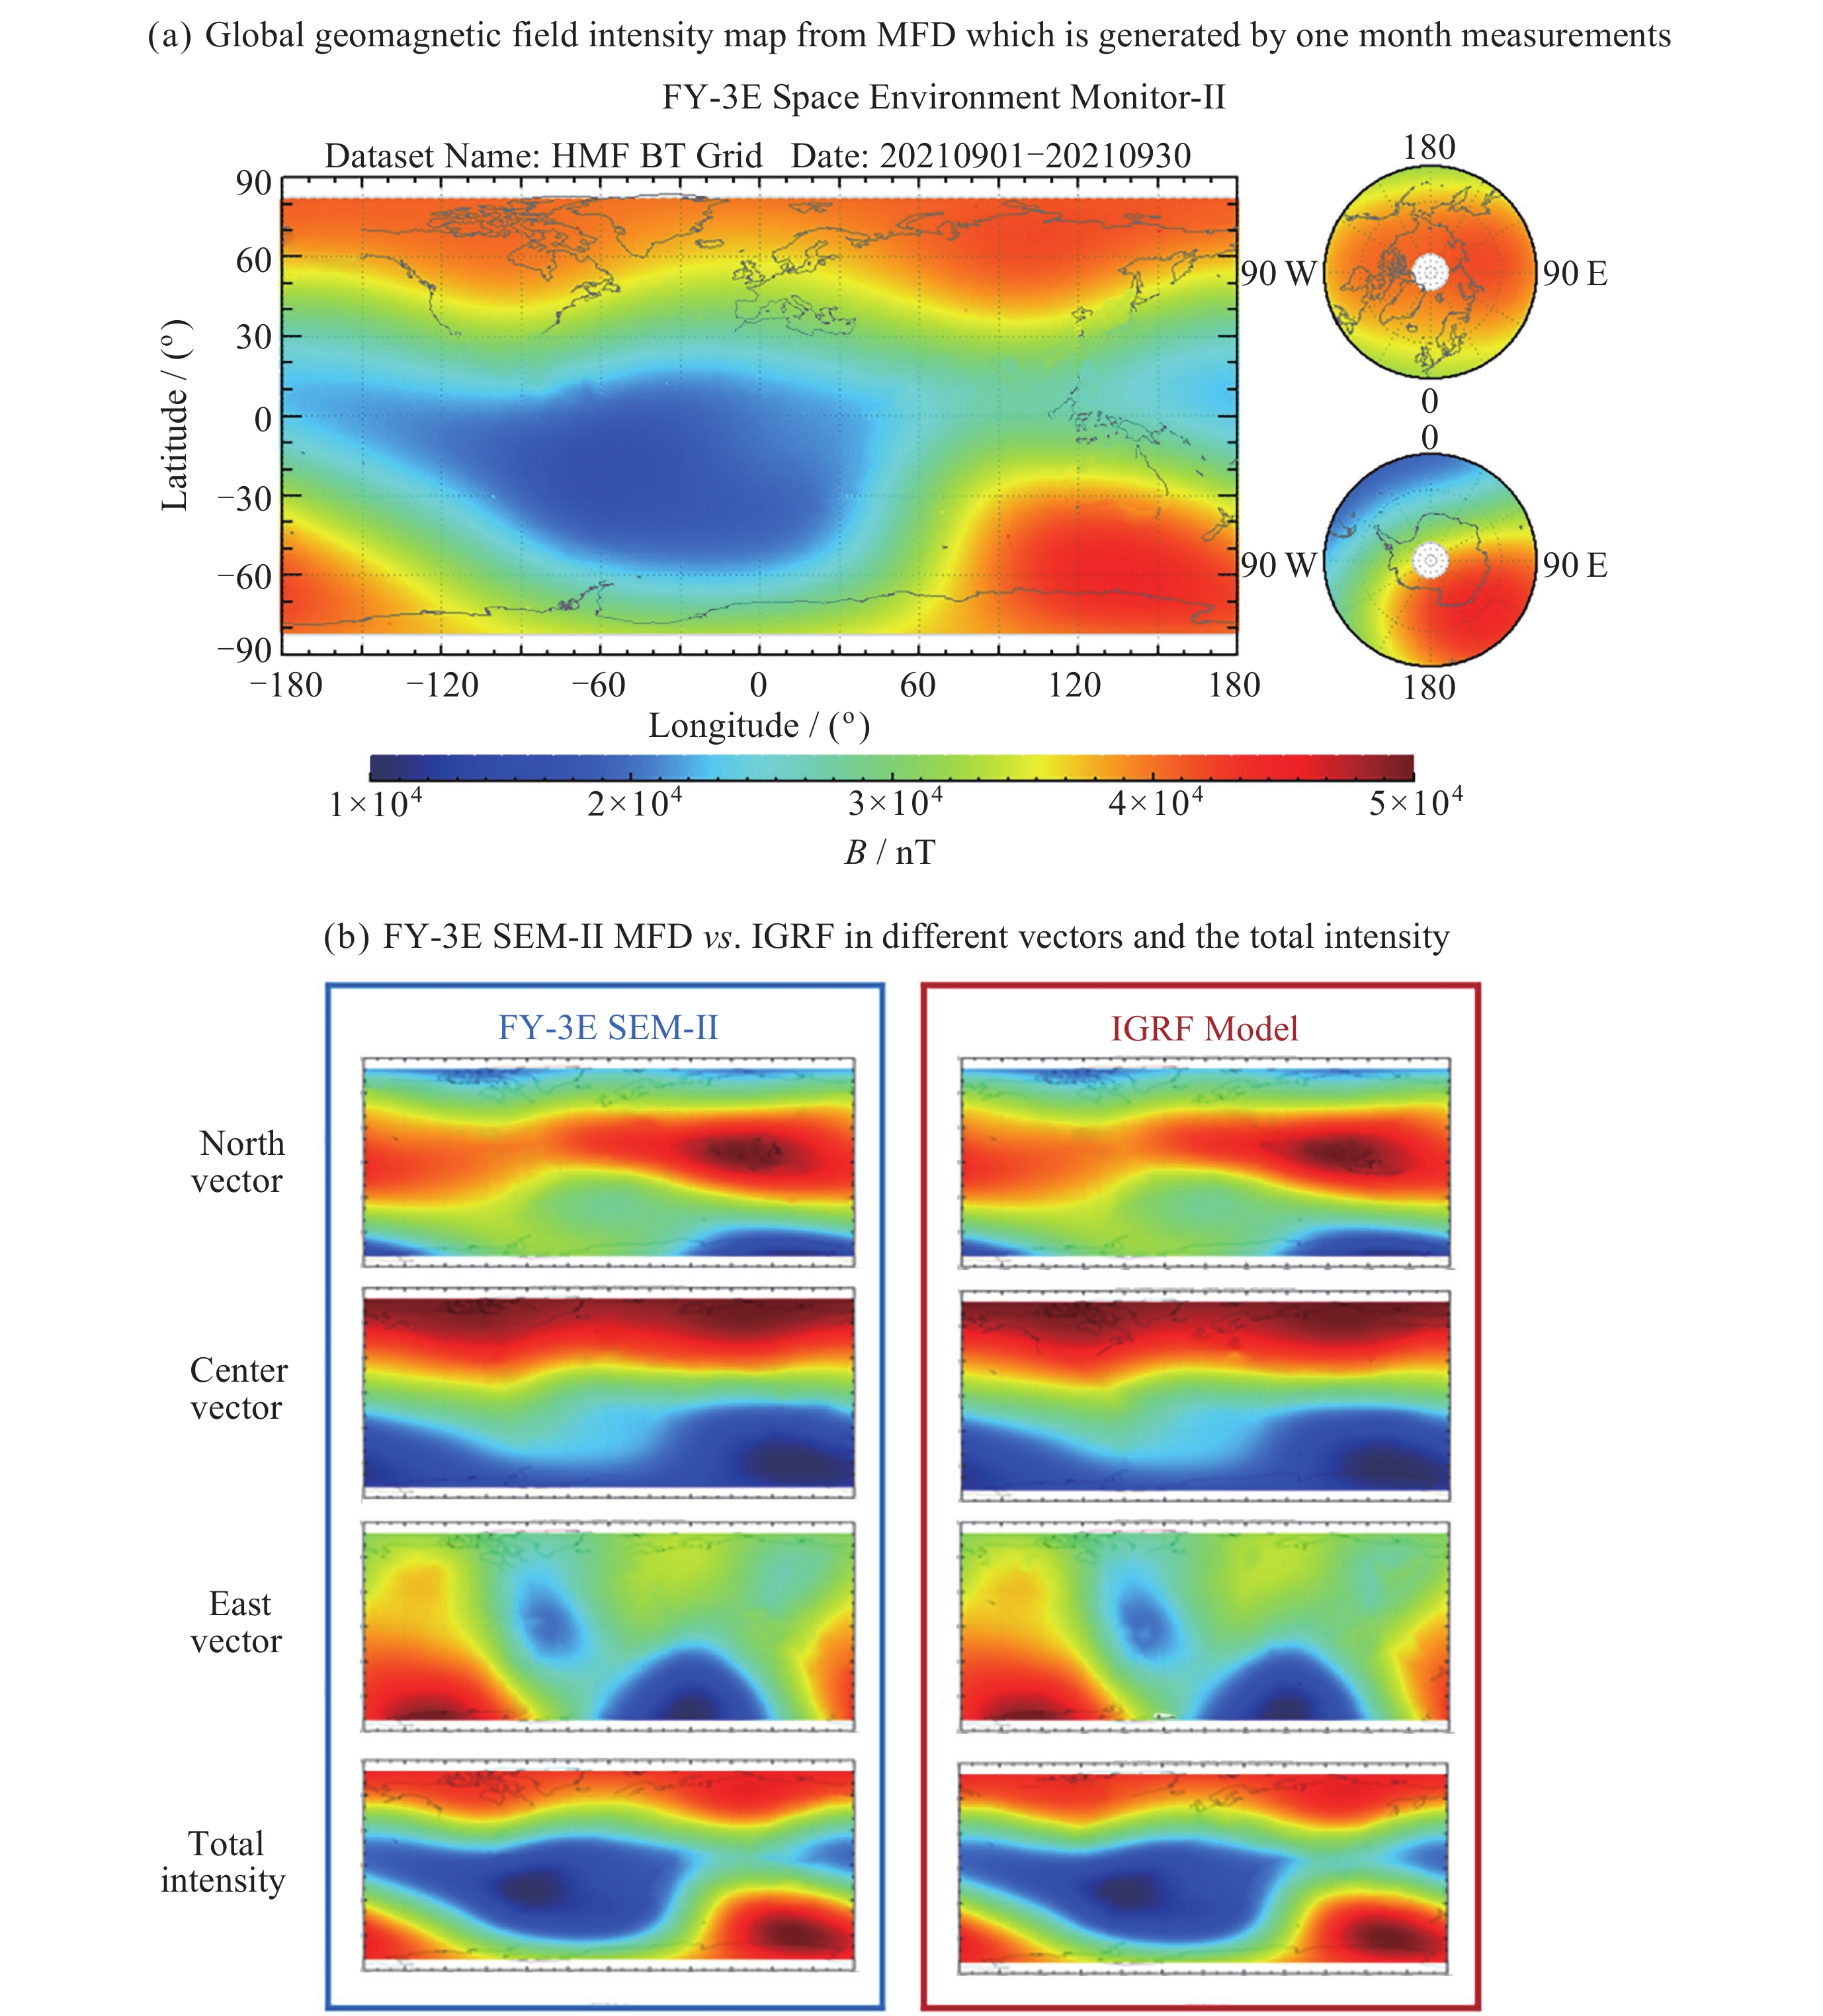
Figure 7. Geomagnetic field map from FY-3E_SEM-II_MFD compared with IGRF13. The way for these maps’ generation is like that in Fig. 5
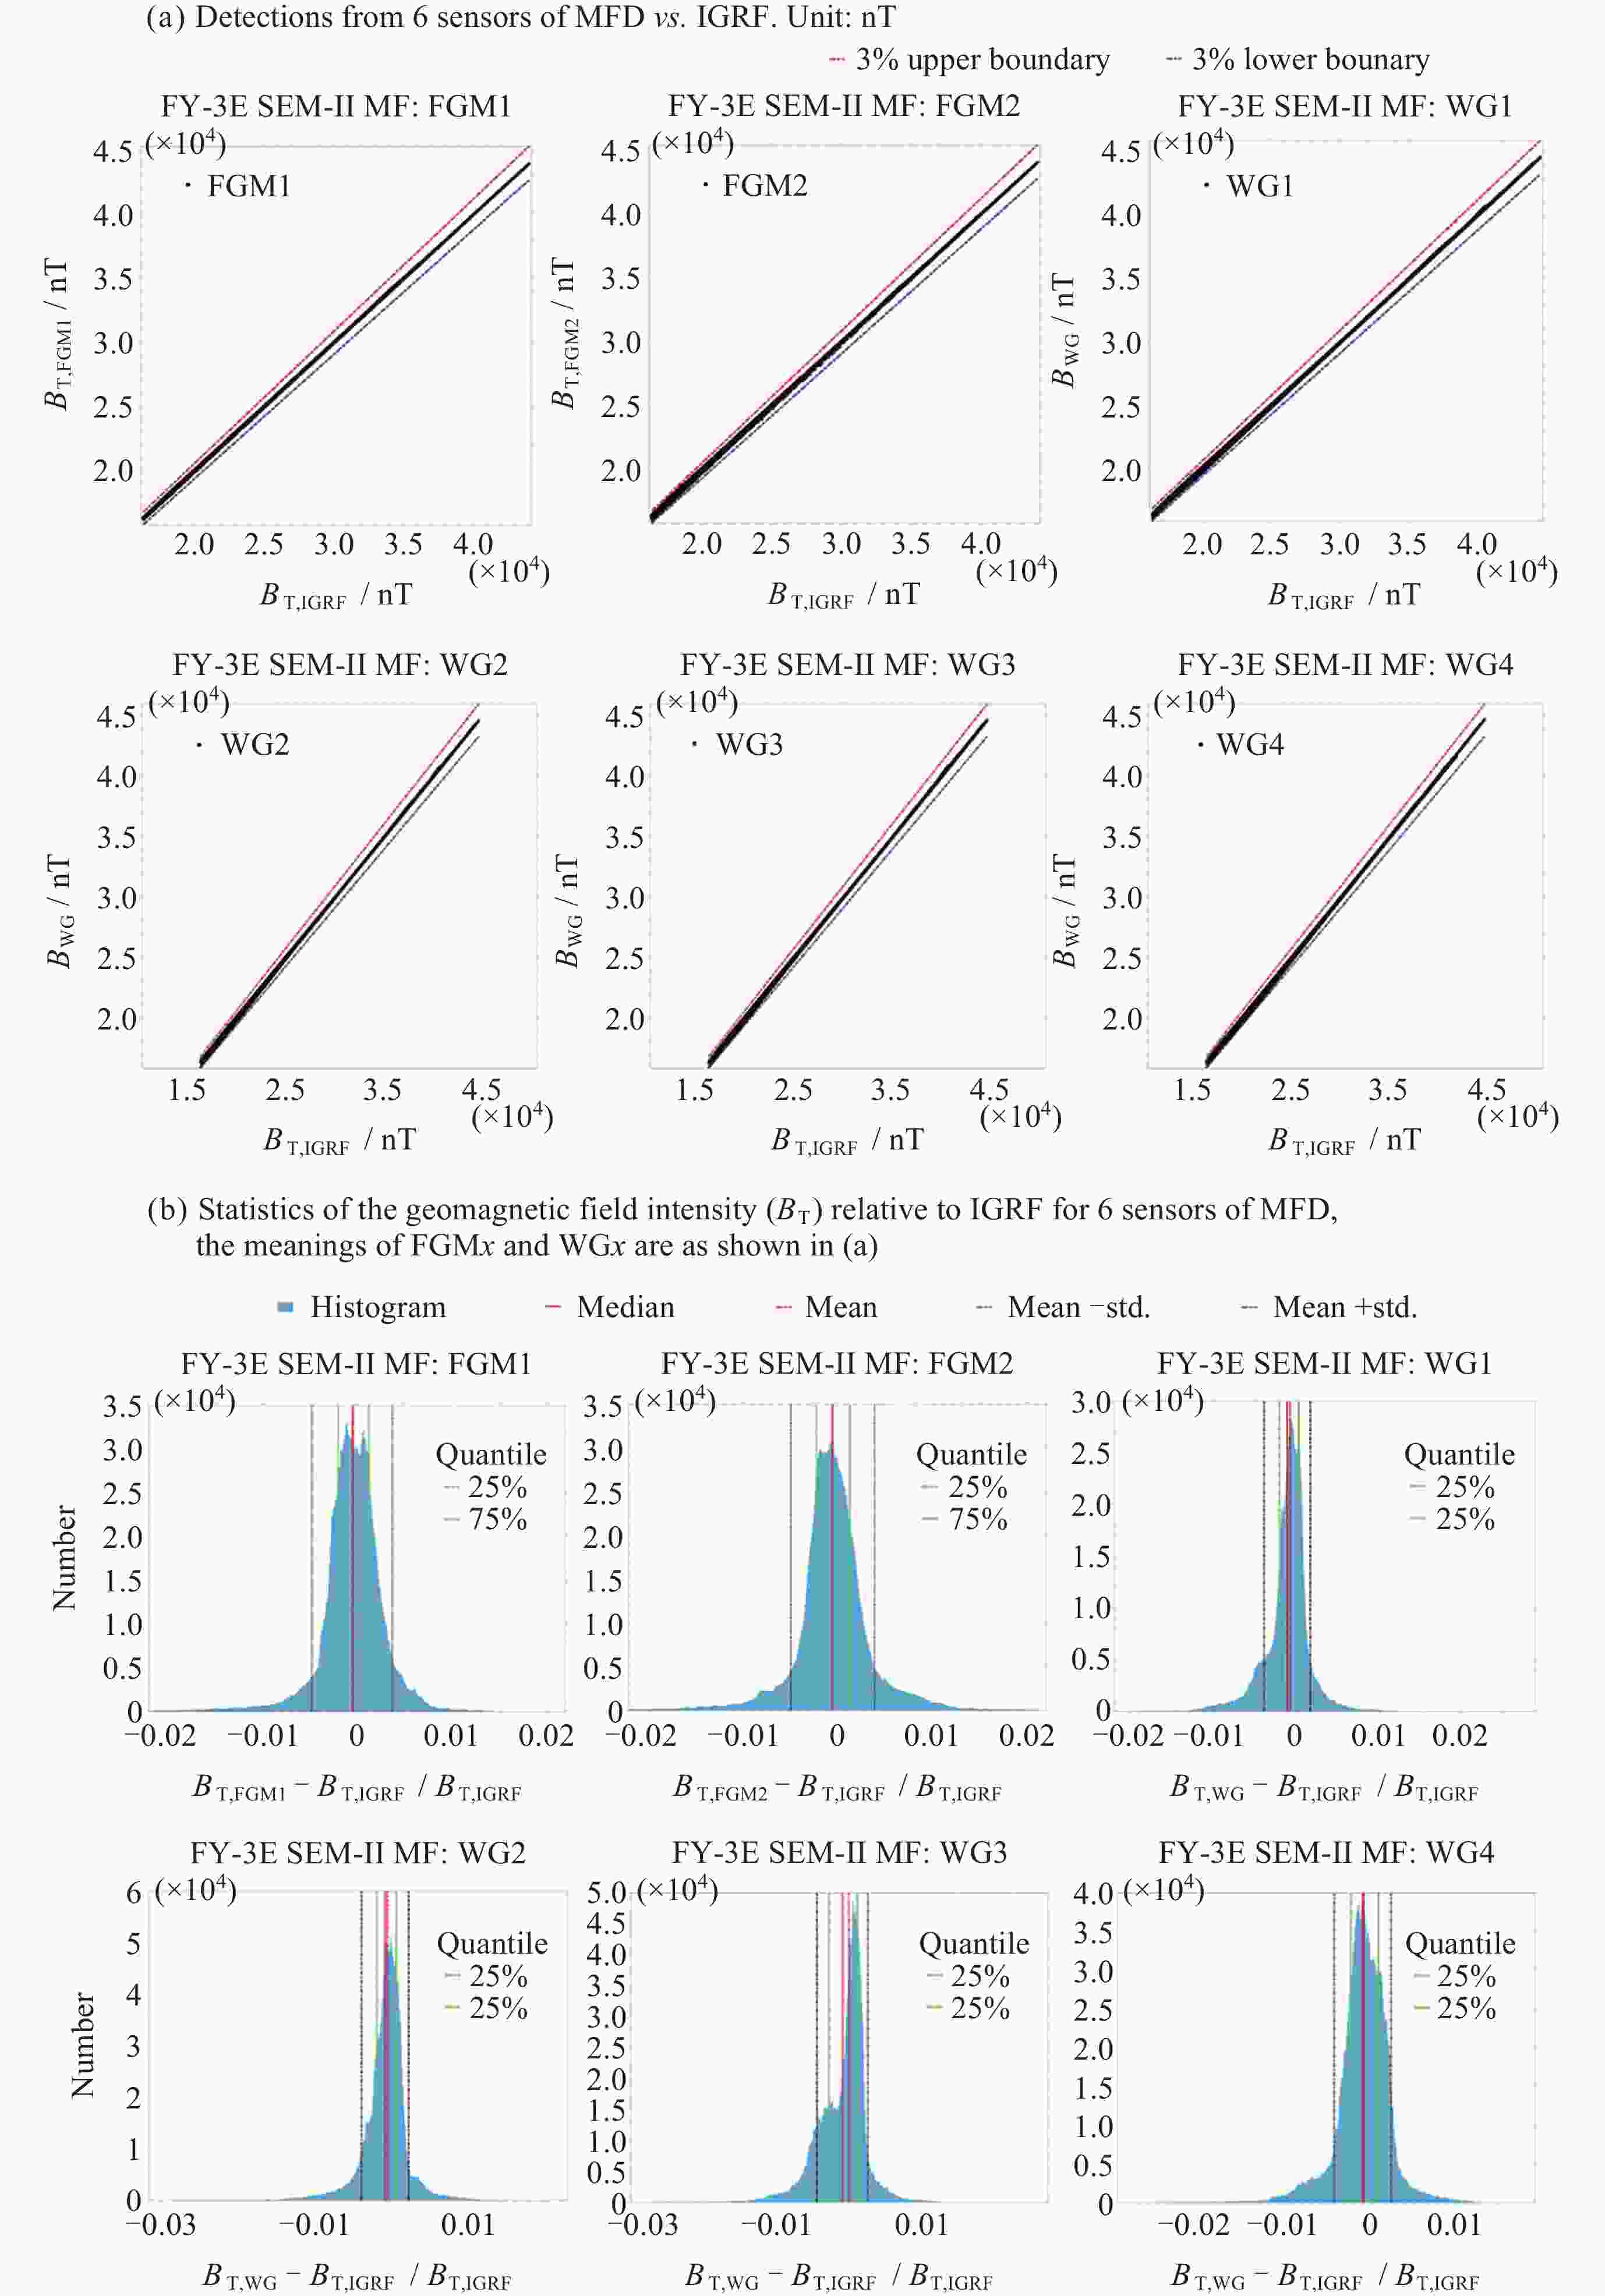
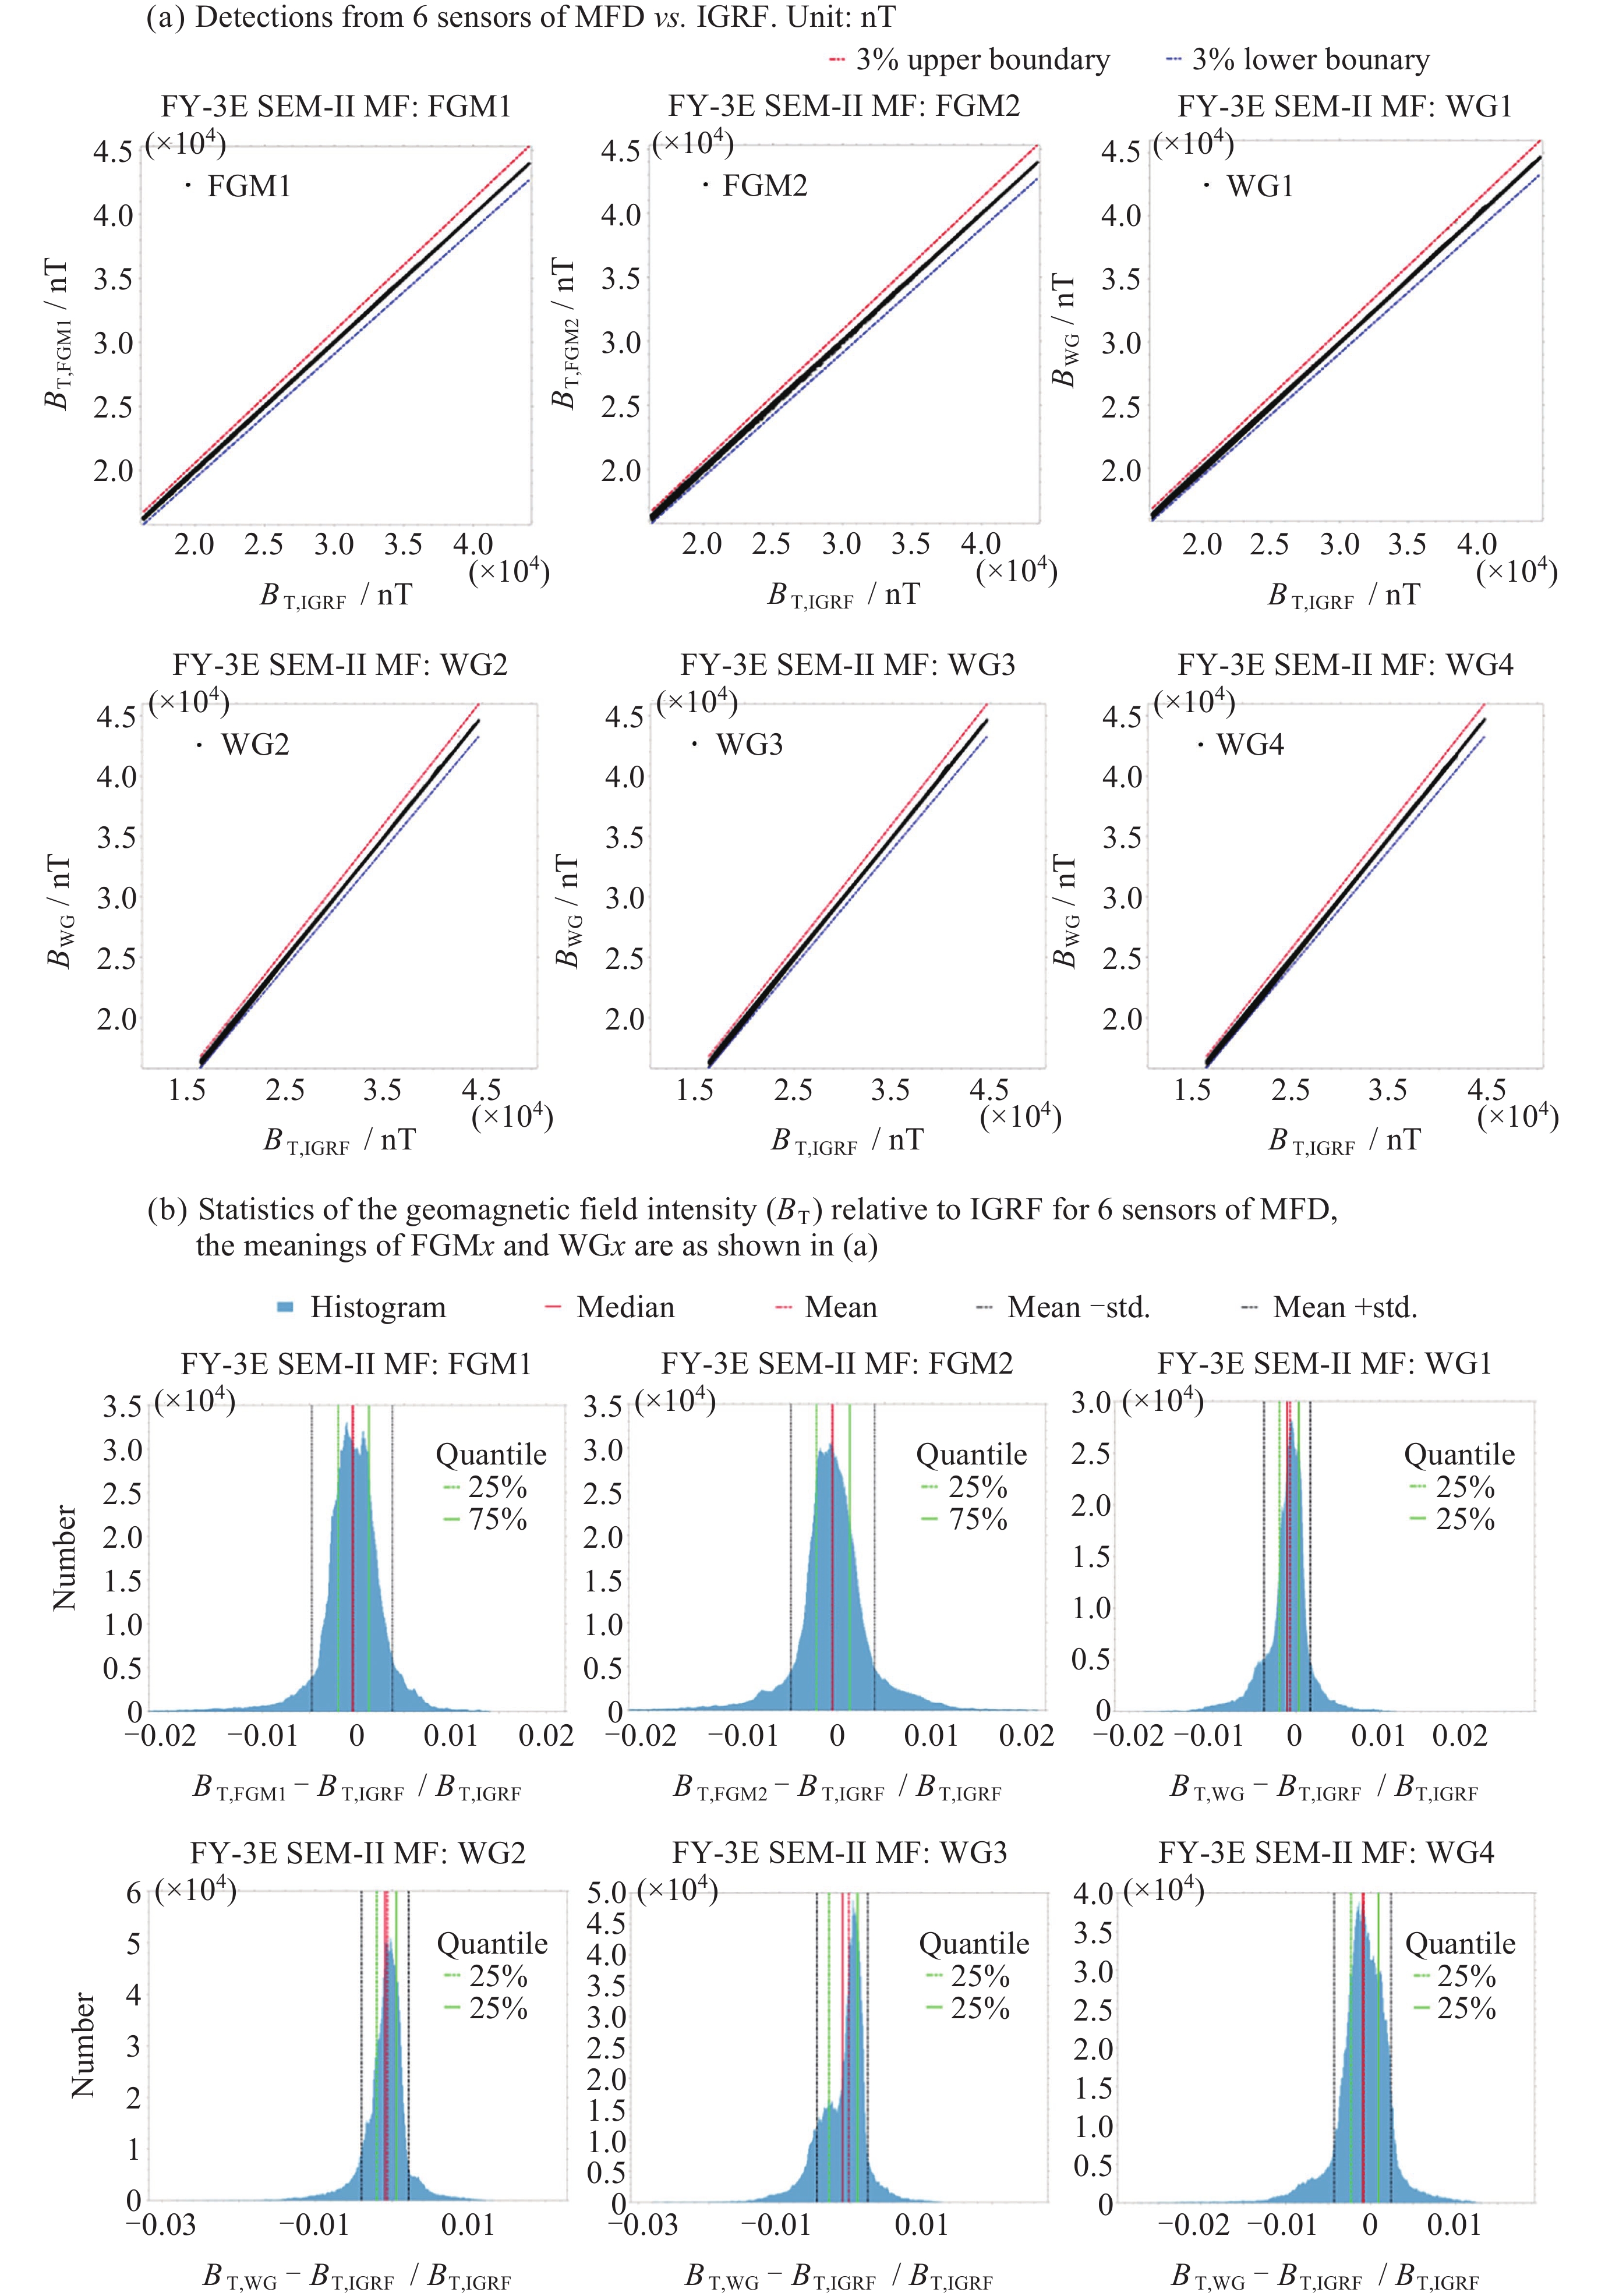
Figure 8. Quantitative comparisons of the total intensity between FY-3E_SEM-II_MFD and IGRF in August 2021
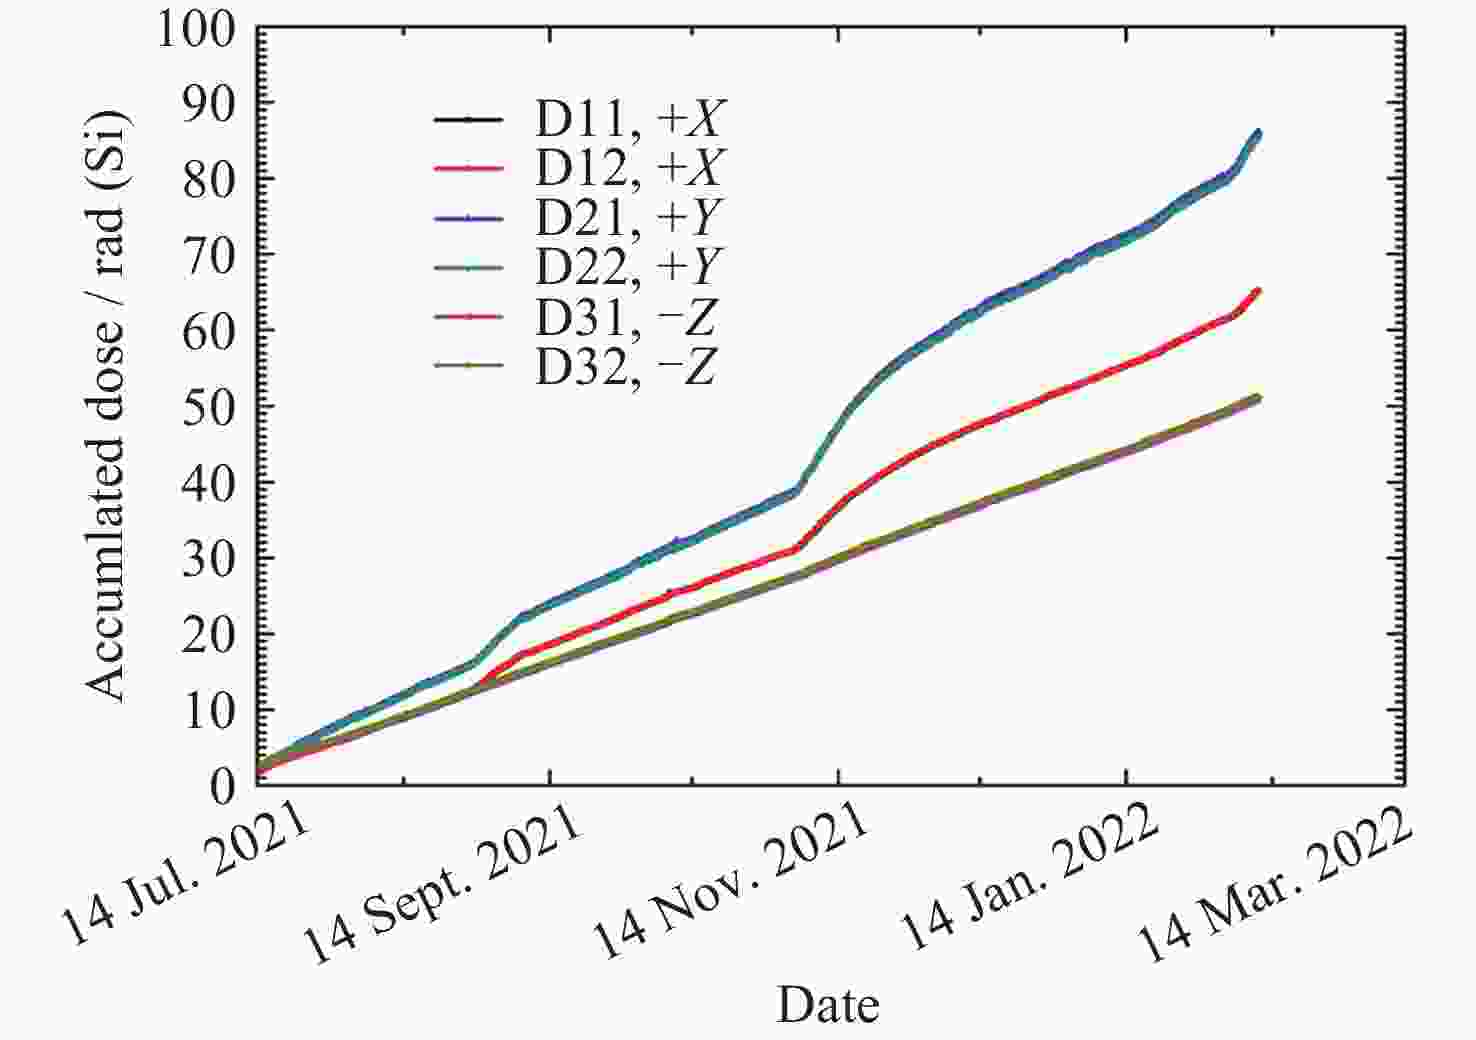
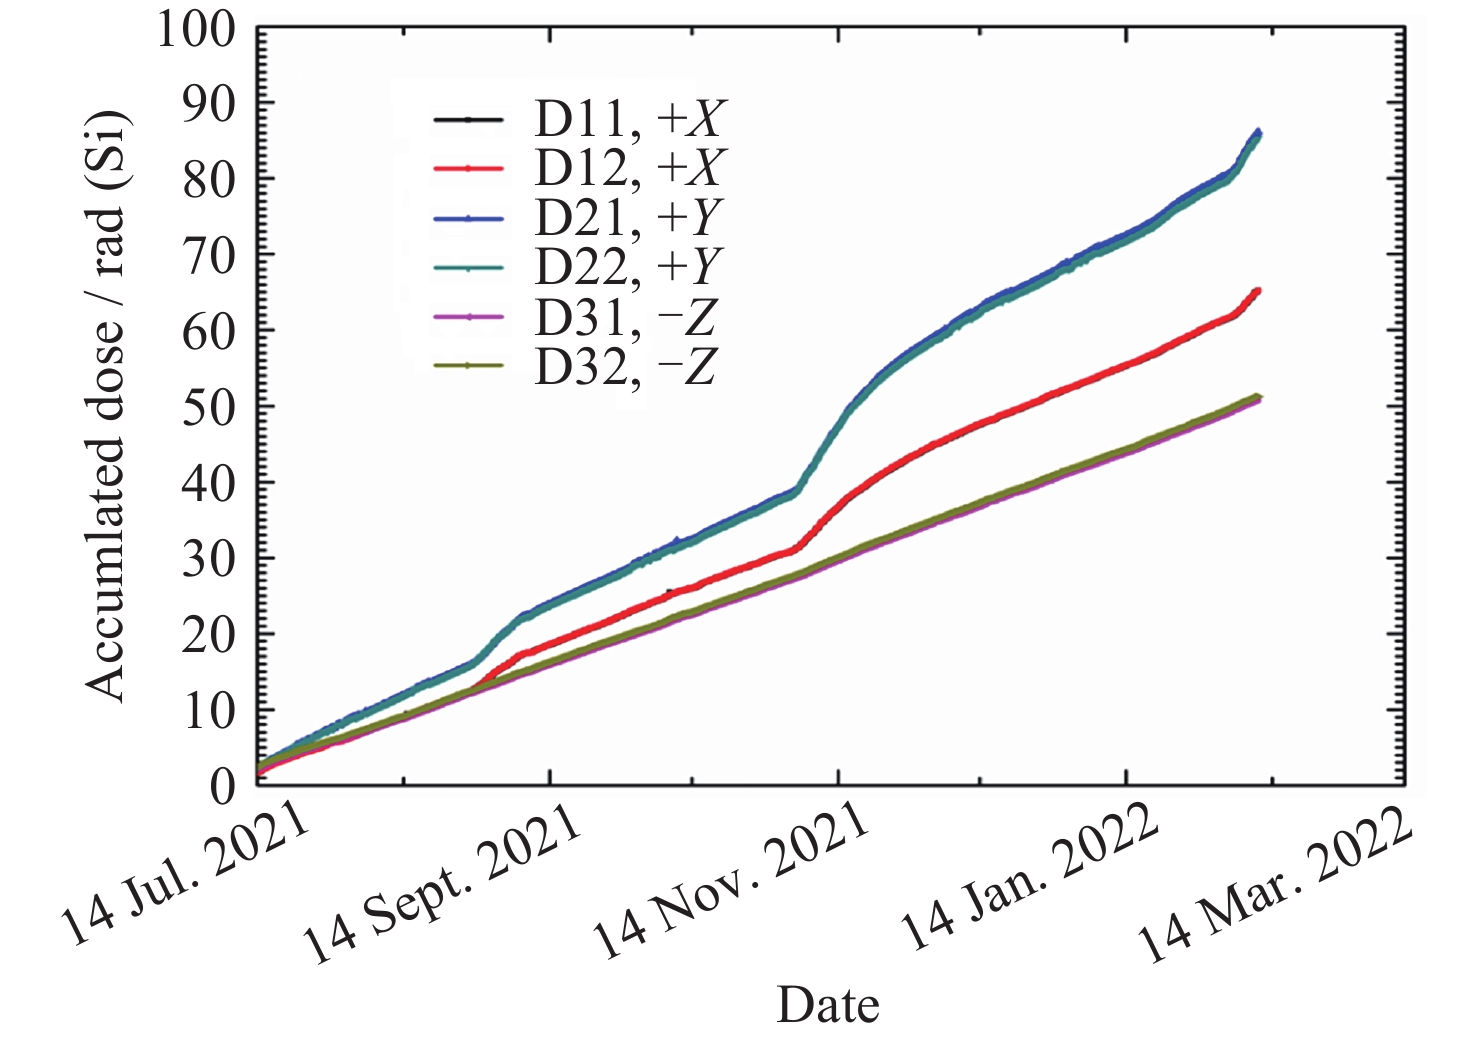
Figure 9. Radiation dose detected by FY-3E_SEM-II_RDD, the different colors denote the accumulated radiation dose from the different sensors in X/Y/-Z directions
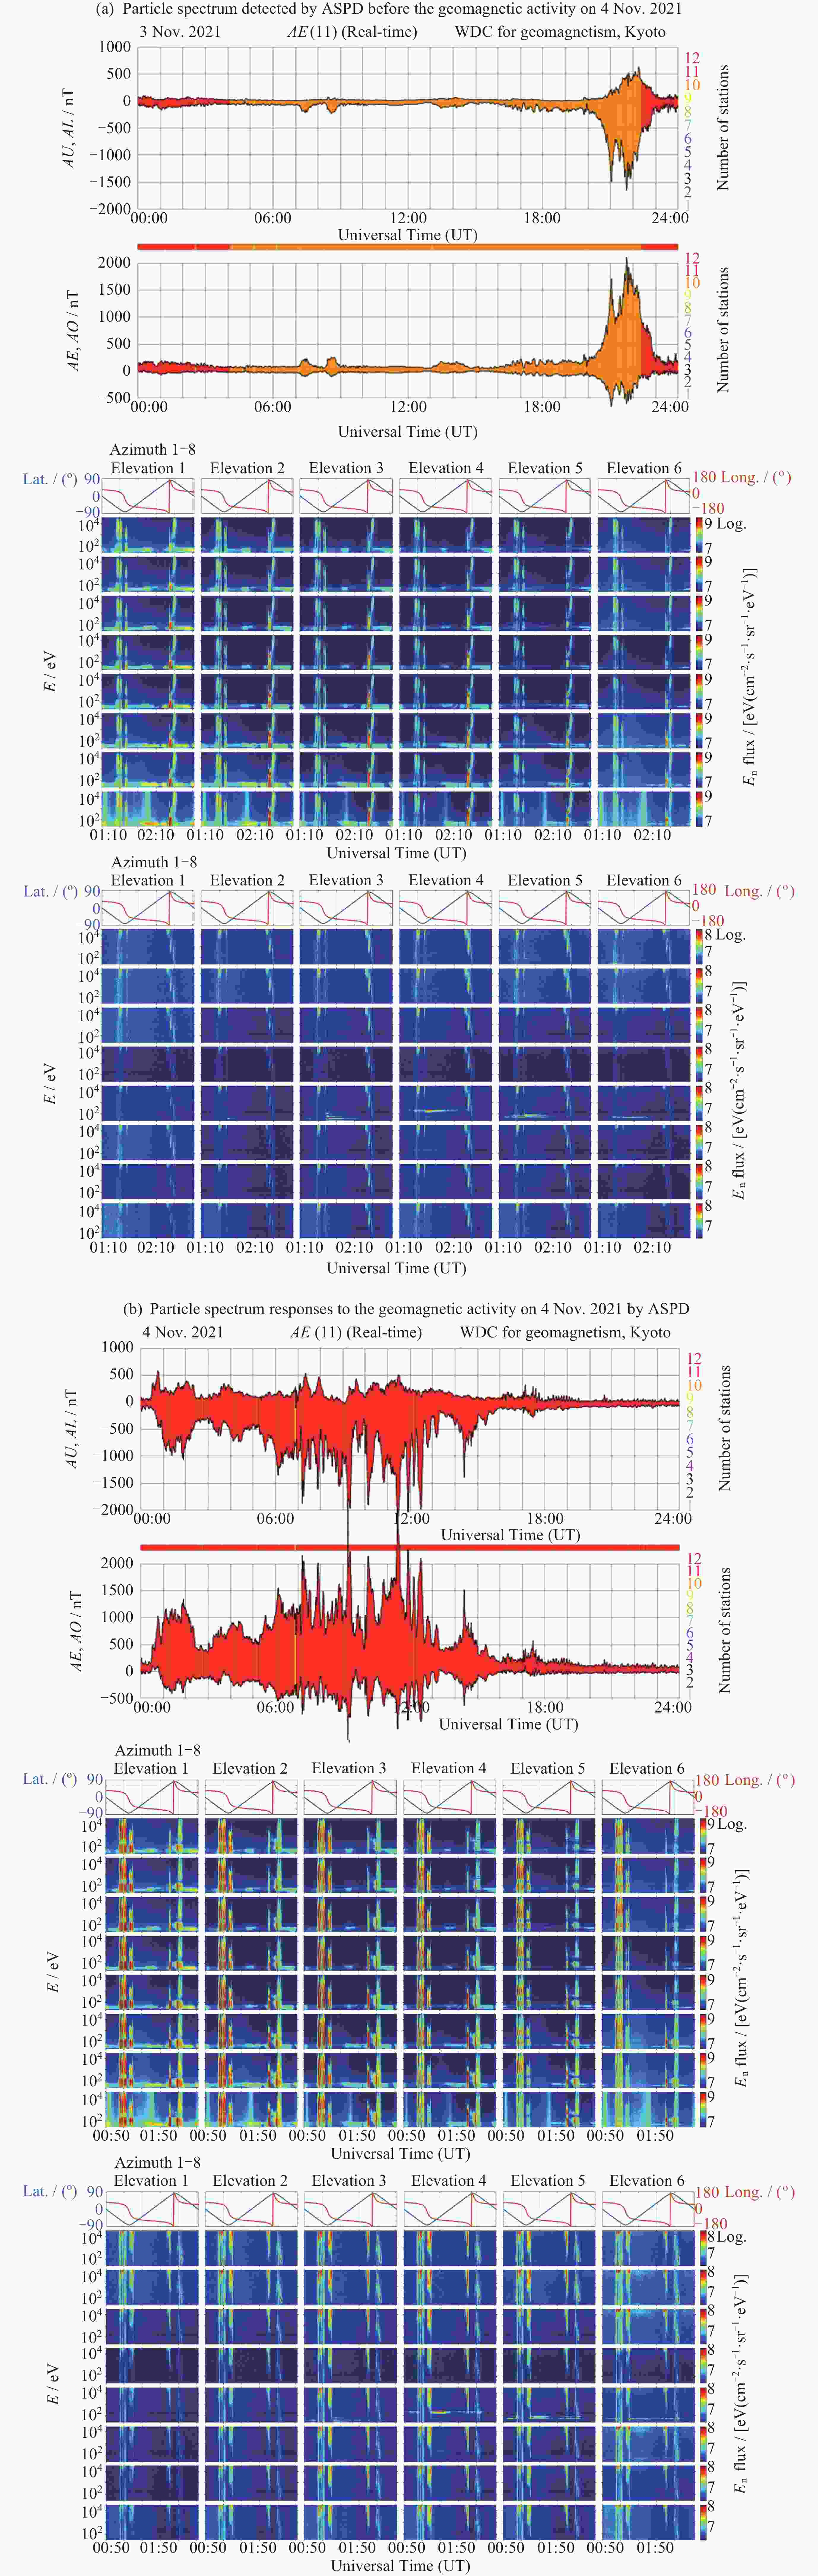
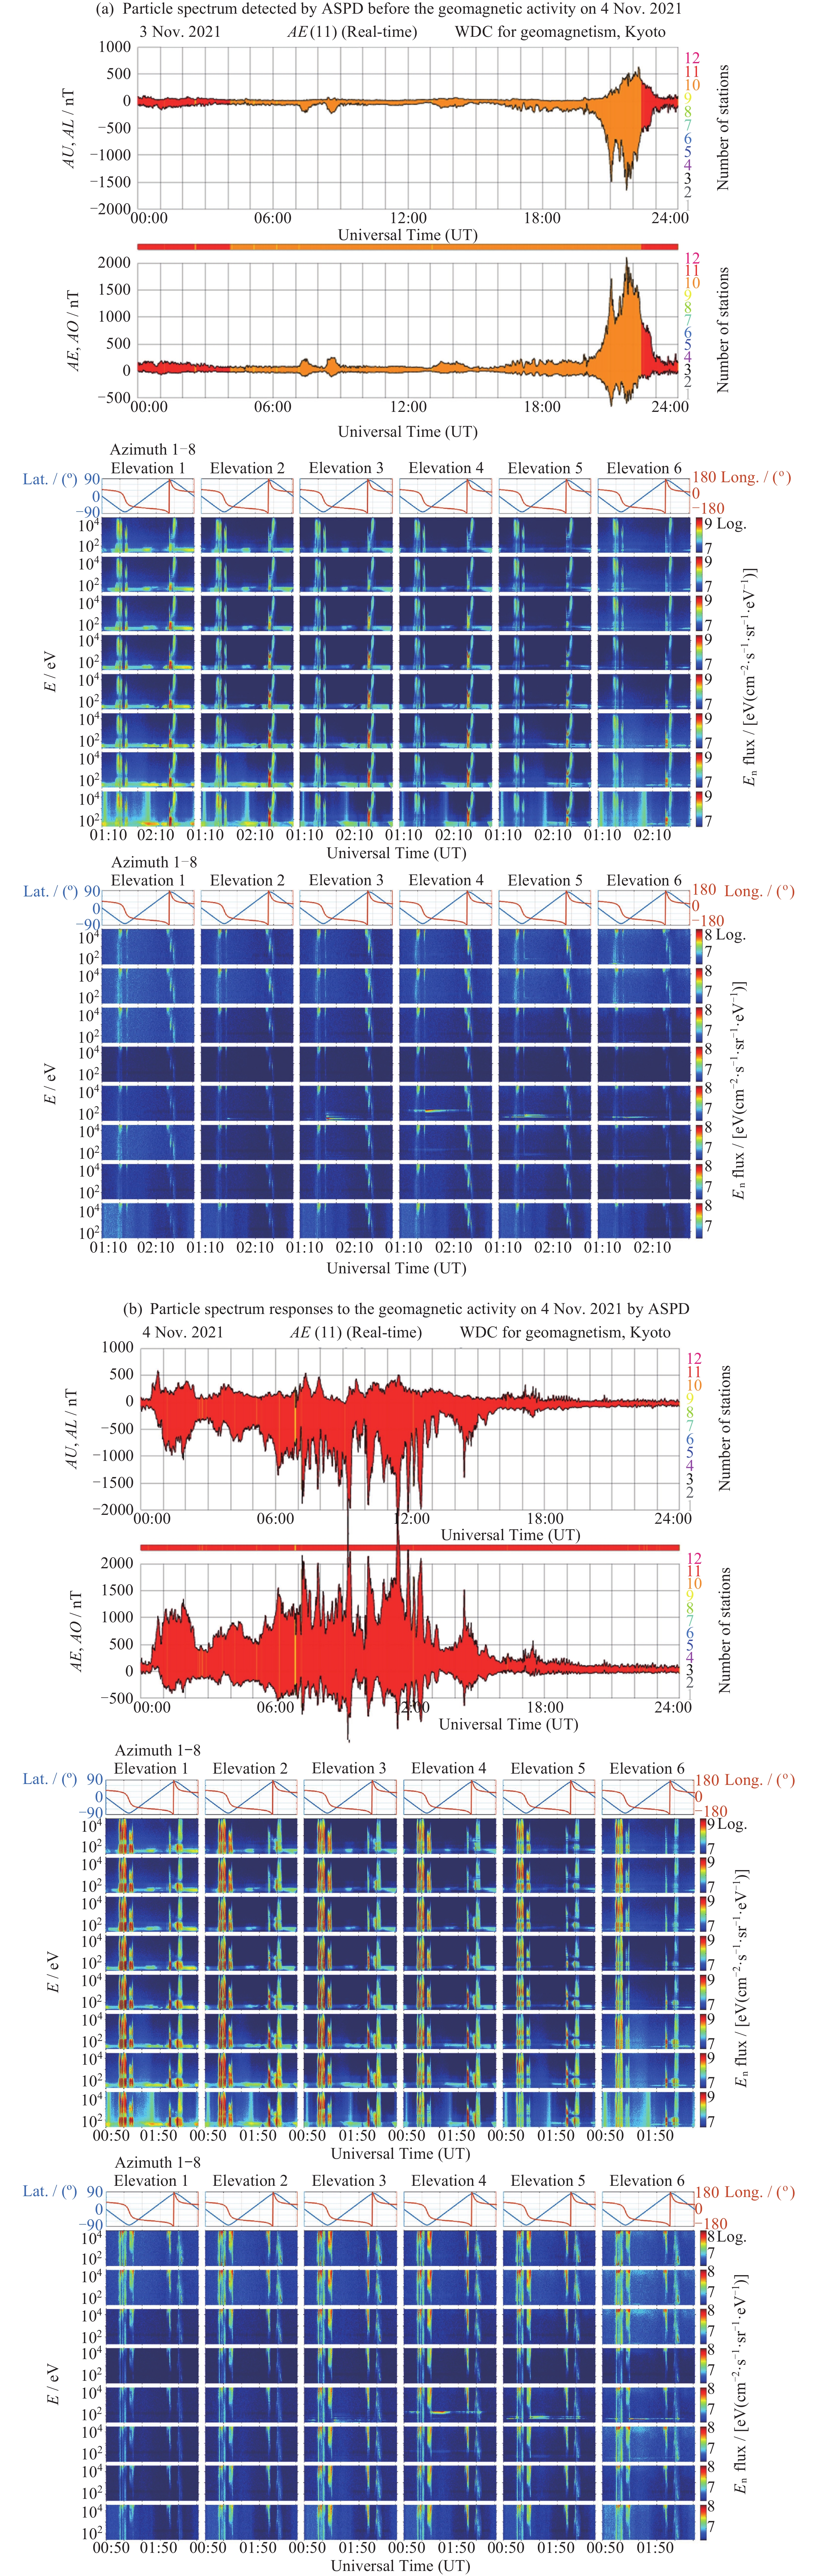
Figure 11. Plasma spectrum responses to the geomagnetic activity detected by ASPD onboard FY-3E
Table 1. Instruments specifications of FY-3E/SEM-II
Instrument name Observation object Installation geometry Sampling rate Sensitivity Channels High energy particles detector Integrated particle flux 3 directions in –X/Y/-Z with each direction’s view field ~ 40° 0.5 Hz 5% (ΔN/N) 6 energy bands for proton in 3-300 MeV;
5 energy bands for electron in 0.15-5.7 MeVMedium energy proton detector Integrated proton flux 18 directions with each direction’s view field ~ 20° 0.5 Hz 5% (ΔN/N) 12 energy bands for proton in 30 -5000 keV Medium energy electron detector Integrated electron flux 18 directions with each direction’s view field ~ 20° 0.5 Hz 5% (ΔN/N) 8 energy bands for electron in 30-600 keV Radiation dose detector Total radiation dose 3 probes installed on the interior surface of the outer wall of the satellite in X/Y/-Z 1/60 Hz 2 rad (Si) Each probe has 2 channels: one’s range is for 3×10⁴ rad (Si), the other’s range is for 5×10³ rad (Si) Surface potential detector Surface potential Relative Surface Potential Detector (RSPD) has 2 detectors: one faces to the night side, the other faces to the day side; Absolute Surface Potential Detector (ASPD)’s detail can be found in section 1.1.5 0.5 Hz <15 V RSPD has 2 channels; ASPD’s channels are illustrated in Figure 3 Magnetic field detector Magnetic field 6 sensors deployed on the satellite’s truss 50 Hz 0.1 nT Each sensor has three orthogonal channels to detect the magnetic field vectors  下载: 导出CSV
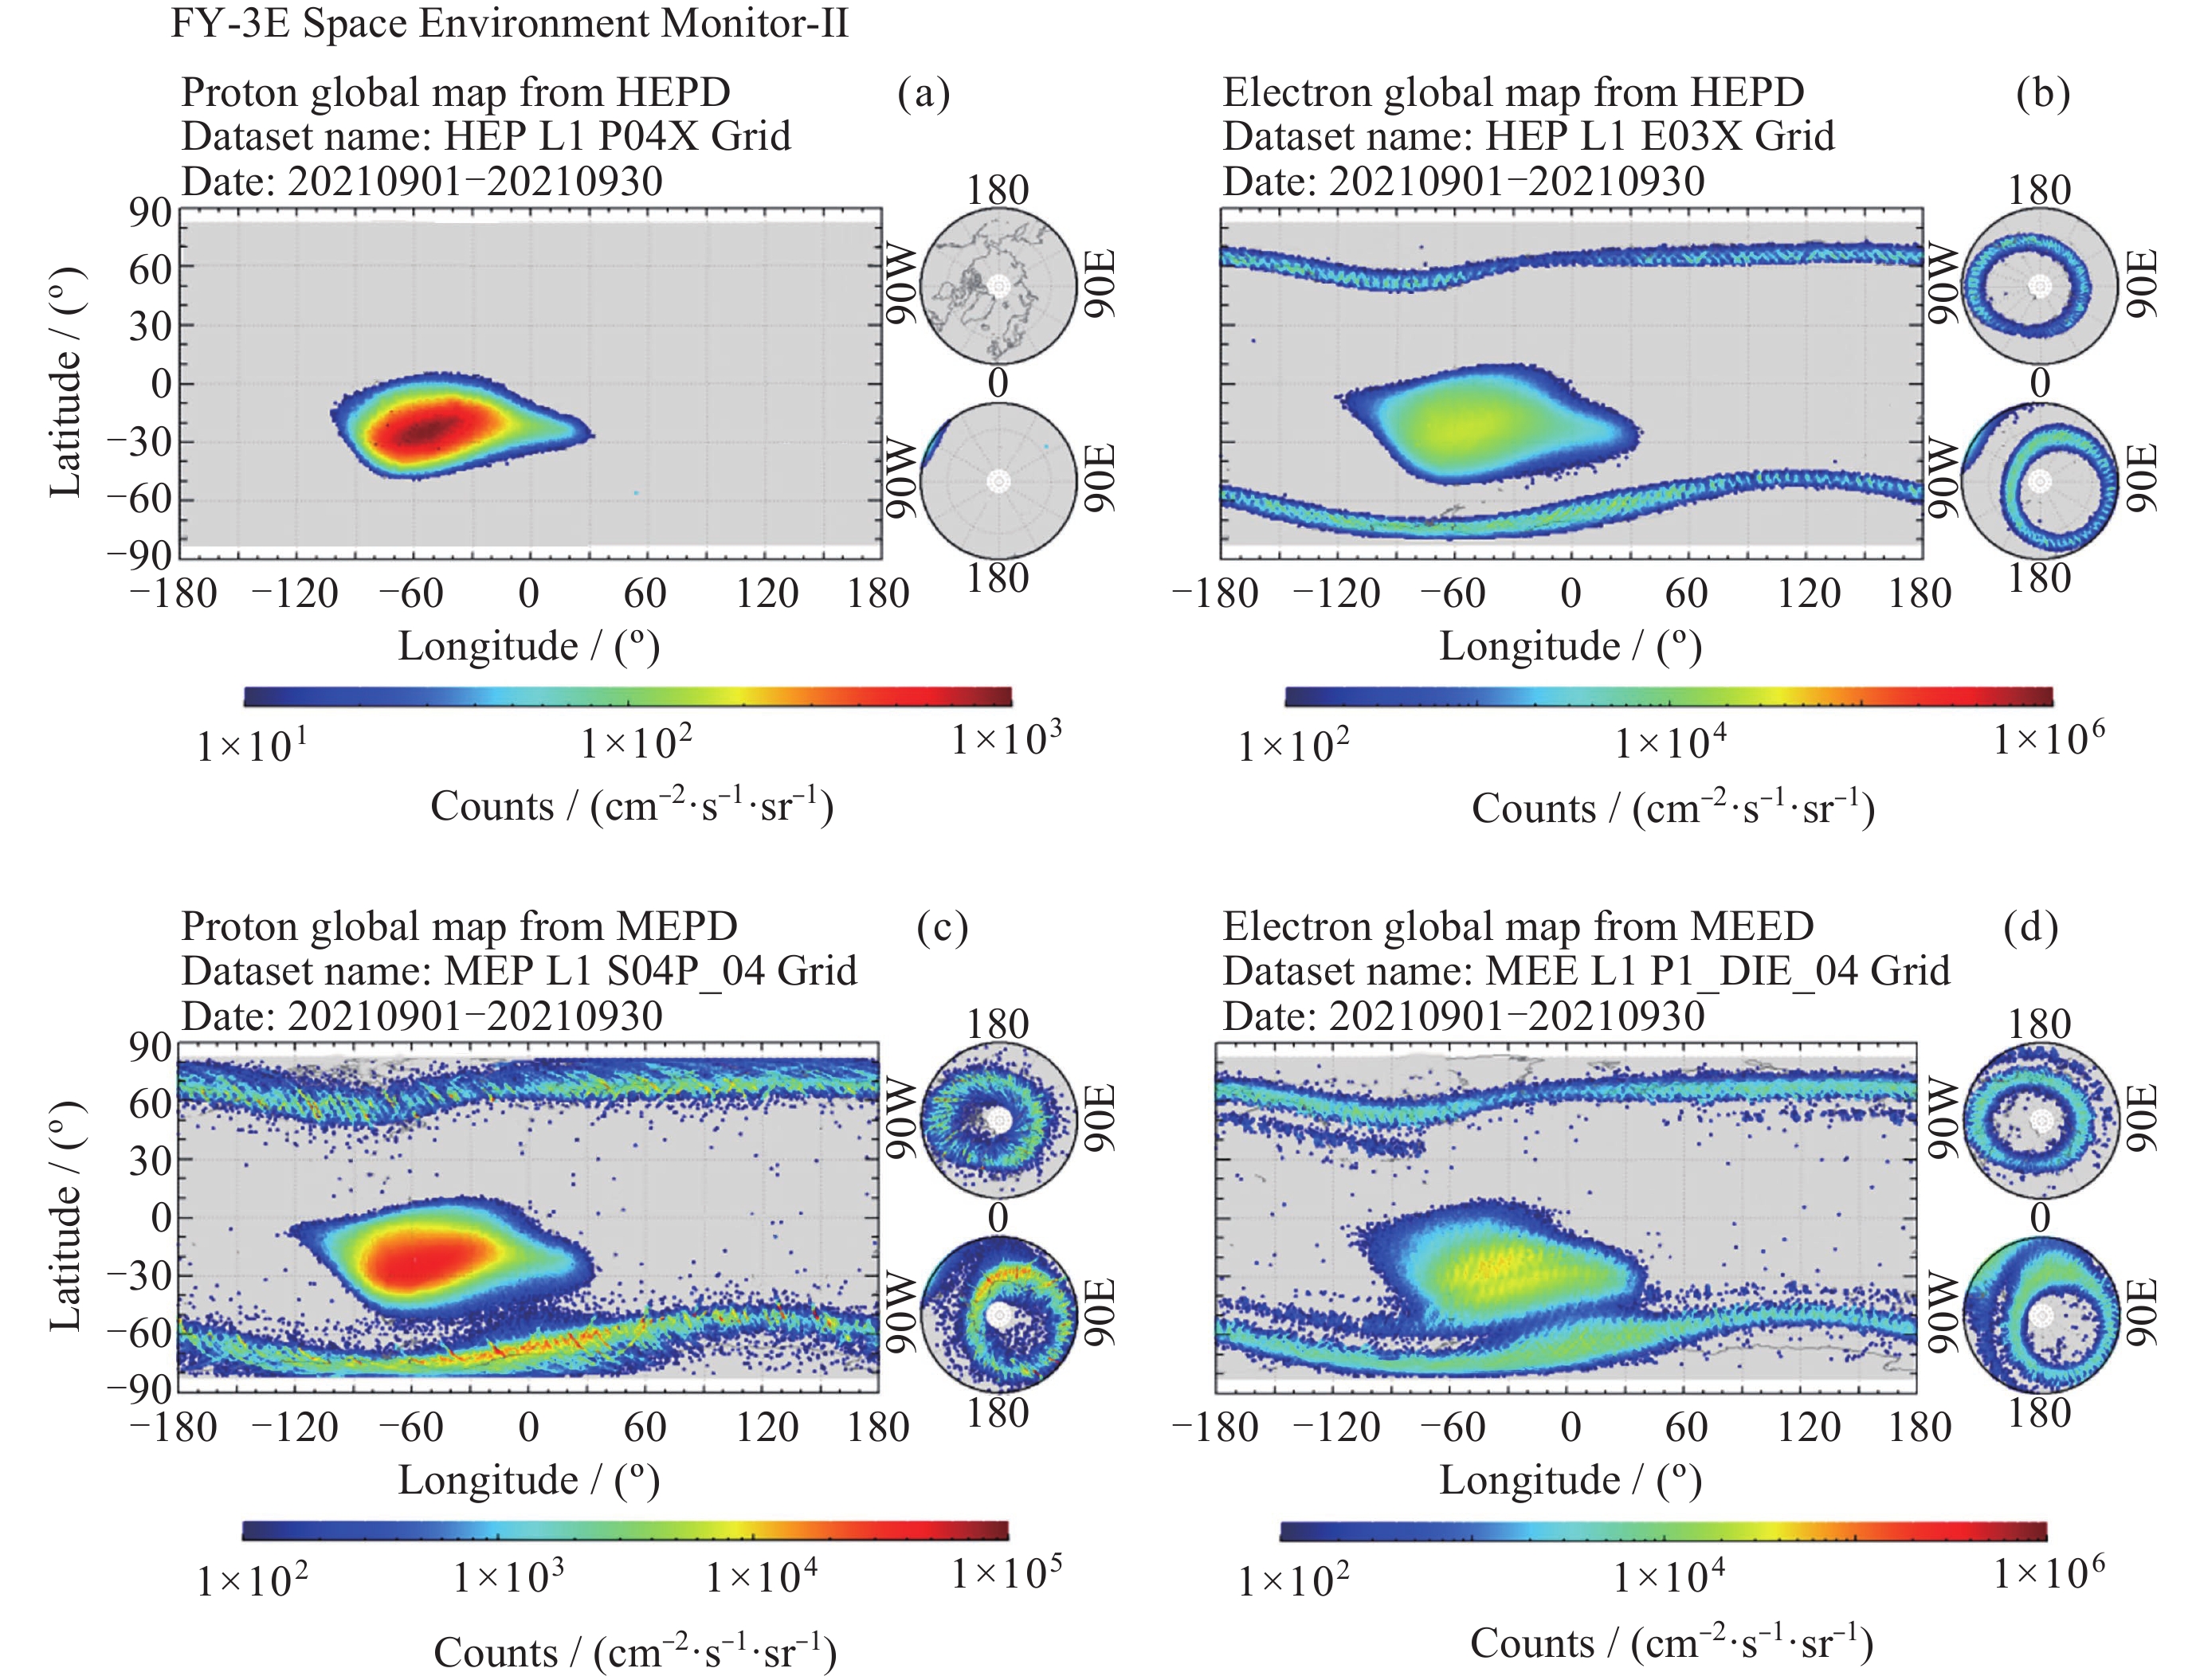
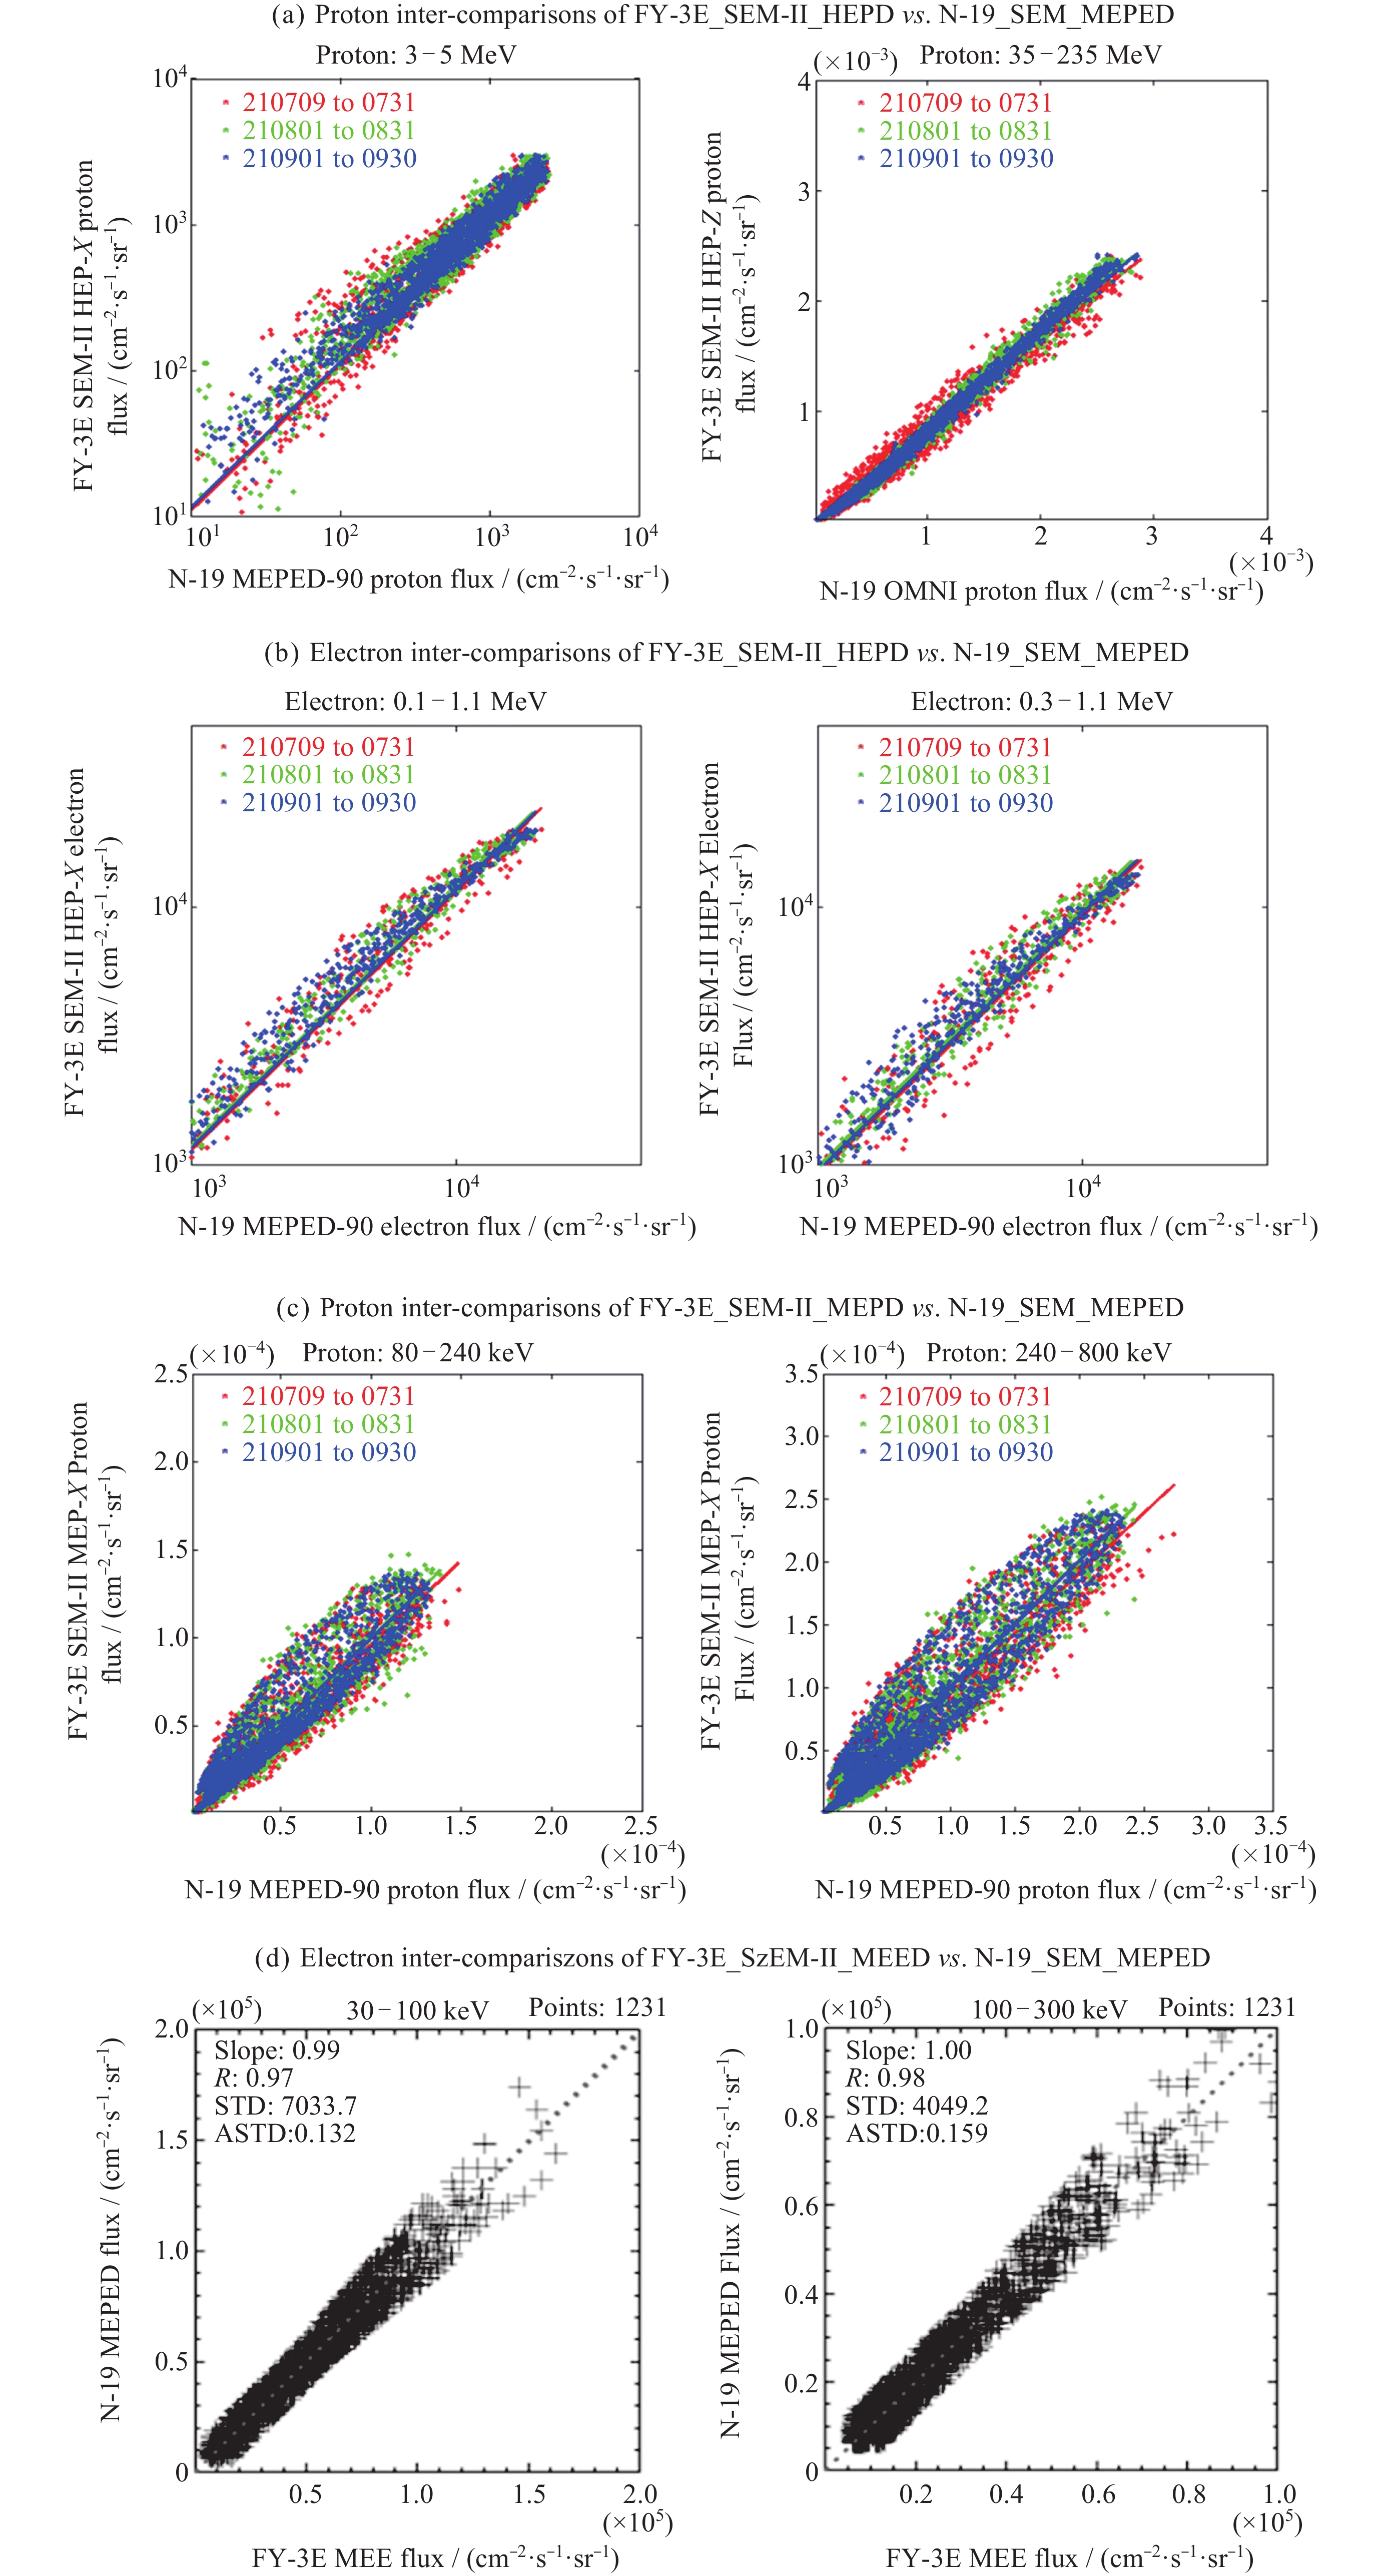
Table 2. Statistics for the particle inter-comparisons (FY-3E vs. N-19) in Fig. 6
Time Correlation coefficient Slope Average Relative Deviation (ASTD) Spots number FY-3E HEP –X vs. N-19 MEPED90: 3-5 MeV Jul. 2021 0.94 1.10 20.22% 1971 Aug. 2021 0.95 1.15 23.35% 1957 Sept. 2021 0.96 1.15 20.39% 1953 FY-3E HEP –Z vs. N-19 OMNI: 35 - 275 MeV Jul. 2021 0.99 0.93 19.92% 2065 Aug. 2021 0.99 0.86 17.03% 2077 Sept. 2021 0.99 0.85 17.74% 2077 FY-3E HEP –X vs. N-19 MEPED90: 0.1 - 1.1 MeV Jul. 2021 0.96 1.14 23.46% 325 Aug. 2021 0.98 1.19 24.60% 326 Sept. 2021 0.99 1.17 24.41% 442 FY-3E HEP –X vs. N-19 MEPED90: 0.3 - 1.1 MeV Jul. 2021 0.96 0.92 17.75% 325 Aug. 2021 0.97 0.98 13.13% 326 Sept. 2021 0.99 0.94 10.88% 442 FY-3E MEP –X vs. N-19 MEPED90: 80 - 240 keV Jul. 2021 0.92 0.86 24.69% 1600 Aug. 2021 0.93 0.91 23.85% 1714 Sept. 2021 0.94 0.93 21.38% 1837 FY-3E MEP –X vs. N-19 MEPED90: 240-800 keV Jul. 2021 0.95 0.99 20.87% 2089 Aug. 2021 0.96 1.05 20.04% 2040 Sept. 2021 0.96 1.05 19.29% 2101 FY-3E MEE vs. N-19 MEPED00: 30-100 keV Sept. 2021 0.97 0.99 13.2% 1231 FY-3E MEE vs. N-19 MEPED90: 100-300 keV Sept. 2021 0.98 1.00 15.9% 1231
下载: 导出CSV
-
[1] HUANG C, LI J W, YU T, et al. The capabilities and applications of FY-3A/B SEM on monitoring space weather events[J]. IEEE Transactions on Geoscience and Remote Sensing, 2012, 50(12): 4975-4985 doi: 10.1109/TGRS.2012.2207388 [2] WANG C Q, ZHANG X G, LI J W, et al. Cross-calibration of high energetic particles data-a case study between FY-3B and NOAA-17[J]. Science China Technological Sciences, 2013, 56(11): 2668-2674 doi: 10.1007/s11431-013-5375-2 [3] LI J W, HUANG C, YU C, et al. Inspection and application of energetic particles data of FY-3C/SEM satellite[J]. Journal of Remote Sensing, 2018, 22(1): 76-86 [4] ZHANG S Y, ZHANG X G, WANG C Q, et al. The geometric factor of high energy protons detector on FY-3 satellite[J]. Science China Earth Sciences, 2014, 57(10): 2558-2566 doi: 10.1007/s11430-014-4853-0 [5] GUBBY R, EVANS J. Space environment effects and satellite design[J]. Journal of Atmospheric and Solar-Terrestrial Physics, 2002, 64(16): 1723-1733 doi: 10.1016/S1364-6826(02)00122-0 [6] ZHANG B Q, SHEN G H, HUANG C, et al. Total ionizing dose measured with the radiation dosimeter onboard the FY-3E satellite[J]. Journal of Geophysical Research: Space Physics, 2025, 130(1): e2024JA033016 doi: 10.1029/2024JA033016 [7] 都亨, 叶宗海. 低轨道航天器空间环境手册[M]. 北京: 国防工业出版社, 1996Du H, Ye Z H. Space Environment Handbook for LEO Spacecraft[S]. Beijing, China: National Defence Industry Press, 1996 [8] CODRESCU M V, FULLER-ROWELL T J, ROBLE R G, et al. Medium energy particle precipitation influences on the mesosphere and lower thermosphere[J]. Journal of Geophysical Research: Space Physics, 1997, 102(A9): 19977-19987 doi: 10.1029/97JA01728 [9] LI X L, BAKER D N, KANEKAL S G, et al. Long term measurements of radiation belts by SAMPEX and their variations[J]. Geophysical Research Letters, 2001, 28(20): 3827-3830 doi: 10.1029/2001gl013586 [10] SAWYER D M, VETTE J I. AP-8 Trapped Proton Environment for Solar Maximum and Solar Minimum[R]. Washington: National Aeronautics and Space Administration (NASA), 1976: 76-06 [11] VETTE J I. The AE-8 Trapped Electron Model Environment[R]. Washington: National Aeronautics and Space Administration (NASA), 1991: 91-24 [12] NORTHROP T G, TELLER E. Stability of the adiabatic motion of charged particles in the Earth’s field[J]. Physical Review Journals Archive, 1960, 117(1): 215 [13] MCLLWAIN C E. Coordinates for mapping the distribution of magnetically trapped particles[J]. Journal of Geophysical Research, 1961, 66(11): 3681-3691 doi: 10.1029/JZ066i011p03681 [14] HESS W. The Radiation Belt and Magnetosphere[M]. Waltham: Blaisdell, 1968 [15] HECKMAN H H, NAKANO G H. Low-altitude trapped protons during solar minimum period, 1962-1966[J]. Journal of Geophysical Research, 1969, 74(14): 3575-3590 doi: 10.1029/JA074i014p03575 -
-

 下载:

计量
- 文章访问数: 768
- HTML全文浏览量: 99
- PDF下载量: 89
-
被引次数:
0(来源:Crossref)
0(来源:其他)

